
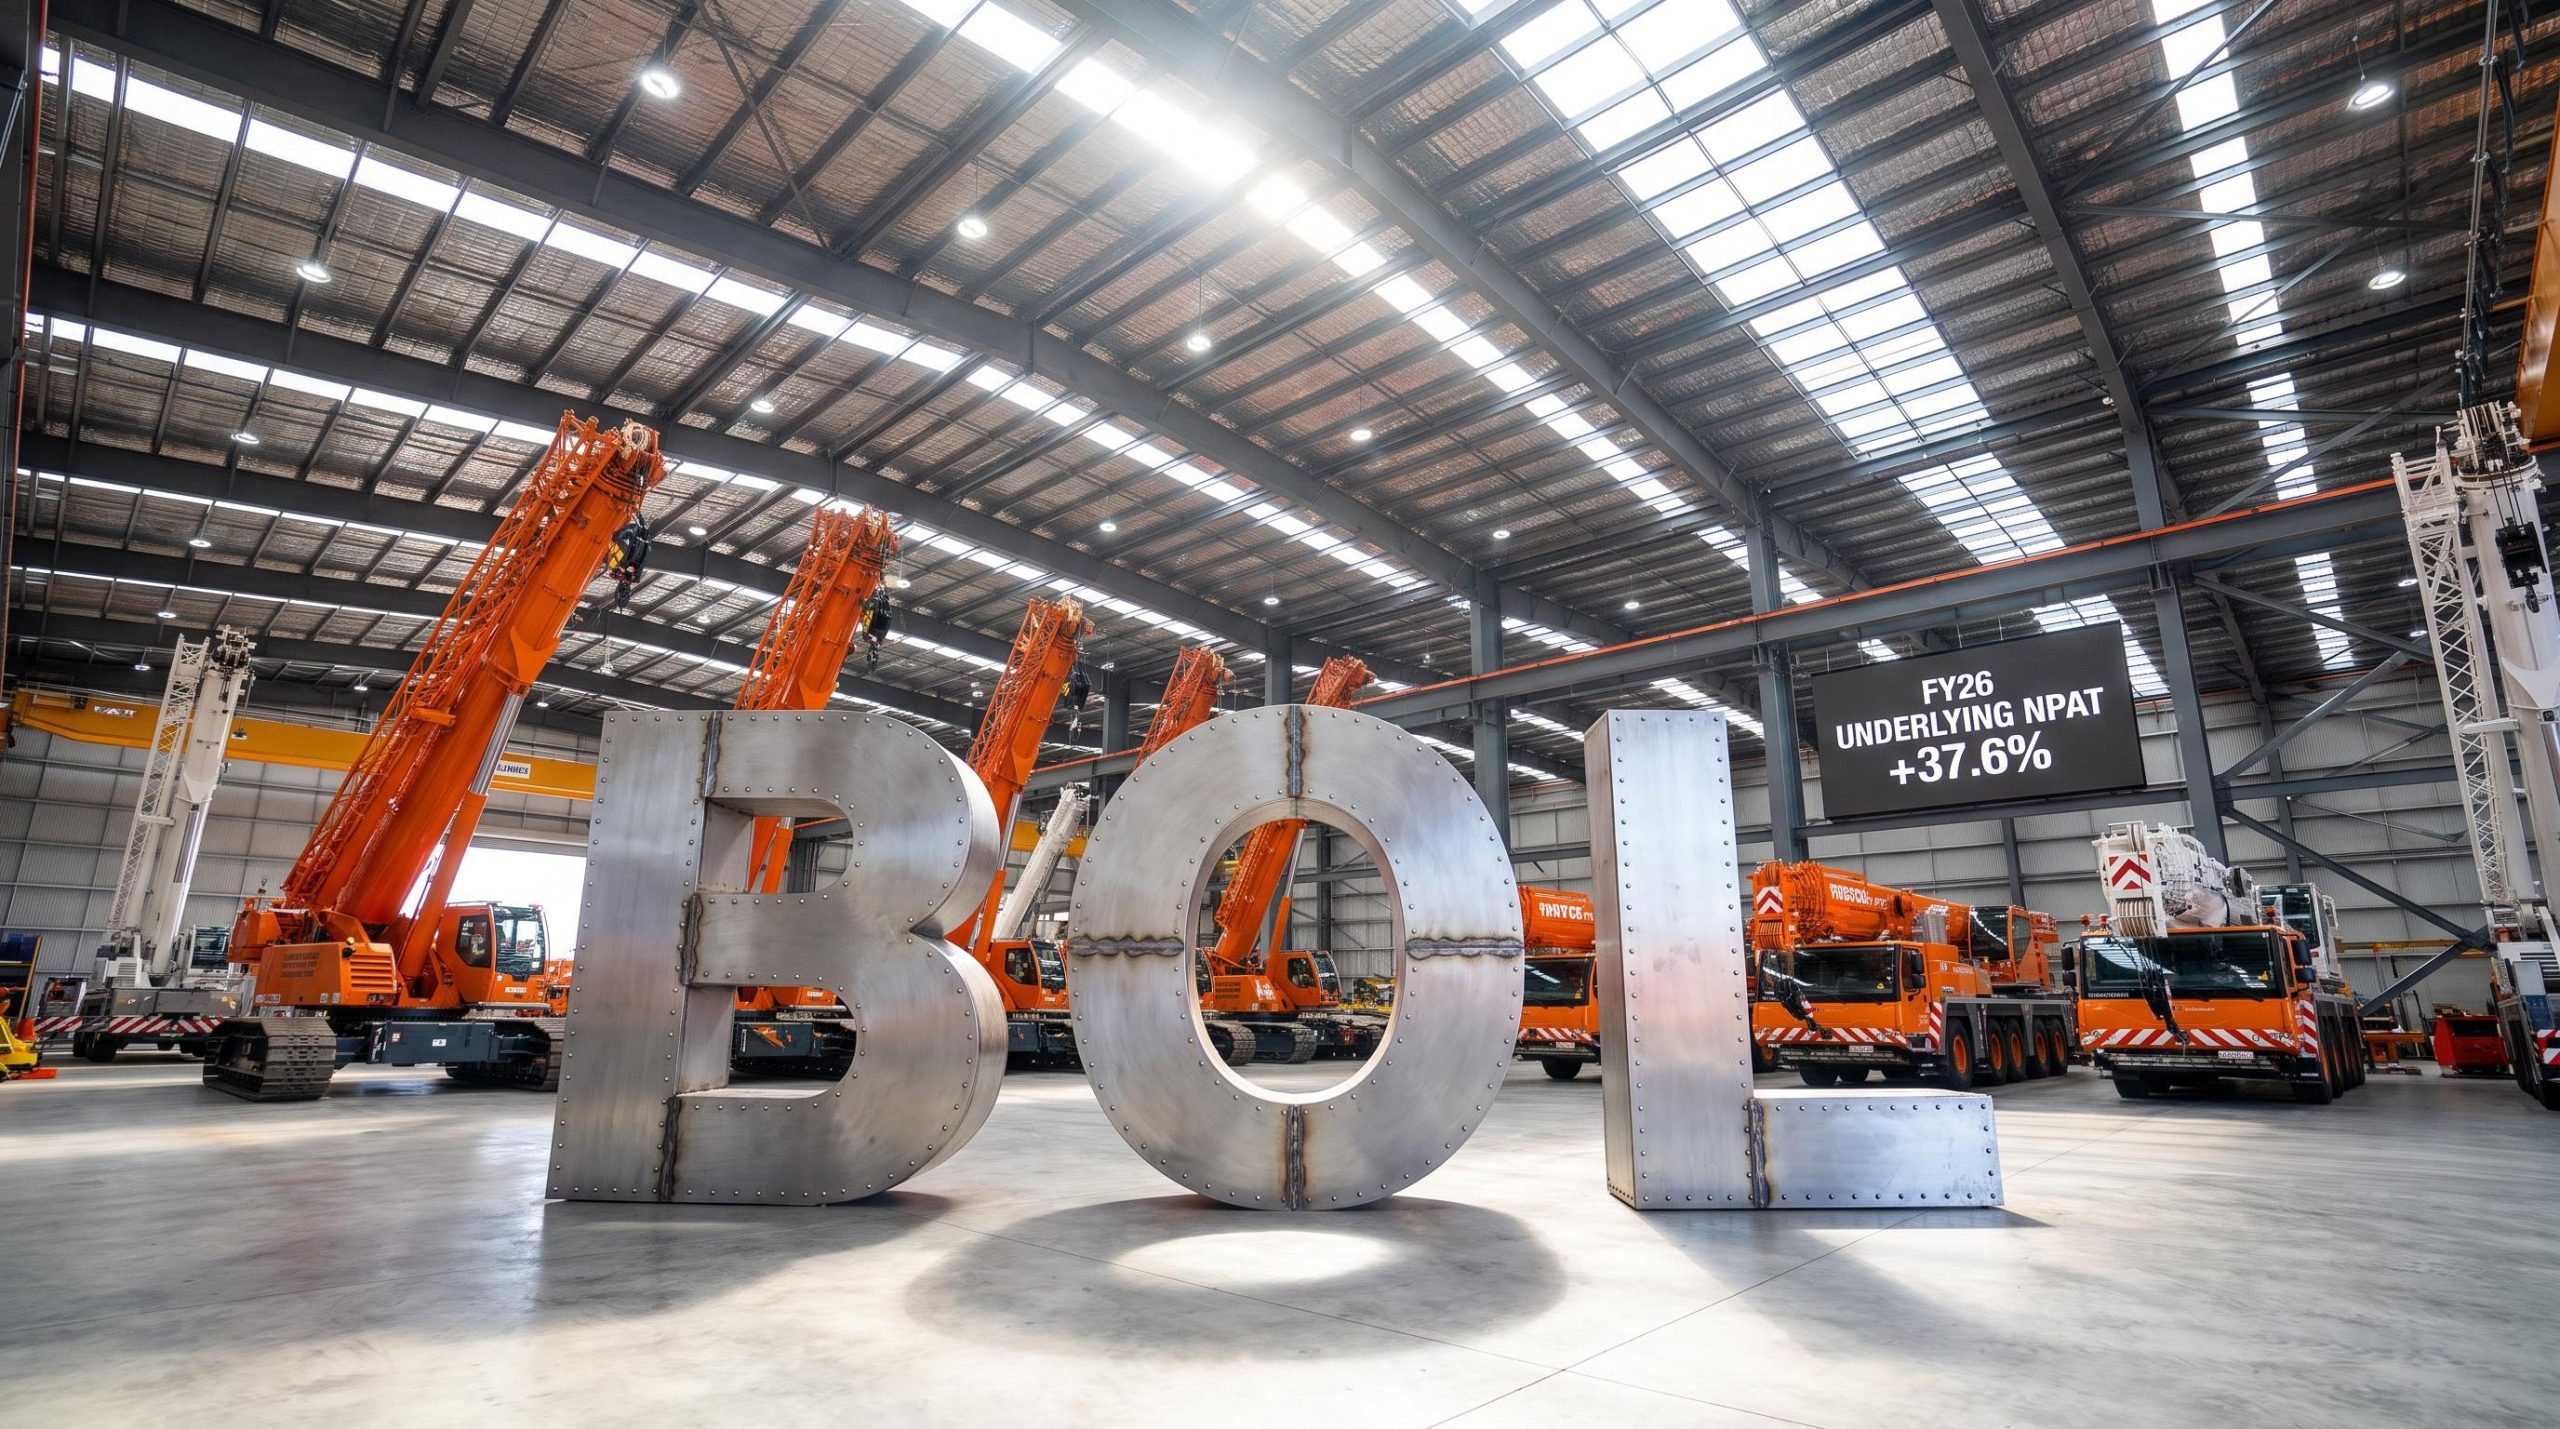
Boom Logistics lifts underlying profit 38% in FY26 results
In its FY26 full year results presentation delivered on 19 August 2026, Boom Logistics (ASX: BOL) outlined a result headlined by underlying net profit after tax (NPAT) of $12.8m, up 37.6%, and underlying earnings per share (EPS) of 32.9 cents, up 48.2%.
The presentation, delivered by Managing Director and Chief Executive Officer Lester Fernandez and Chief Financial Officer Pieter Le Roux, reported revenue of $271m (+2.4%) and free cash flow of $18.3m (+83%).
Boom described itself as Australia’s only ASX-listed integrated project logistics services company, operating 17 depots and approximately 295 assets aligned to customer needs across resources, infrastructure, renewables and industrials.
Statutory NPAT was reported at $11m, down from $23.3m in FY25. That prior-year figure included a $14m deferred tax benefit that inflated the statutory comparison, making the underlying measure the meaningful basis for assessing year-on-year performance.
When big ASX news breaks, our subscribers know first
FY26 performance: earnings quality drives the result
The FY26 result was driven by cost discipline, asset utilisation and pricing rather than revenue volume alone. Boom noted improved margins through cost control, stable utilisation rates and stronger cash conversion, which lifted free cash flow well ahead of revenue growth.
On a statutory basis, EBITDA rose to $51.8m and net profit before tax increased 18% to $11m. The apparent statutory NPAT decline reflects the absence of the FY25 one-off deferred tax benefit rather than a deterioration in trading. On an underlying basis, which excludes that benefit, NPAT grew 38%.
| Metric | FY26 | FY25 | Change |
|---|---|---|---|
| Revenue | $271m | $264.6m | +2.4% |
| Underlying EBITDA | $53.3m | — | +6.6% |
| Underlying NPAT | $12.8m | $9.3m | +37.6% |
| Free cash flow | $18.3m | $10.0m | +83% |
| Underlying EPS | 32.9c | 22.2c | +48.2% |
| Cash at bank | $24.7m | $14.3m | +72.7% |
The one-off adjustments explained
To arrive at the underlying result, the presentation detailed the following adjustments:
-
$2.3m in costs relating to the response to the Clark Creek site fatality incident, added back to the underlying result.
-
$0.8m representing the net recoupment of misused company funds by a former employee.
-
The FY25 $14m deferred tax benefit, which inflated statutory FY25 NPAT and is excluded from the underlying comparison.
Segment shift: Resources and Infrastructure now dominate
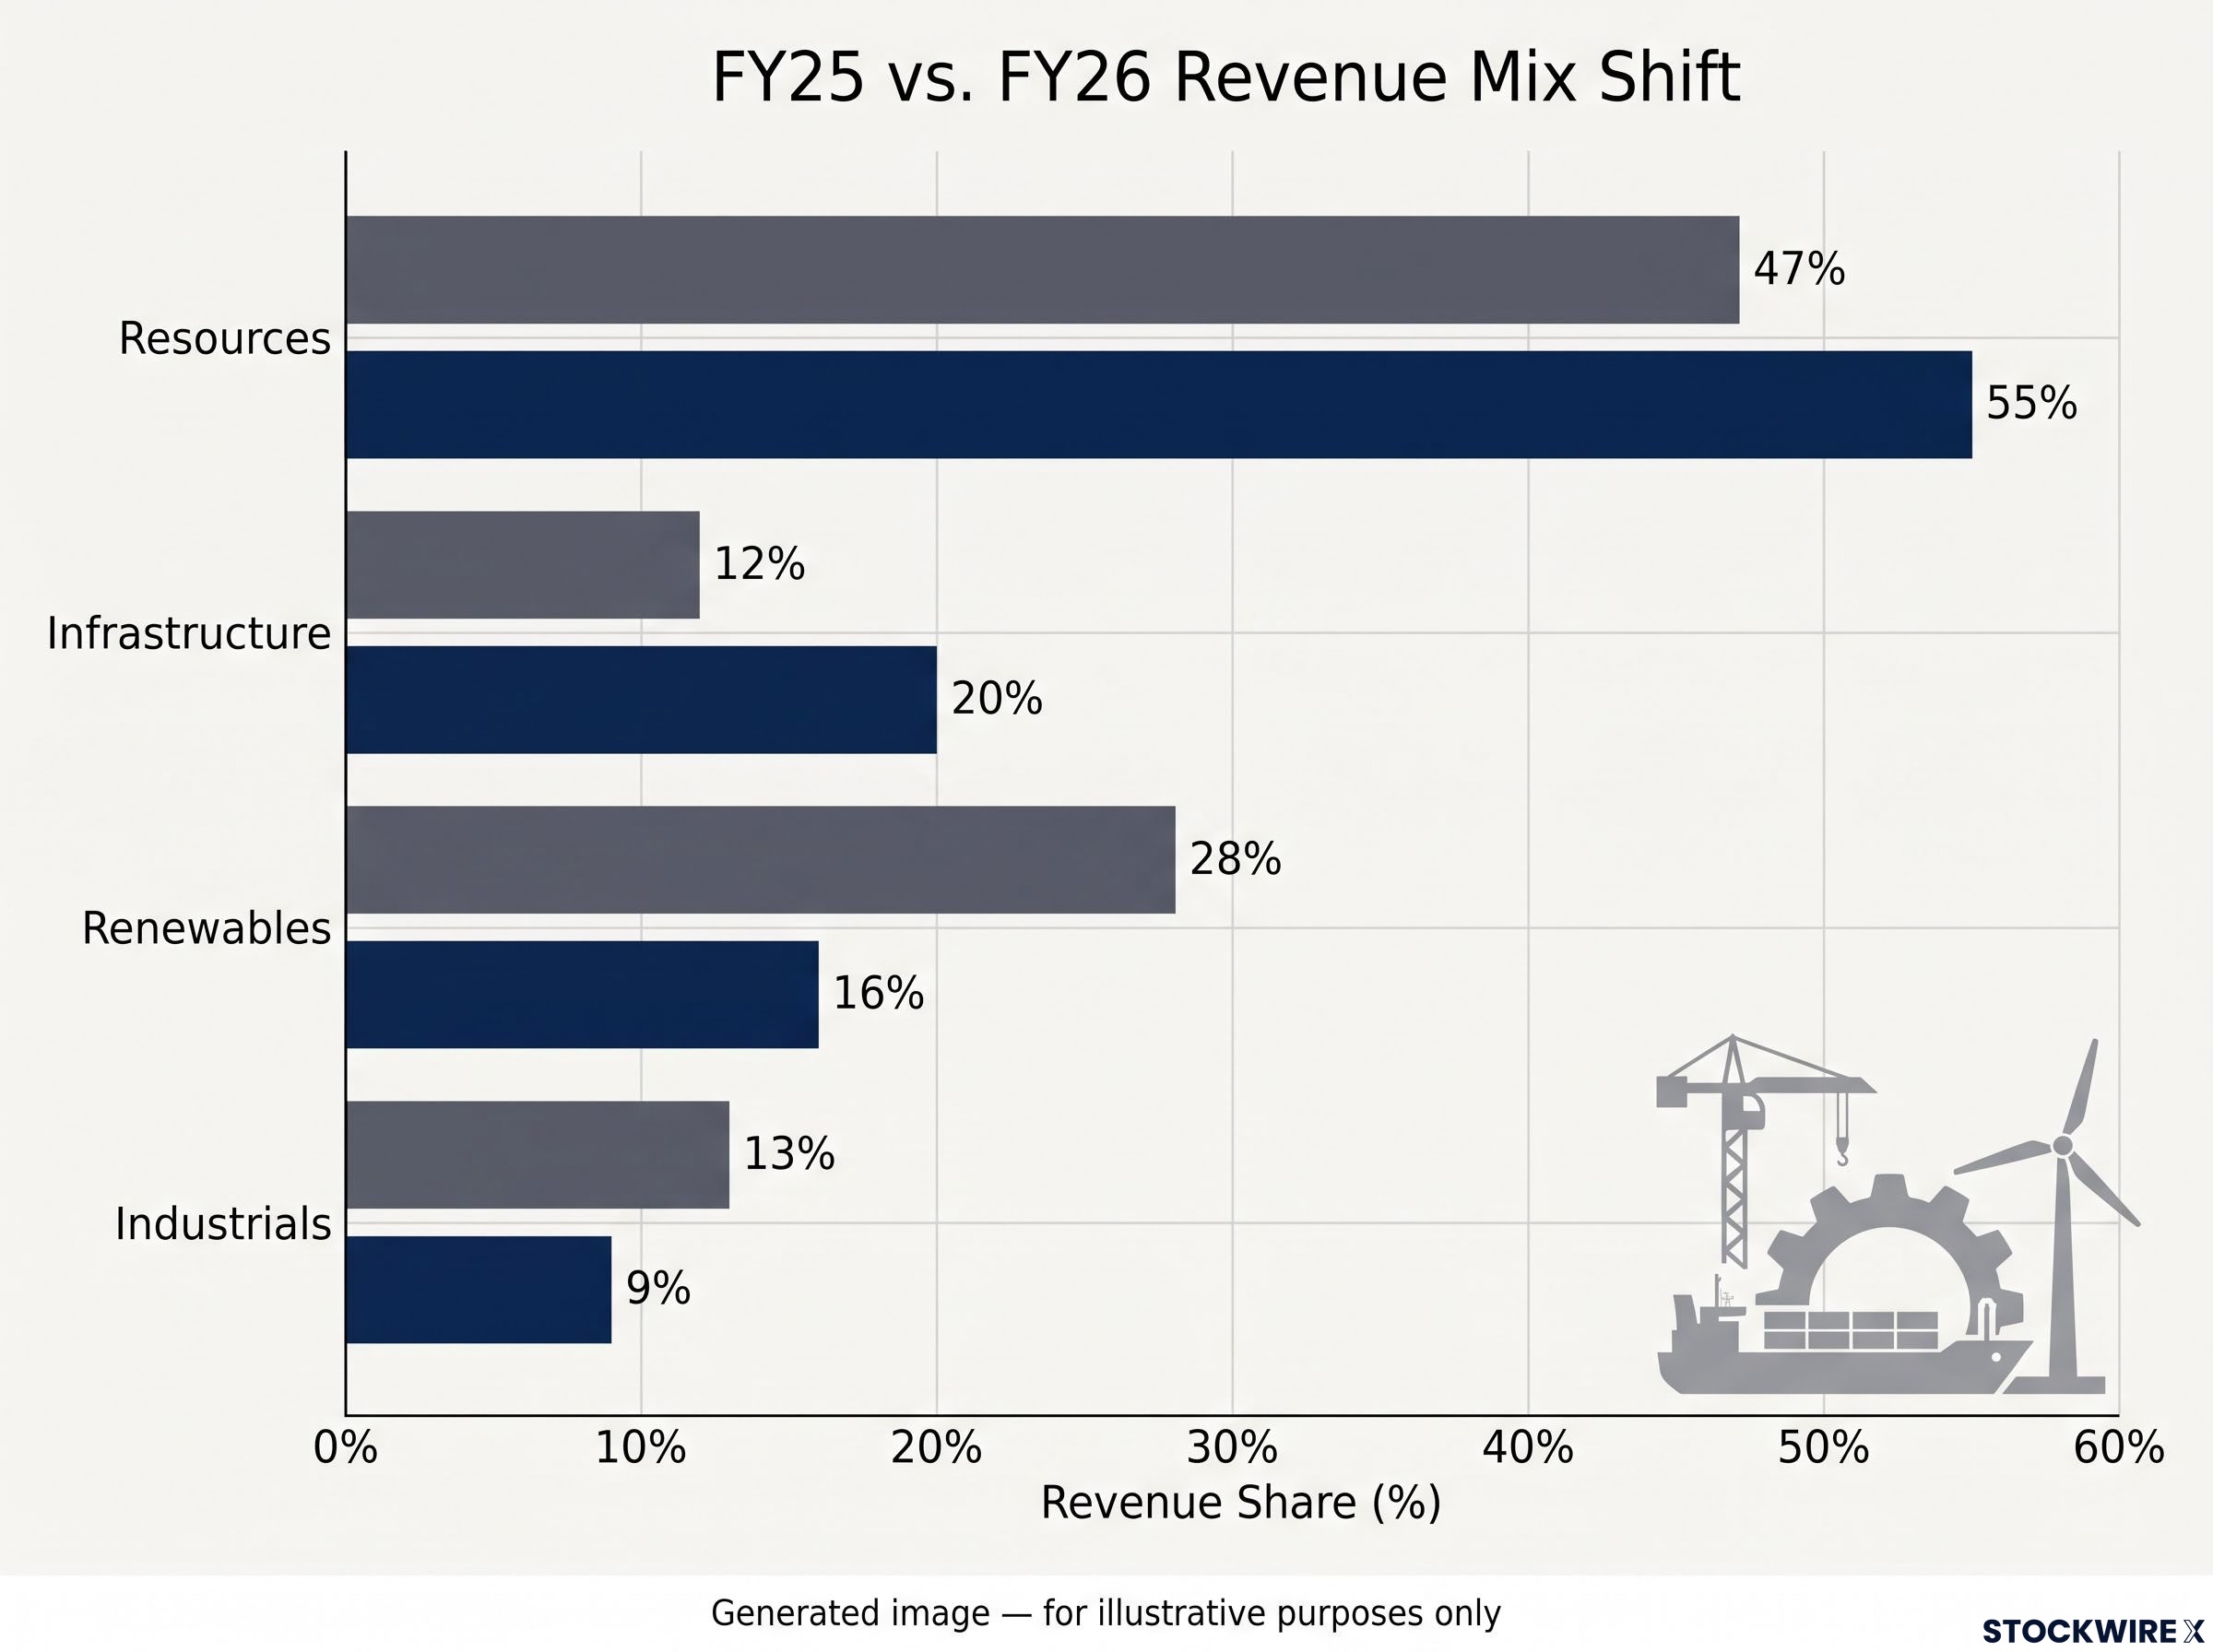
The presentation showed the revenue mix rebalancing toward Resources and Infrastructure, with reduced weighting to Renewables. Resources remained the core anchor of the business, with FY26 growth supported by existing operational and maintenance contracts, including BHP Olympic Dam.
The BHP Olympic Dam contract extension, secured in June 2026 at $40 million per annum for an initial five-year term with a further two-year option, anchors Resources revenue and underpins the utilisation rates that drove margin improvement across the year.
Infrastructure was identified as a growth sector spanning transmission and civil work, with performance underpinned by existing contracted projects such as Hume Link West. Renewables saw more selective participation, with FY26 activity impacted by lower wind farm project approvals and near-term construction delays, a position management framed as disciplined engagement where margin, risk and delivery are clear.
Industrials reflected targeted expansion focused on converting project work into long-term recurring relationships across ports, utilities and power generation.
| Sector | FY26 % | FY25 % |
|---|---|---|
| Resources | 55% | 47% |
| Infrastructure | 20% | 12% |
| Renewables | 16% | 28% |
| Industrials | 9% | 13% |
Understanding Return on Net Assets (RoNA)
Return on Net Assets (RoNA) measures how efficiently a company generates profit from the net assets it deploys. For an asset-heavy business such as a crane fleet operator, this metric is a central indicator of value creation.
Because Boom is capital-intensive, operating approximately 295 machines, returns generated on that asset base matter more than revenue growth alone. The presentation showed RoNA improving from 6% in FY24 to 8% in FY25 and 9% in FY26, with a stated progressive and aspirational target of 15%, rather than a firm guidance figure.
Management identified several levers behind the trajectory, including improving asset utilisation, strengthening margin discipline, redeploying assets to higher-return markets and rationalising underperforming assets.
Boom had already upgraded FY26 earnings guidance in May 2026, lifting underlying EPS expectations to 32 cents per share on the back of Q3 asset utilisation and labour efficiency both reaching 88%, up from 83% and 85% respectively in the prior corresponding quarter.
Balance sheet strength and capital returns
The presentation positioned a stronger balance sheet as enabling both growth investment and shareholder returns. Cash at bank rose 72.7% to $24.7m, while net debt was reduced to $85.1m from $93.2m.
Gearing of 39.5% sat within the company’s stated target range of 35-45%. Fleet metrics remained within targets, with an average machine age of 5.9 years against a 5-7 year range, supported by net capital expenditure of $16.7m.
Returning capital to shareholders
Capital returns during the period included the following:
-
An on-market share buyback, with 4.3 million shares ($7.0m) purchased in FY26.
-
An unfranked dividend of 2.0 cents per share ($0.8m), paid on 30 September 2025.
-
A shareholder returns policy targeting 40-60% of the prior year’s operating NPAT.
FY26 results presentation positioning
“A disciplined strategy that drives quality earnings and sustainable returns.”
FY27 outlook: contracted work underpins the year ahead
Management presented an outlook anchored by contracted work and disciplined execution. Key points from the FY27 outlook included:
-
A solid foundation entering FY27, supported by long-term contracted work including BHP Olympic Dam and other contract renewals.
-
Continued strength expected across Resources and Infrastructure.
-
A growing opportunity pipeline across Transmission and selective Renewables.
-
Continued focus on margin, asset utilisation and labour efficiency.
-
An FY27 share buyback targeting up to $7.0m, subject to board approval, while budgeting for continued EPS growth.
The presentation also noted that, in the medium term, tax expenses may be incurred subject to future taxable income and applicable tax laws. FY26 benefited from a nil income tax expense, so future periods may differ, a point disclosed as prudent guidance rather than a change in trading conditions.
Why the investment case stands out
The presentation condensed the company’s positioning into five pillars:
-
Improving earnings quality via long-term contracted work.
-
Disciplined capital allocation, prioritising returns over volume.
-
National scale across 17 depots and approximately 295 assets, with engineering and workforce solutions.
-
Exposure to long-term Resources demand alongside Infrastructure growth.
-
Sustainable shareholder returns through EPS growth, dividends and buybacks.
Don’t Miss the Next Industrials Breakout on the ASX
Big News Blast delivers FREE breaking ASX news straight to your inbox within minutes of release, complete with in-depth analysis already done for you. Join 20,000+ subscribers staying ahead of the market on industrials, resources and beyond. Click the “Free Alerts” button to start receiving real-time coverage the moment announcements drop.