
Pro Medicus reported A$144.7 million in net profit for FY26, beating consensus by roughly 4.1%. That is the number most investors saw. The one they should be watching is different: strip out a stronger Australian dollar, and the underlying NPAT growth was 32.5%, not 22.9%. The gap between those two figures is not rounding. It is a structural FX drag that masks how fast the business is actually compounding.
That distinction matters more than usual right now. Two competing narratives have been running on Pro Medicus for over a year: a long-run AI disruption bear case that questions whether the company’s imaging moat survives a wave of AI-native competitors, and a compounding-quality bull case that treats PME as one of the ASX’s most structurally advantaged growth businesses. This result either confirms, complicates, or challenges one or both.
Here is a structured breakdown of the four things the FY26 numbers actually settle and one thing they do not, giving you what you need to form your own informed assessment of where PME sits from here.
What the headline numbers actually show, beyond the beat
Pro Medicus delivered a clean beat across every major line item. Revenue came in at A$261.7 million, up 22.9% on the prior year and roughly 2.6% ahead of where Macquarie had it pre-result. Underlying EBIT hit A$196.1 million, up 24.4%, with an EBIT margin of 74.9% against a consensus forecast of 73.7%. Underlying NPAT of A$144.7 million was 4.1% above expectations. Cash and financial assets reached A$252.3 million, up 19.7%, on a debt-free balance sheet. Total dividends rose 25.5% to A$0.69 per share, fully franked.
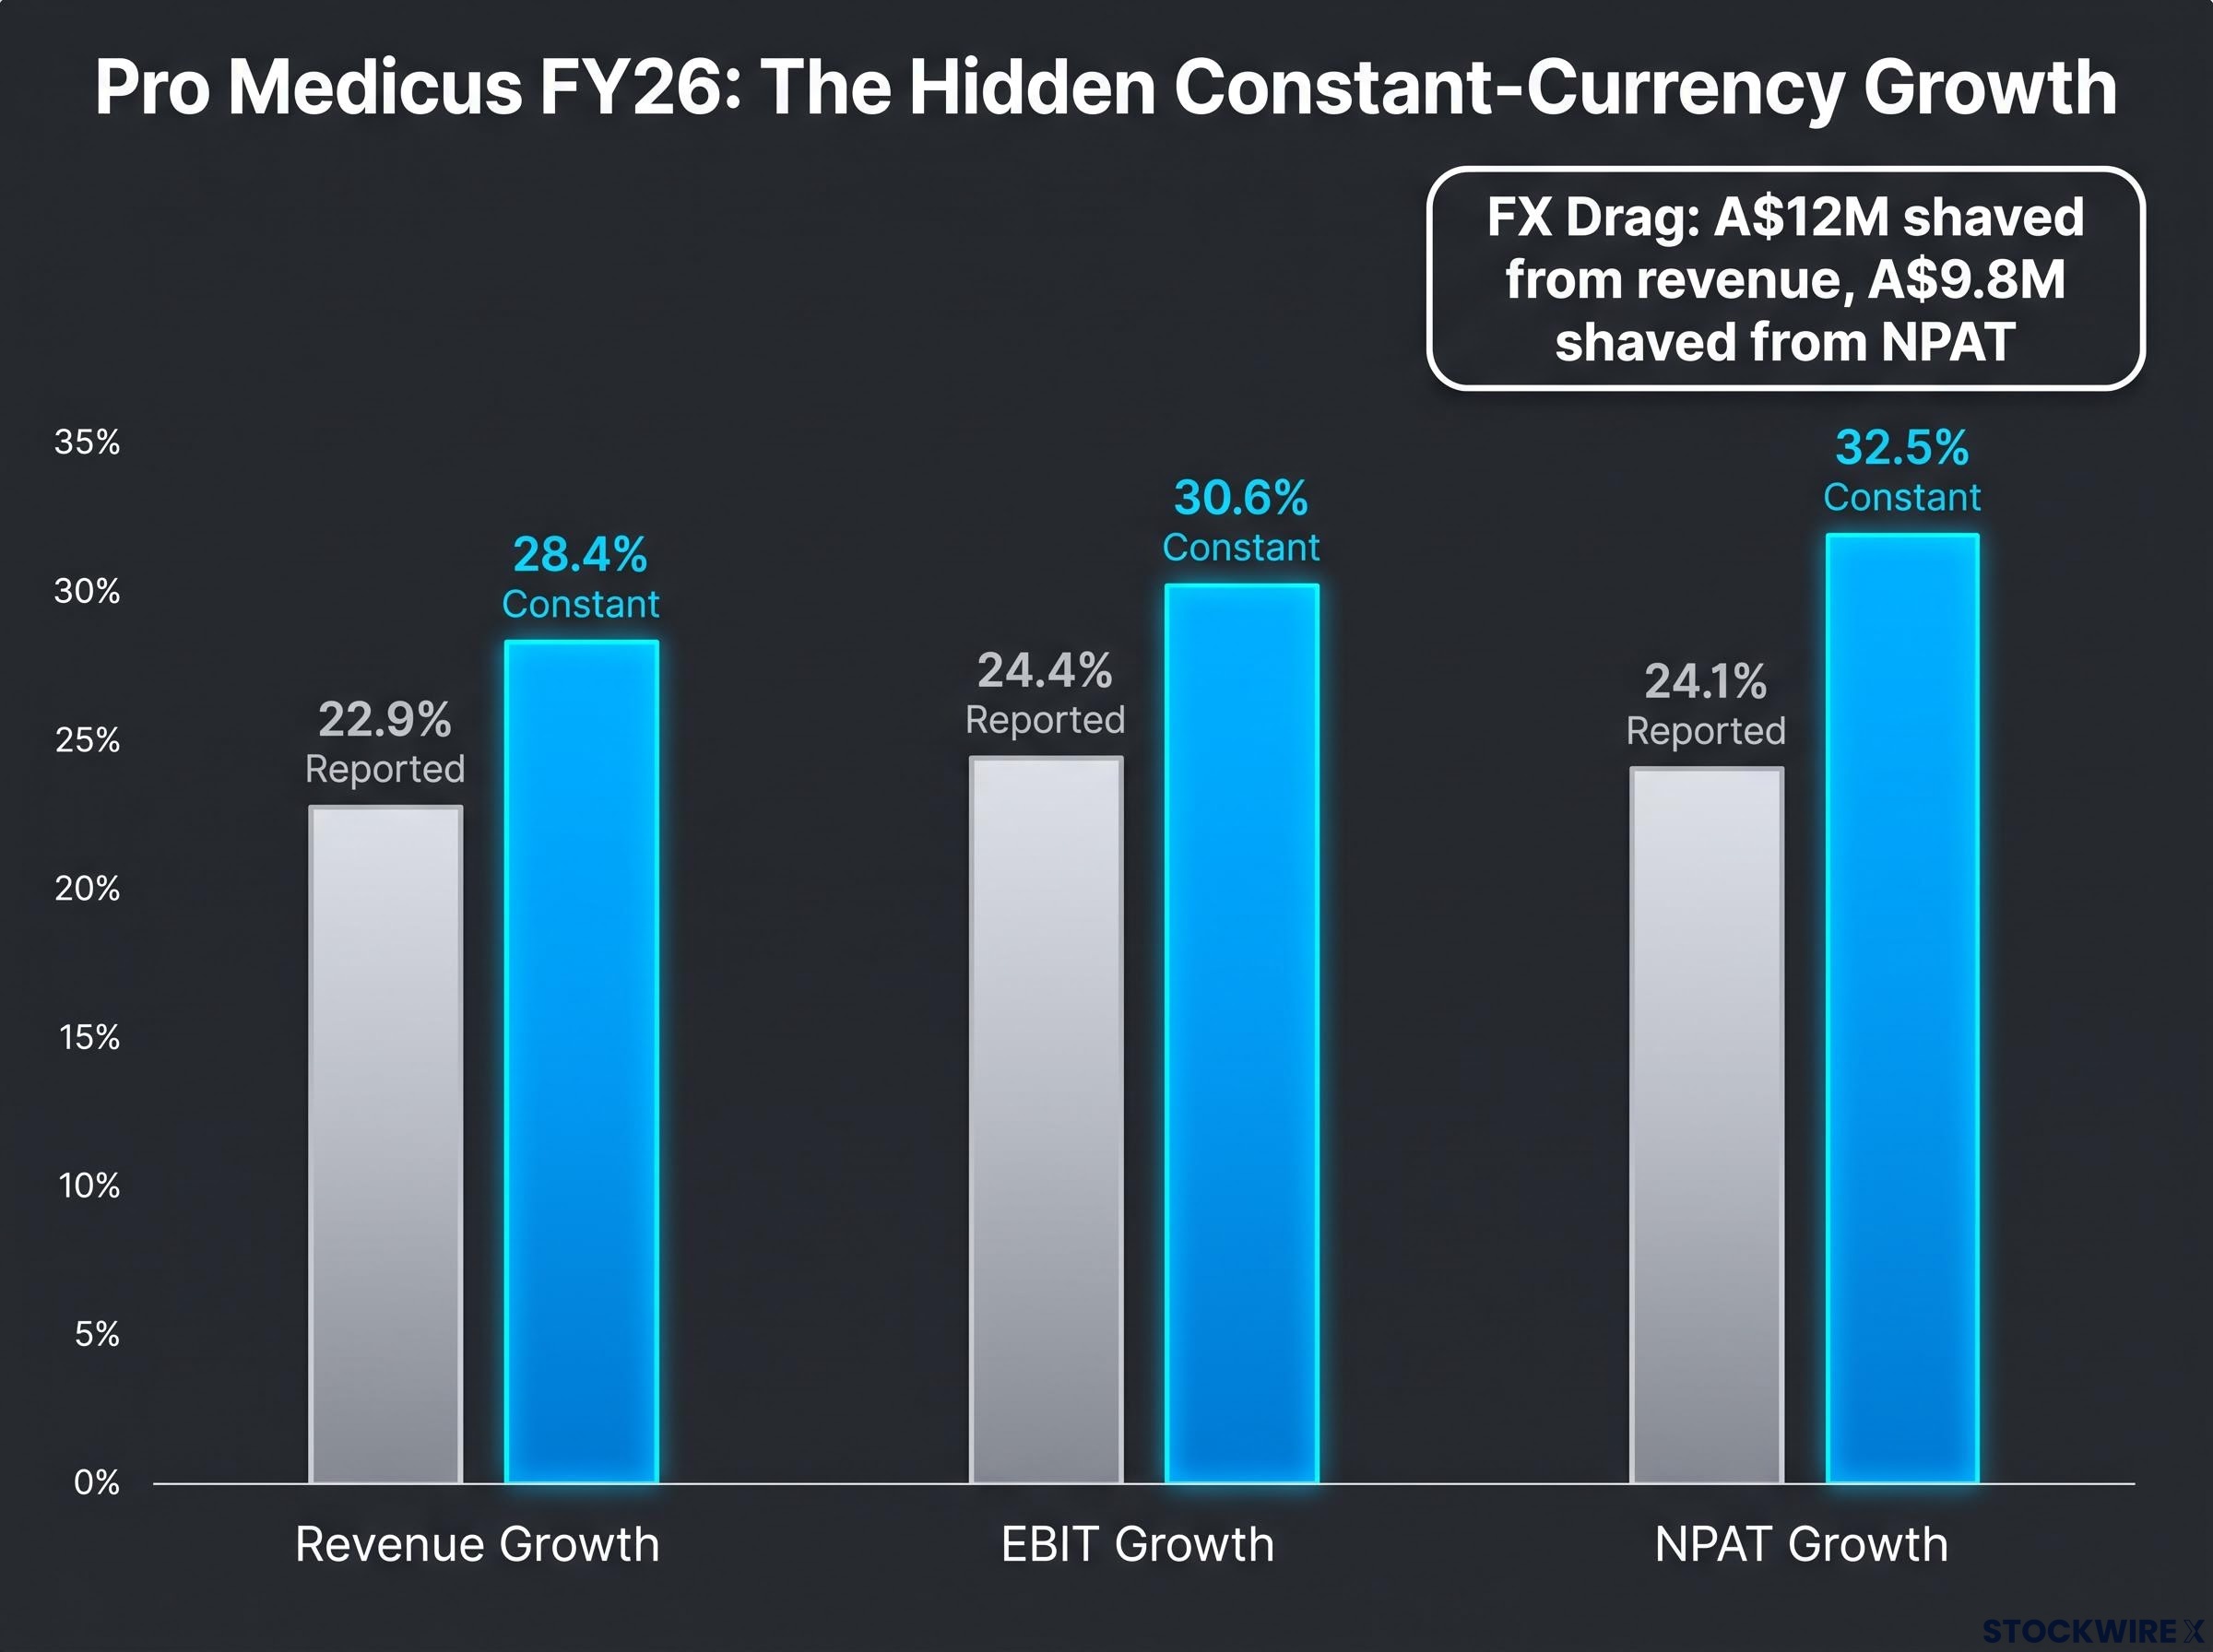
Those reported figures, though, carry an FX penalty. Currency appreciation reduced reported revenue by around A$12 million and shaved approximately A$9.8 million from reported NPAT. Adjusting for that tailwind, the constant-currency picture is considerably stronger: revenue advanced 28.4%, EBIT rose 30.6%, and NPAT expanded 32.5%.
| Metric | FY26 Reported | YoY Change (Reported) | Constant-Currency Change | vs Consensus |
|---|---|---|---|---|
| Revenue | A$261.7M | +22.9% | +28.4% | ~2.6% ahead |
| EBIT | A$196.1M | +24.4% | +30.6% | Margin 74.9% vs 73.7% |
| EBIT Margin | 74.9% | +~90 bps | N/A | +120 bps vs consensus |
| NPAT | A$144.7M | +24.1% | +32.5% | ~4.1% ahead |
| Cash & Financial Assets | A$252.3M | +19.7% | N/A | N/A |
EBIT margin: 74.9%, up from 74.0% the prior year and 120 basis points above consensus. Margin expansion at this absolute level is rare in any software business globally.
The FX-adjusted figures tell you something the reported numbers understate: the operating momentum beneath the headline is materially stronger than the statutory result conveys. Anyone relying solely on the reported growth rates is reading a softer version of the story than the business is actually delivering.
When big ASX news breaks, our subscribers know first
How the per-transaction model creates the margin profile investors are paying for
The margin expansion in the previous section is not a management achievement that requires replication through effort. It is an arithmetic consequence of how Pro Medicus generates revenue, and understanding that mechanic is the difference between admiring a number and reasoning forward from it.
Pro Medicus earns the substantial majority of its revenue on a per-transaction basis. Transaction revenue, in this context, means that revenue accrues each time a radiology scan is processed through the Visage platform, not as a fixed annual licence fee. The key characteristics of this model are what produce the margin profile:
- Revenue trigger: Each radiology scan processed through Visage generates a fee. No scan, no charge; more scans, more revenue.
- High incremental margins: The cost of serving one additional scan on existing infrastructure is minimal, so each new transaction flows largely to the bottom line.
- Low capital requirement: Growth does not require capital injection. The A$252.3 million cash balance on a debt-free balance sheet is a function of this capital efficiency.
- Implementation lag: Transaction revenue begins only when a site goes live, creating a timing gap between contract signing and revenue recognition. This is central to the FY27 story covered below.
Capital efficiency as a model output
CEO Dr Sam Hupert has characterised implementation speed as a competitive advantage. But the capital efficiency is the less-discussed structural feature. Pro Medicus does not need to raise equity, take on debt, or reinvest aggressively to sustain its growth rate. The cash balance compounds alongside the business.
The 74.9% EBIT margin is not an outlier to be questioned. It is what happens when a per-transaction model scales across a growing installed base. That margin profile is structurally defensible unless the model itself changes, which means your assessment of future margins starts with the model mechanic, not with peer benchmarks.
The renewal scorecard and what it settles about AI disruption
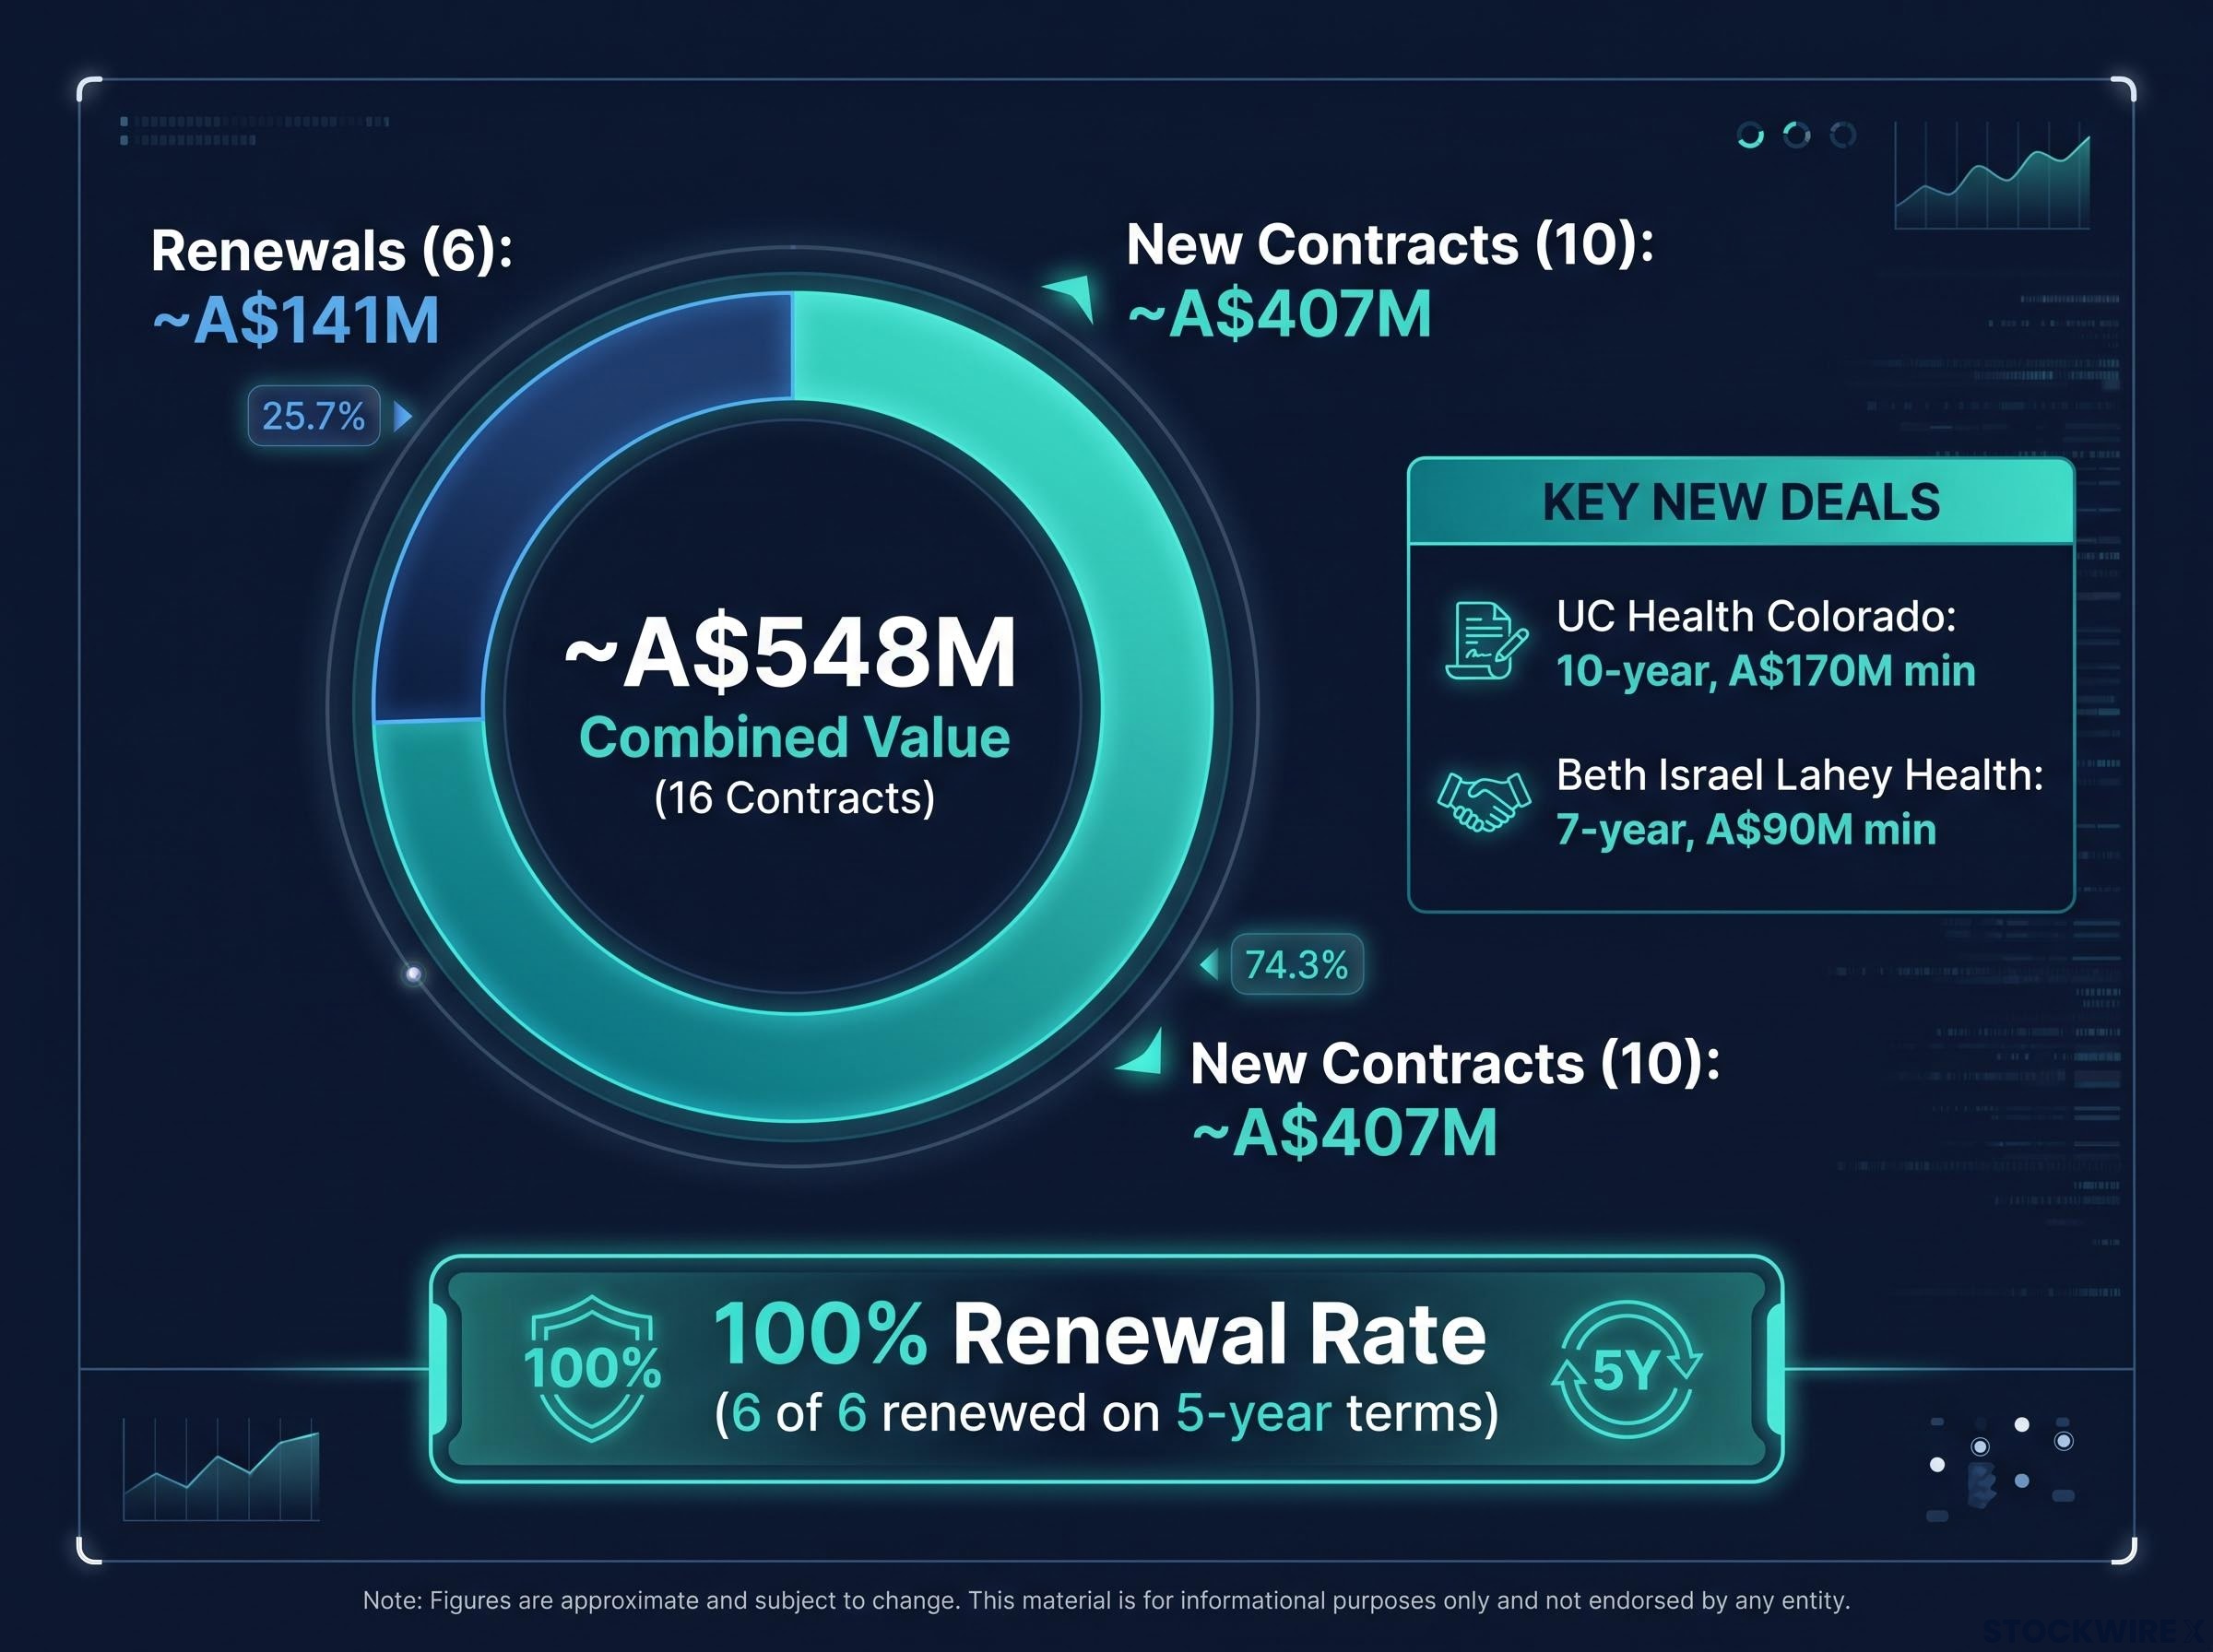
The renewal book delivered a complete sweep in FY26: all six contracts that reached expiry were extended, each on five-year terms, with the majority carrying increased minimum volume commitments and every one priced at higher per-transaction fees. The combined value of those renewals was approximately A$141 million.
100% renewal rate maintained across the full contract history. Six out of six renewed in FY26, on longer terms, at higher prices.
That statistic matters less as a number and more as revealed preference. These renewing customers, sophisticated US health systems with full market access, were free to evaluate AI-native or AI-engineered alternatives. They chose to recommit to Pro Medicus at increased pricing and extended durations. That is not a stated preference from a management presentation. It is a purchasing decision made with real budget authority.
The new contract pipeline reinforces the picture. During FY26, the company signed ten new agreements with a combined floor value of A$407 million, bringing the total of new and renewed business to roughly A$548 million for the year. Among the largest new commitments were a 10-year arrangement with UC Health Colorado carrying a minimum value of A$170 million, and a 7-year deal with Beth Israel Lahey Health worth a minimum A$90 million.
CEO Dr Sam Hupert indicated that renewal conversations remain “similar to the past,” a characterisation that suggests no change in competitive pressure at the negotiating table.
| Category | Number of Contracts | Combined Value |
|---|---|---|
| New contracts | 10 | ~A$407M |
| Renewals | 6 | ~A$141M |
| Combined | 16 | ~A$548M |
What this settles is specific and bounded. Near-term AI disruption is not occurring at scale. Sophisticated buyers with alternatives are choosing to stay, and paying more to do so. What it does not settle is whether AI-native alternatives will mature into genuine competitive threats over a longer horizon. For an investor holding the AI disruption bear case as an active risk, these renewal terms are the closest thing available to a real-world stress test of the competitive moat, and the FY26 outcome materially reduces the probability you should assign to near-term displacement.
Sixteen go-lives and the structural case for FY27 revenue growth
The per-transaction model creates a timing dynamic that is central to how you should think about FY27. The logic runs in four steps:
- A contract is signed. No revenue is recognised.
- The site goes live on the Visage platform. Transaction revenue begins.
- If the site goes live late in FY26 (say, May), it contributes only two months of revenue in FY26.
- In FY27, that same site contributes twelve months of revenue, with no associated acquisition cost.
Over the course of FY26, Pro Medicus brought sixteen sites onto the Visage platform, a cohort that included the initial four Trinity Health rollouts alongside deployments at University of Colorado and BayCare. A significant portion of those activations were concentrated in the closing months of the second half.
What the annualisation means in practice
Because most of those sixteen go-lives occurred in the final months of the fiscal year, their FY26 revenue contribution was partial. As those same sites generate a full year of scans in FY27, a near-mechanical step-up in transaction revenue follows. This does not require new contract wins. It requires only the passage of time.
CEO Dr Sam Hupert has pointed to a meaningful acceleration in transaction revenue during FY27 as those recently activated sites move from partial to full-year contribution. This is non-speculative; the sites are live, the contracts are signed, and the scans are already being processed.
There is also an FX dimension. If the Australian dollar weakens modestly against the US dollar, the reported revenue uplift in FY27 could be amplified beyond the constant-currency gain, reversing the headwind that compressed FY26 reported figures.
The analytical question for FY27, then, is not “will Pro Medicus grow?” The annualisation effect answers that. The question is how much of that step-up the market has already priced in, and whether the share price already reflects a full year of transaction revenue from sites that only recently went live.
What FY26 does not resolve: the valuation question PME investors cannot avoid
The temptation after a result this clean is to treat it as a verdict. It is not. FY26 is thesis-confirming rather than thesis-changing. Every metric pointed in the same direction: revenue, EBIT margin, NPAT, cash, contract wins, renewal rate, implementation pipeline. That alignment is rare and it matters. But a result that confirms an existing thesis does not independently justify or challenge a premium valuation.
Pro Medicus trades at a material premium to peers and the broader ASX market. The constant-currency NPAT growth of 32.5% is the growth rate the market is implicitly pricing against that premium multiple. Whether the multiple is justified depends on duration, the question of how many years this growth rate can persist, and that question was not answered today.
What FY26 settles:
- Near-term competitive displacement is not occurring; renewal data confirms this
- The underlying growth rate is accelerating on a constant-currency basis
- FY27 transaction revenue has a structural tailwind from late-FY26 go-lives
What FY26 does not settle:
- Whether the current valuation already reflects the strength of the result
- Whether AI-native alternatives will mature into genuine competitive threats over a three-to-five-year horizon
- The duration of growth at this rate
AI disruption remains a live long-run risk. FY26 shows it has not yet manifested in customer behaviour. That is a data point in an ongoing assessment, not a permanent resolution. For a PME holder evaluating whether this result changes position sizing or conviction, the honest answer is that FY26 strengthens the case for holding but does not resolve the price-at-which-to-hold question. Conflating the two is one of the most common analytical errors in high-multiple growth stocks.
Three variables that will determine whether the FY27 story holds
Rather than a verdict, here are the three observable variables that will either confirm or complicate the FY26 thesis in real time, well before the next annual report:
- Trinity Health cohort completions. The first four cohorts went live in FY26. The remaining cohorts represent the largest single implementation pipeline item. Their timing will determine when the full contracted revenue base from this relationship annualises. Delays push the revenue step-up further out; acceleration pulls it forward. Watch management commentary on cohort scheduling at interim updates.
- Australian dollar movement against the US dollar. The A$12 million reported revenue drag in FY26 means even a modest AUD depreciation would amplify reported FY27 numbers materially. Conversely, further AUD strength would again compress the statutory figures below the constant-currency reality. Track the AUD/USD rate as a direct input to how the reported result will read.
- Renewal cadence and terms in FY27-FY28. The 100% renewal rate is the single most important moat metric. Any change in tone, terms, or outcome in the next renewal cycle would be the earliest observable signal of competitive change. This is the variable that bears should be watching most closely and that bulls should not dismiss.
Each of these three variables is observable before the FY27 result, which means you are better positioned tracking them in real time than waiting for the next annual report to update your view. The FY26 result gave you a thesis-confirming data set. These three variables are where the thesis gets tested next.
This article is for informational purposes only and should not be considered financial advice. Investors should conduct their own research and consult with financial professionals before making investment decisions. Past performance does not guarantee future results. Financial projections are subject to market conditions and various risk factors.