
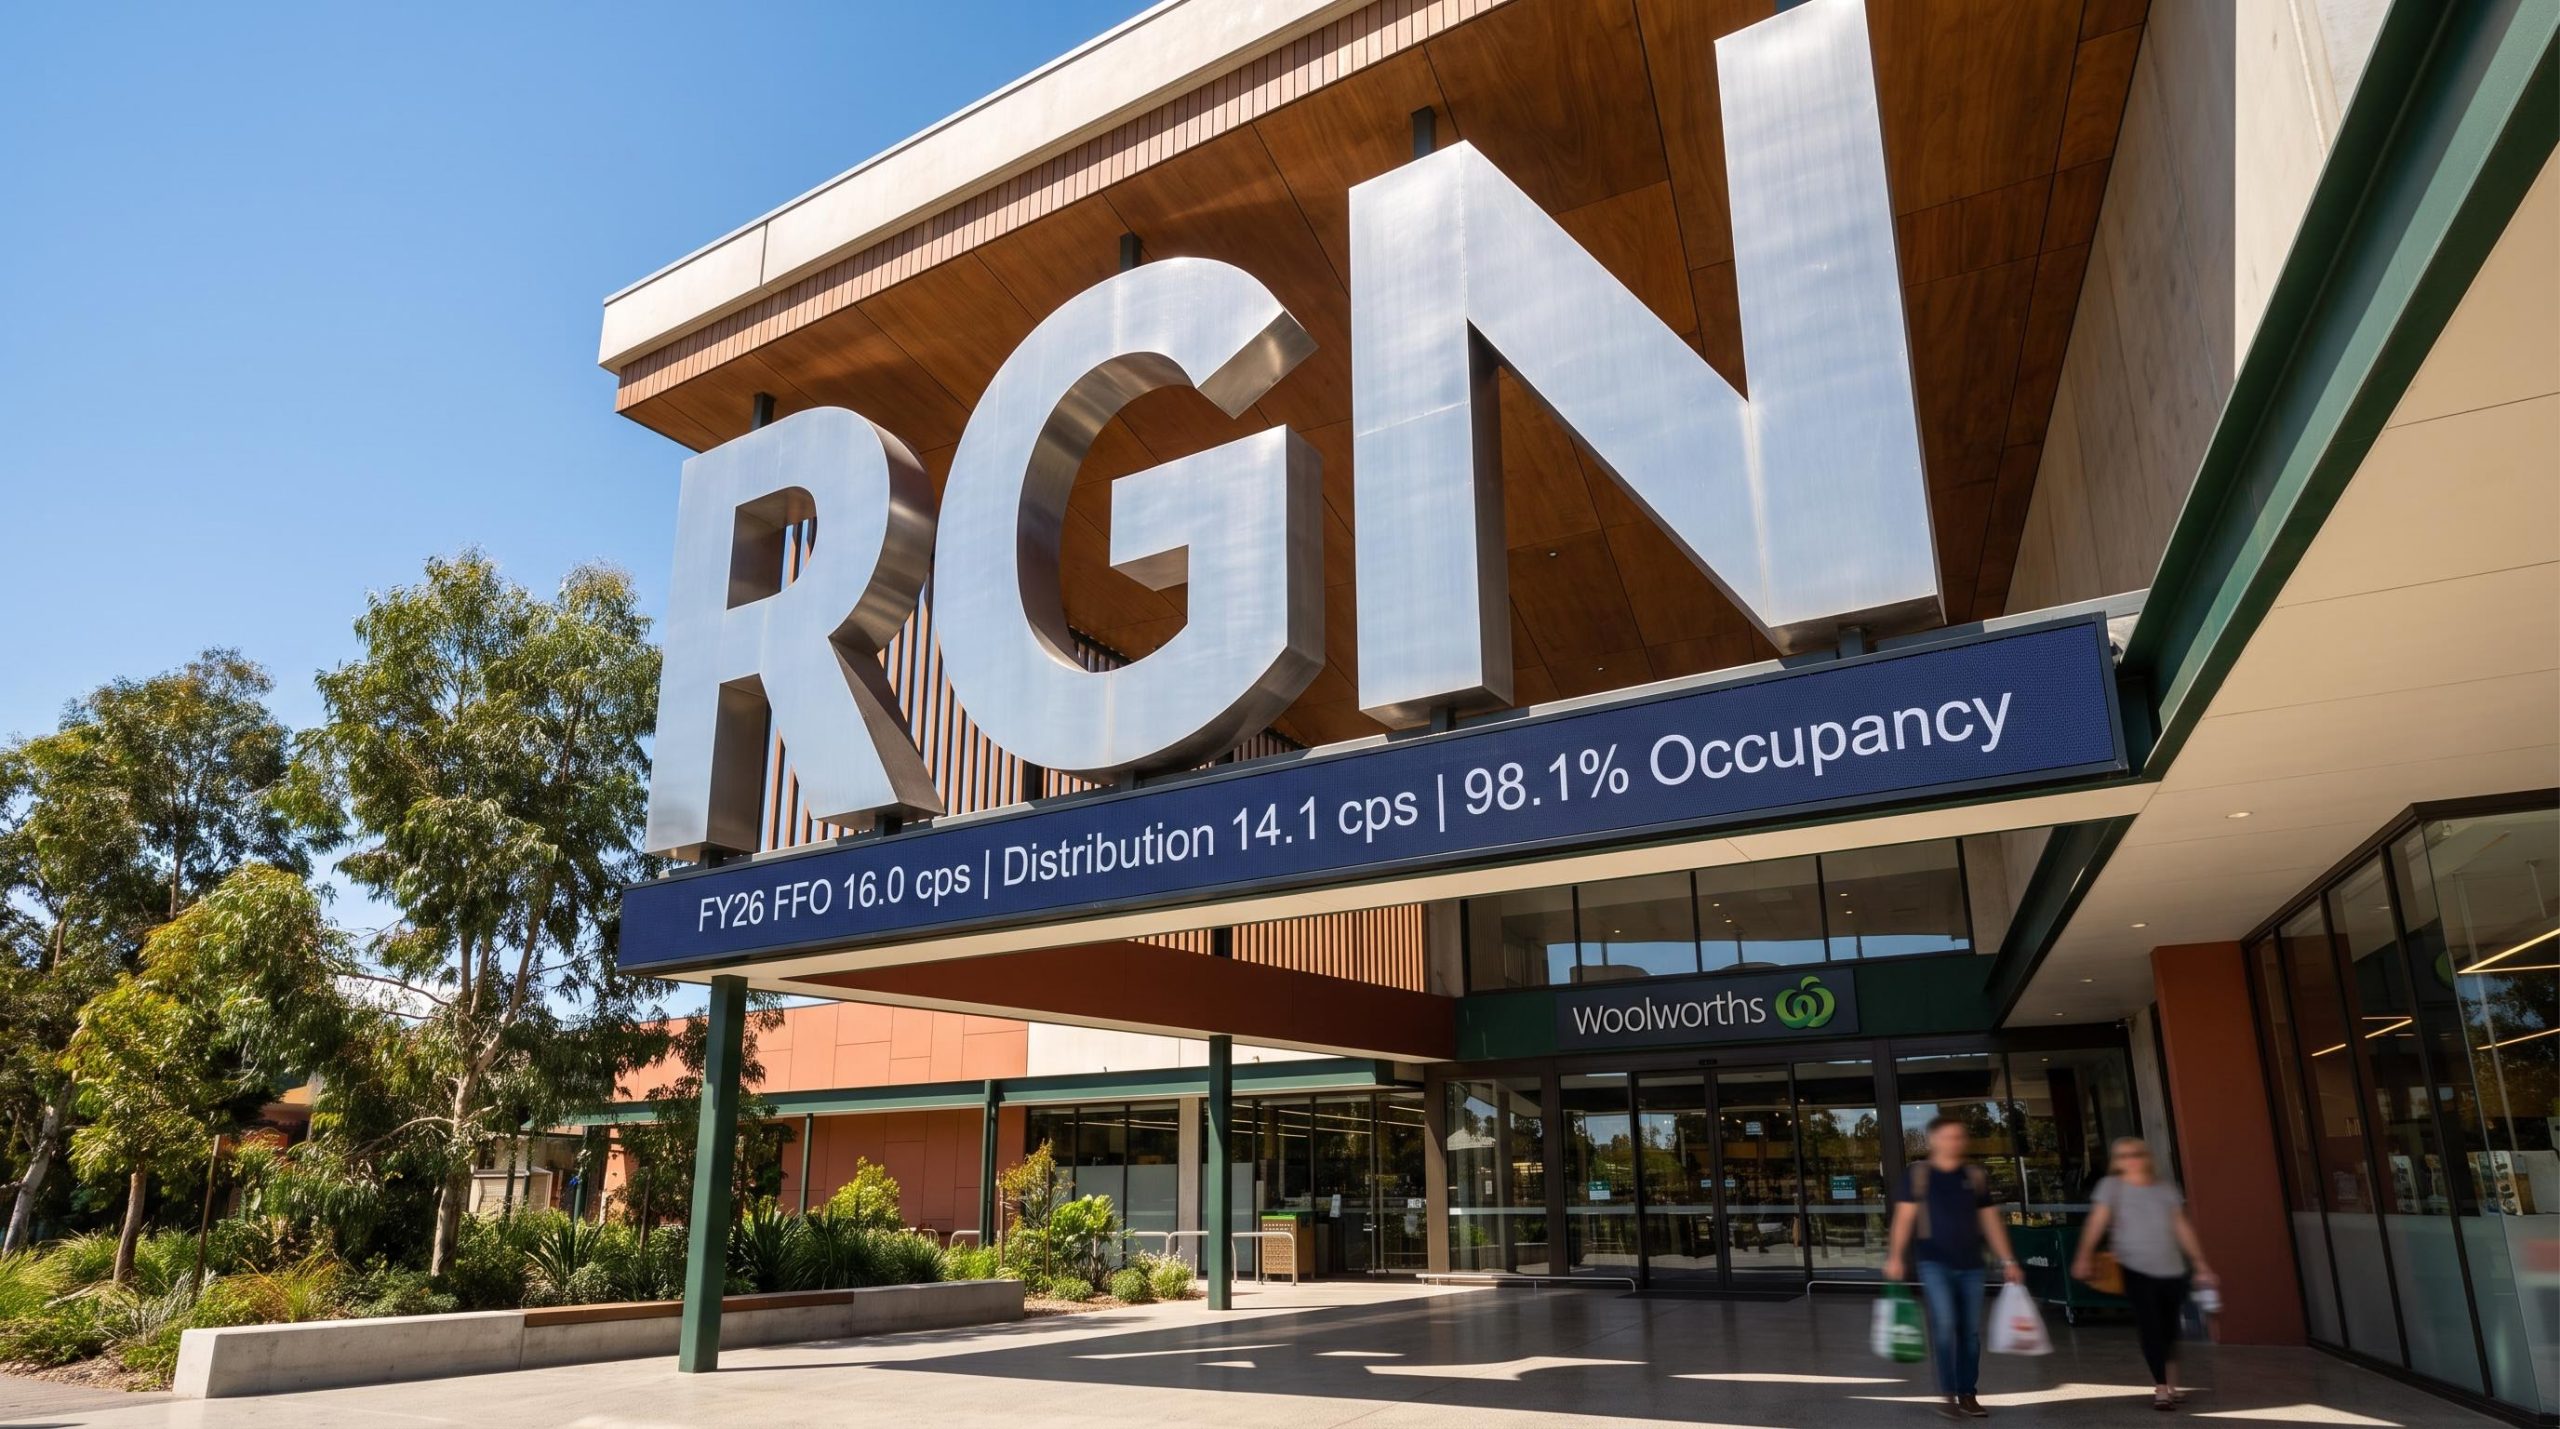
Region Group delivers 9.8% total return and lifts FY26 earnings on supermarket strength
In its FY26 results presentation delivered on 17 August 2026, Region Group (ASX: RGN) outlined a 9.8% total security holder return for the year ended 30 June 2026, alongside a 3.2% lift in funds from operations (FFO) per security. The result underscored the defensive nature of the group’s supermarket-anchored income base.
Management detailed statutory net profit after tax of $268.8m, up from $212.5m in FY25. FFO per security reached 16.0 cents (from 15.5 cps), adjusted funds from operations (AFFO) rose to 14.1 cps (from 13.7 cps), and net tangible assets (NTA) per security climbed to $2.57 (from $2.47).
Described as “Australia’s leading internally managed essential retail REIT,” Region Group operates a platform generating over $5 billion in supermarket sales per annum, with more than 2,200 specialty tenant partners across 100 Australian communities (figures representing all Assets Under Management). These defensive, supermarket-led cashflows underpin the group’s growing distributions.
When big ASX news breaks, our subscribers know first
What is an essential retail REIT and why supermarket-anchored income matters
Two headline earnings measures are used across the sector. FFO captures underlying, recurring earnings by adjusting statutory profit for non-cash items, while AFFO further deducts maintenance capital and leasing incentives to reflect cash available for distribution.
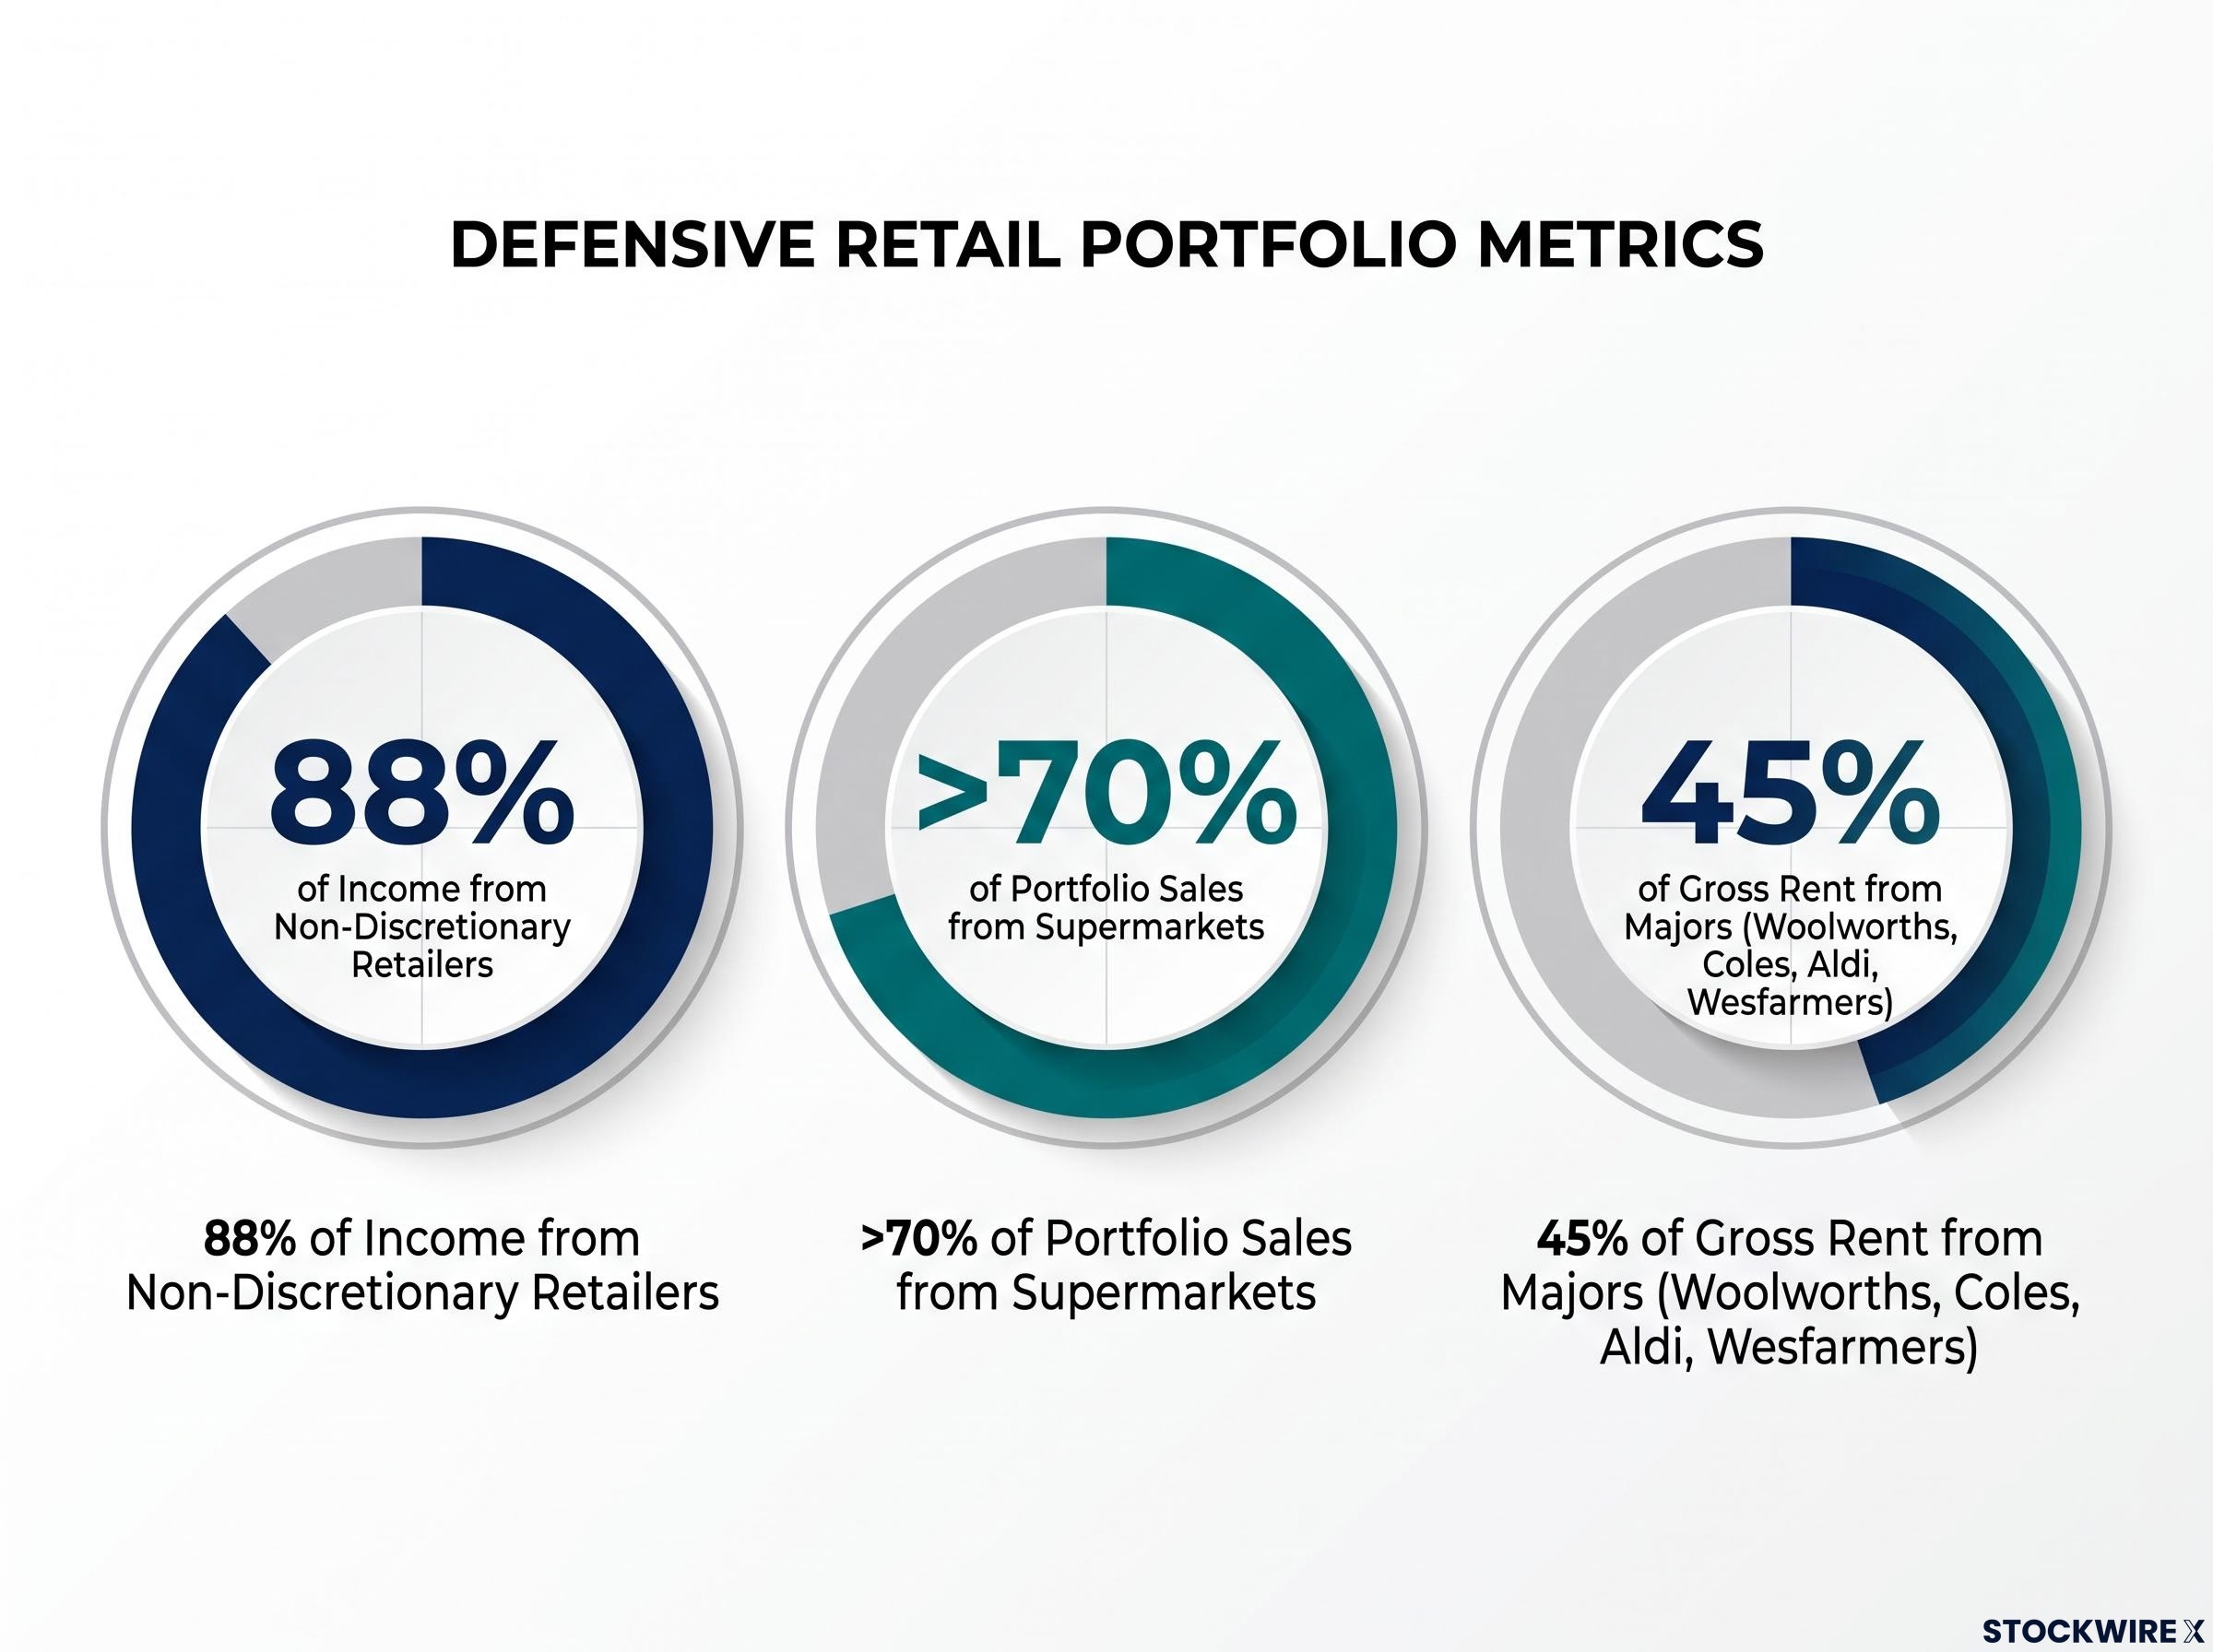
The defensive engine behind the result is clear in the tenant mix. Region Group reported 88% of income generated from non-discretionary retailers, with supermarkets contributing over 70% of portfolio sales.
FY26 operational performance — supermarkets drive the portfolio
Retail sales and occupancy
The portfolio delivered 4.1% comparable supermarket moving annual turnover (MAT) growth, up from 3.3% in FY25, while total portfolio comparable MAT growth reached 3.3%. Portfolio occupancy rose to 98.1% (from 97.5%), and total specialty sales productivity increased to $10,345 per sqm.
Region Group recorded 45% of total gross rent from major retailers including Woolworths, Coles, Aldi and Wesfarmers, providing income security. Notably, 58% of supermarkets generated turnover rent during the period.
| Category | FY25 MAT | FY26 MAT |
|---|---|---|
| Supermarkets | 3.3% | 4.1% |
| Discount Department Stores | 3.4% | 1.7% |
| Mini Majors | 1.8% | 0.8% |
| Total Specialties | 3.0% | 2.5% |
| Total | 3.1% | 3.3% |
Specialty leasing momentum
Specialty leasing showed continued strength across the year, with key metrics as follows:
-
4.0% average specialty leasing spreads (from 3.7%)
-
4.3% average annual rent increases
-
380 specialty deals completed (from 372)
-
Specialty vacancy down to 4.3% (from 5.4%)
-
Average specialty rent of $940 per sqm (from $919)
Falling vacancy combined with positive leasing spreads points to continued pricing power within the specialty portfolio.
Financial results and balance sheet strength
Earnings and distributions
Net operating income (NOI) rose 3.3% to $262.3m, with revenue growth exceeding expense growth. FFO reached $184.7m, translating to 16.0 FFO cps, a 3.2% increase on the prior year. AFFO came in at 14.1 cps, with 100% distributed to security holders, resulting in a distribution of 14.1 cents per security.
Statutory profit after tax of $268.8m was underpinned by an investment property fair value uplift.
| Metric ($m unless stated) | FY25 | FY26 | Change |
|---|---|---|---|
| Net operating income | 253.8 | 262.3 | +3.3% |
| FFO | 179.9 | 184.7 | |
| AFFO | 159.0 | 162.7 | |
| Statutory NPAT | 212.5 | 268.8 | |
| FFO cps | 15.5 | 16.0 | +3.2% |
| Distribution cps | 13.7 | 14.1 |
Balance sheet and capital management
Management highlighted a disciplined approach to capital across the year, with key measures including:
-
$5.5bn Assets Under Management, up 5.5%, driven by acquisitions and fair value uplift
-
$2.57 NTA per security, up 4.0%
-
34.1% pro forma gearing, below the midpoint of the 30-40% target range
-
100% of debt hedged or fixed at an average rate of 2.9% before margin
-
4.5% weighted average cost of debt (WACD), with >$1bn of debt refinanced at improved margins
-
$209.5m in cash and undrawn debt capacity
Region Group also purchased 12.7m securities for a total consideration of $29.2m at an average price of $2.29 as part of its on-market buy-back program, supporting per-security metrics.
Growth pipeline and portfolio optimisation
Management outlined a development pipeline targeting 7%+ incremental returns through disciplined capital deployment alongside its retailer partners. Key active projects detailed in the presentation include:
-
North Orange, NSW — a Woolworths store extension (open and trading, $6m) plus a standalone Aldi development (approximately $9m, DA approved, targeting Q4 FY27 completion).
-
Pakenham Marketplace, VIC — specialty-led centre enhancements ($10m, fully leased).
-
Kwinana Marketplace, WA — a dining precinct conversion (approximately $9m, targeting Q4 FY27 completion).
-
Greenbank, QLD — three Quick Service Restaurant pad sites (approximately $12m, targeting Q1 FY28 completion).
On portfolio optimisation, the group divested two centres for a total of $32.8m at a 5.8% yield and acquired Treendale Home & Lifestyle Centre, WA for $53.0m at a 6.4% yield. Region Group also expanded funds under management with its Metro Fund institutional partner via acquisitions of $124.8m.
FY27 guidance and outlook
Management reiterated a longer-term target of 3-4%+ sustainable AFFO per security growth through disciplined execution and capital allocation. Assuming no significant change in market conditions, FY27 earnings guidance was set at:
-
3.0% growth to FFO of 16.5 cps
-
3.0% growth to AFFO of 14.5 cps
-
Target distribution payout ratio of approximately 100% of AFFO
Management pointed to a disciplined focus on essential retail, favourable market conditions and positive sector fundamentals, and execution of a clear strategy as the basis for its outlook on growing distributions and security holder returns.
The FY26 result reflected the combination underpinning the Region Group investment case for FY27: defensive supermarket-anchored income, disciplined capital management, and growing distributions delivered through a scaled essential retail platform.
Don’t Miss the Next ASX Real Estate Winner
Big News Blast delivers FREE breaking ASX announcements straight to your inbox within minutes of release, complete with in-depth analysis already done for you. Join 20,000+ investors who stay ahead of the market the moment news breaks. Click the “Free Alerts” button at Big News Blast to start receiving alerts today.