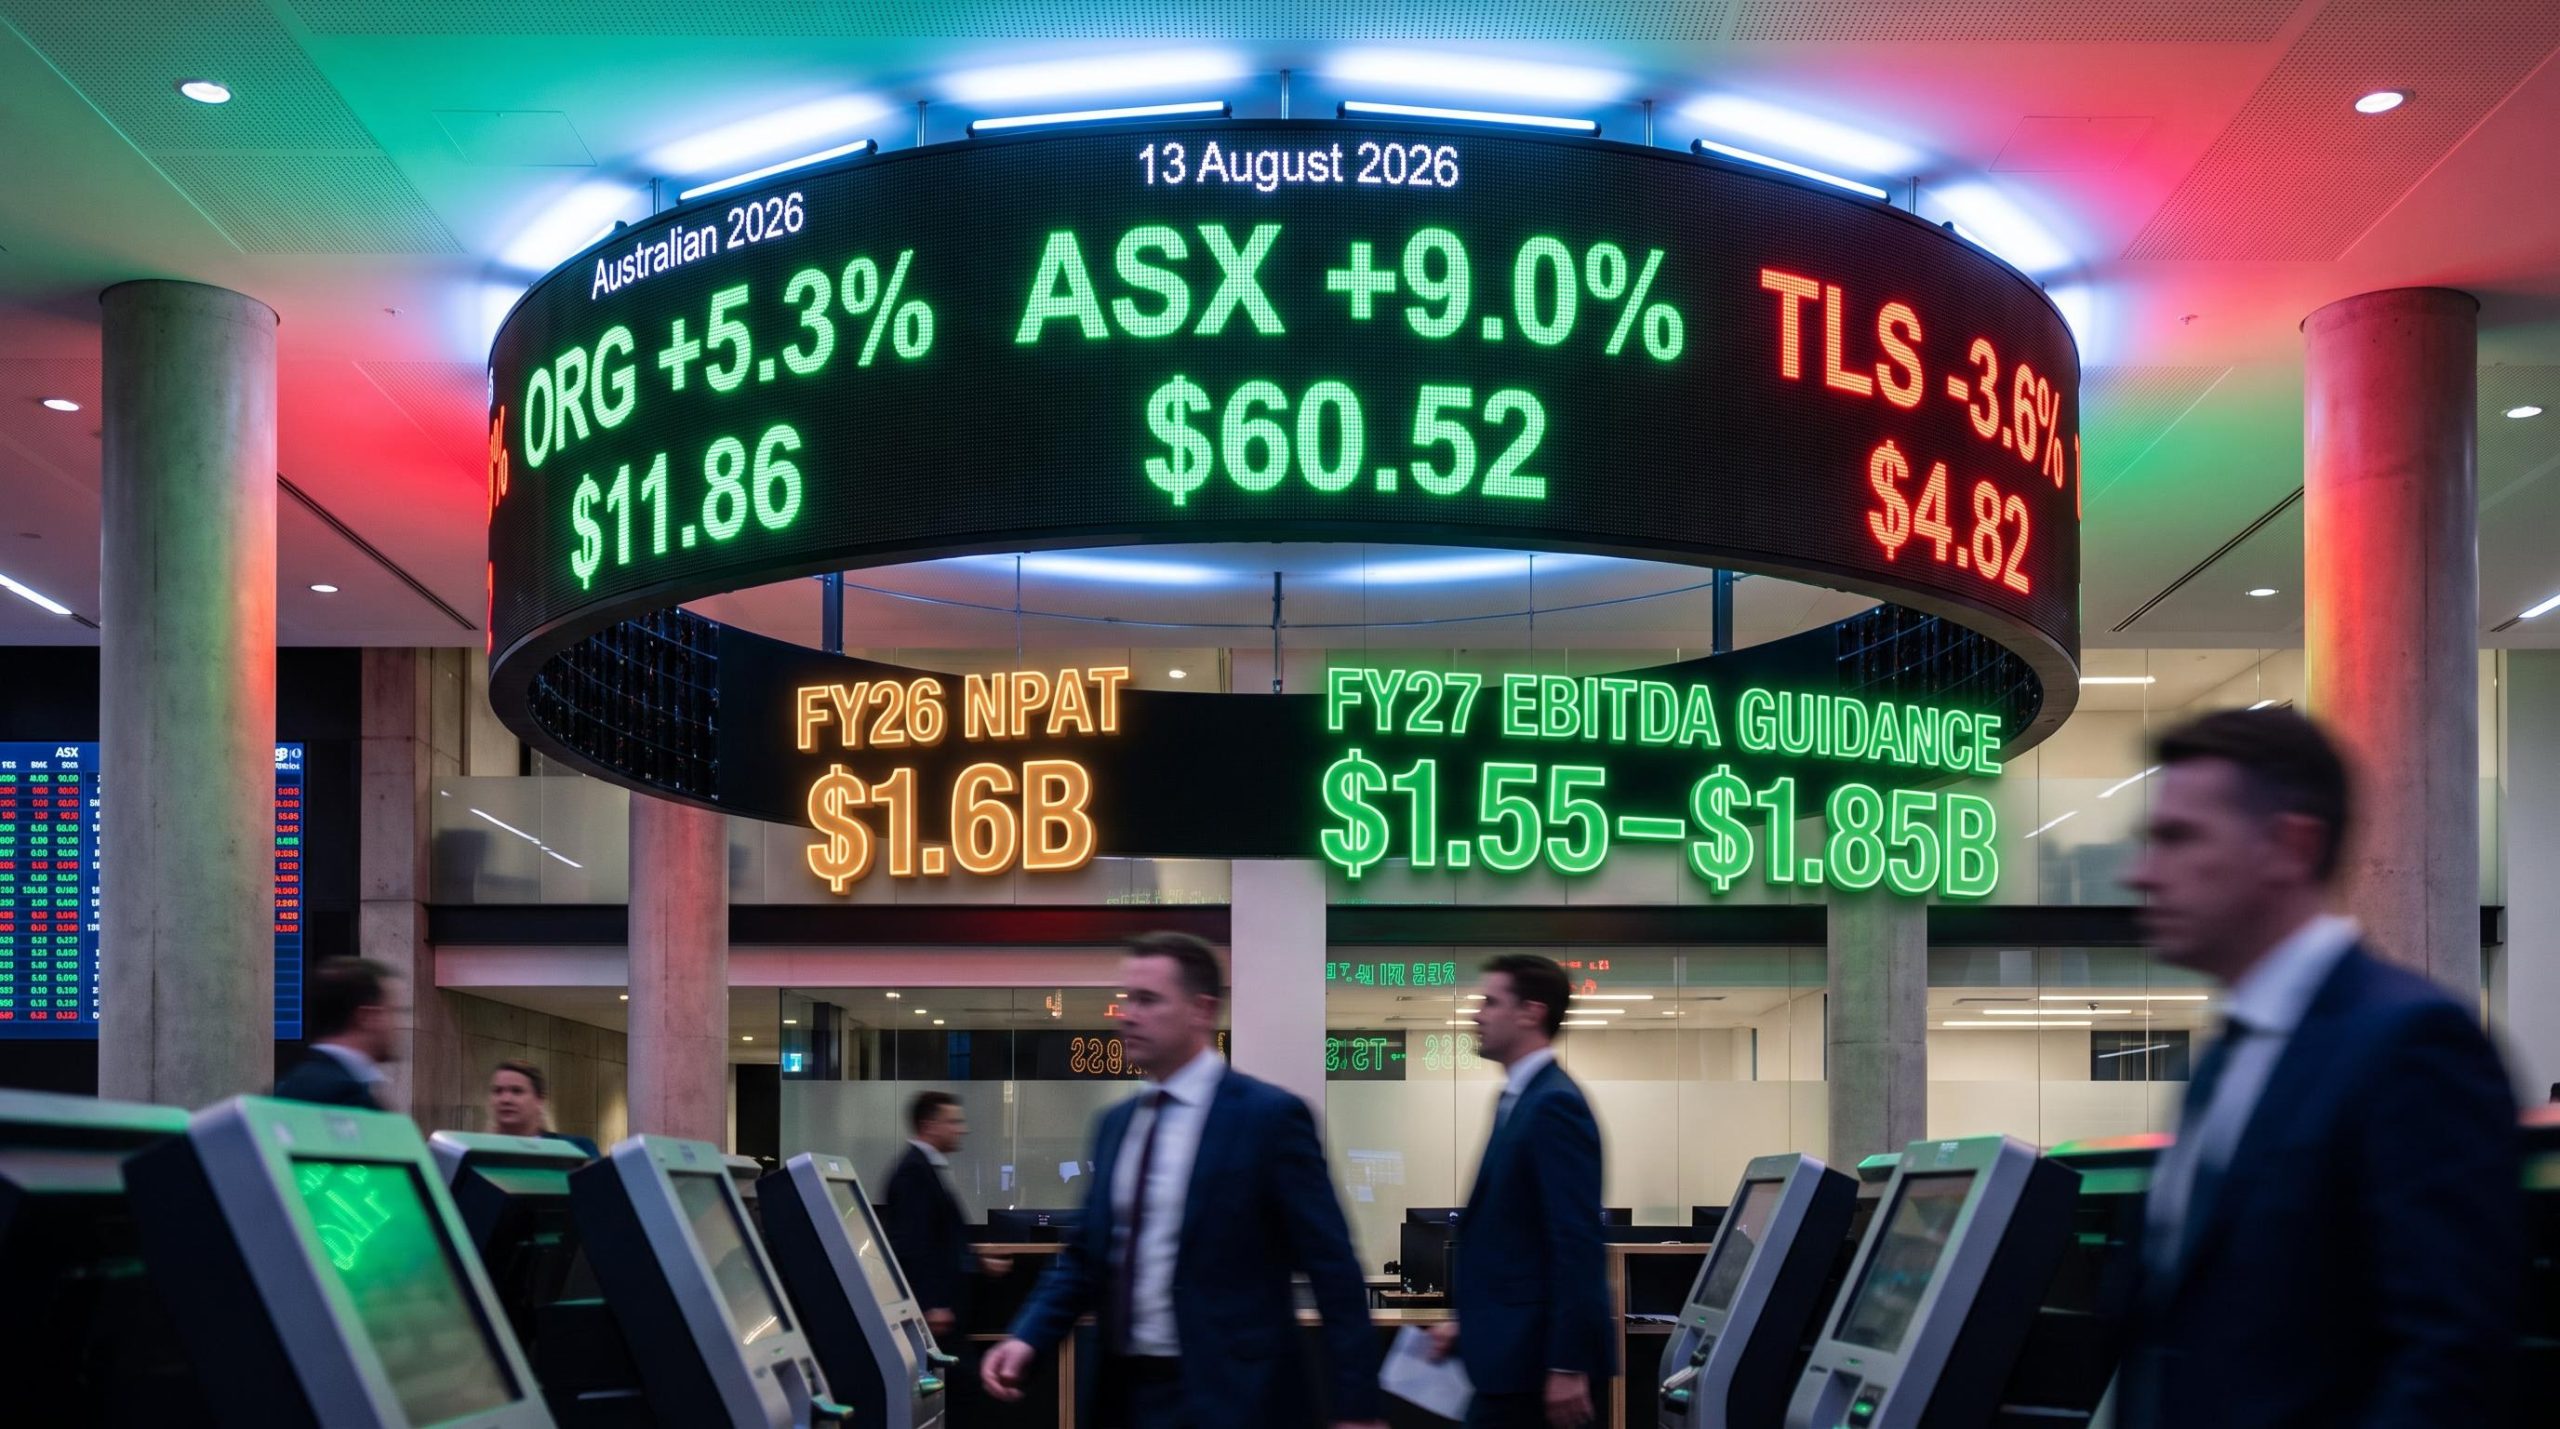
On 13 August 2026, ASX investors received a sharp reminder that earnings season rewards and punishes with equal force on the same day. Origin Energy surged 5.3%, ASX Limited jumped 9%, and Telstra fell nearly 4% on a result that actually beat consensus by 7.2%.
Mid-August is the most congested window of the ASX reporting calendar, with FY26 full-year results and quarterly trading updates landing simultaneously across sectors. The market’s reactions on this single day expose a principle playing out in real time: backward-looking profit figures are secondary to what a company signals about future costs, capital intensity, and pricing power.
Here is what the day’s results actually tell you. The breakdowns below cover the moves that mattered most, explain why market reactions diverged so sharply from headline profit numbers, and identify the cross-sector theme shaping how investors should read the rest of reporting season. The payoff is pattern recognition, not just a scorecard.
Why Origin Energy and ASX Limited led the day’s gains
Two very different businesses delivered the same market outcome: a strong rally on results day. The logic behind each move, though, was entirely distinct, and understanding that distinction matters for anyone tempted to chase either stock from here.
Origin Energy’s 5.3% gain to $11.86 was built on something tangible. FY26 underlying net profit after tax (NPAT, the company’s core operating profit excluding one-off items) came in at $1.6 billion, up 6% on the prior corresponding period, powered by elevated wholesale energy prices linked to the Iran conflict. The Energy Markets division was the engine. Management guided FY27 Energy Markets EBITDA (earnings before interest, tax, depreciation, and amortisation) at $1.55-$1.85 billion, giving investors a concrete earnings floor. The final dividend of $0.30 per share, fully franked, added an income sweetener.
ASX Limited’s 9.0% surge to $60.52 was a different animal. The beat was tiny: FY26 underlying NPAT of $536.4 million, up 5.2%, came in roughly 0.7% above consensus. That is not the kind of number that ordinarily drives a 9% re-rating. What drove it was relief. After years of CHESS replacement uncertainty weighing on the stock’s credibility, a clean result with no fresh operational issues and a final dividend of $1.047 per share (fully franked) cleared an overhang that had compressed the multiple for years.
- Origin Energy: FY26 underlying NPAT $1.6 billion (up 6%); share price $11.86 (up 5.3%); final dividend $0.30, fully franked; FY27 Energy Markets EBITDA guidance $1.55-$1.85 billion
- ASX Limited: FY26 underlying NPAT $536.4 million (up 5.2%, 0.7% above consensus); share price $60.52 (up 9.0%); final dividend $1.047, fully franked
UBS retained its Buy rating on ASX Limited with a $62.00 price target, suggesting modest upside remains even after today’s rally. Citi took a more cautious view, retaining Neutral with a $56.50 price target, viewing the post-result price as rich.
| Metric | Origin Energy (ORG) | ASX Limited (ASX) |
|---|---|---|
| FY26 NPAT | $1.6 billion (up 6%) | $536.4 million (up 5.2%) |
| Share price move | Up 5.3% to $11.86 | Up 9.0% to $60.52 |
| Final dividend | $0.30, fully franked | $1.047, fully franked |
| FY27 guidance | Energy Markets EBITDA $1.55-$1.85B | No specific guidance issued |
| Broker view | UBS Buy, PT $13.45 | UBS Buy, PT $62.00; Citi Neutral, PT $56.50 |
The ASX Limited re-rating tells you something worth remembering: narrative resolution can be worth more than the size of a consensus beat. Once a company clears a credibility overhang, the market re-prices rapidly. The question now is whether that re-rating has already fully run, with the stock trading above Citi’s price target.
When big ASX news breaks, our subscribers know first
What the ANZ update actually said about mortgage lending and bank margins
ANZ reported Q3 FY26 cash profit of $1.90 billion, up 2% on the prior corresponding period. The number that mattered more was the net interest margin (NIM, the gap between what a bank earns on loans and pays on deposits): the group’s NIM edged up by a single basis point, settling at 1.54%. That marginal expansion, in an environment where margins have been under sustained pressure, was the operative signal.
The figure that could have rattled investors was a 12% drop in mortgage applications recorded from the federal Budget through to the close of July 2026. It didn’t rattle them because the market had already absorbed the news. Commonwealth Bank and Westpac had each reported similar slides in their own updates beforehand, so ANZ’s figures reinforced an existing picture rather than introducing a fresh shock, and the market responded in kind. Shares rose 4.5% to $38.04.
Citi retained its Buy rating with a $39.25 price target; UBS retained Neutral at $39.00. With the stock trading near both targets, the market has largely priced in the stabilisation story. The upside from here depends on a NIM expansion that has not yet materialised at scale.
How the major banks tracked on the same day
The broader bank sector reflected ANZ’s constructive update, but not uniformly:
- ANZ: up 4.5% to $38.04
- NAB: up 1.2%
- Westpac: up 0.9%
- CBA: down 2.2%, continuing a recent downward trend
CBA’s decline, with Macquarie retaining Underperform and Morgan Stanley retaining Underweight, served as a counterpoint. Stabilisation in margins helped three of the four majors, but CBA’s valuation premium left it vulnerable to profit-taking on a day the sector broadly moved higher.
Understanding the reporting season pattern: why guidance beats history in August
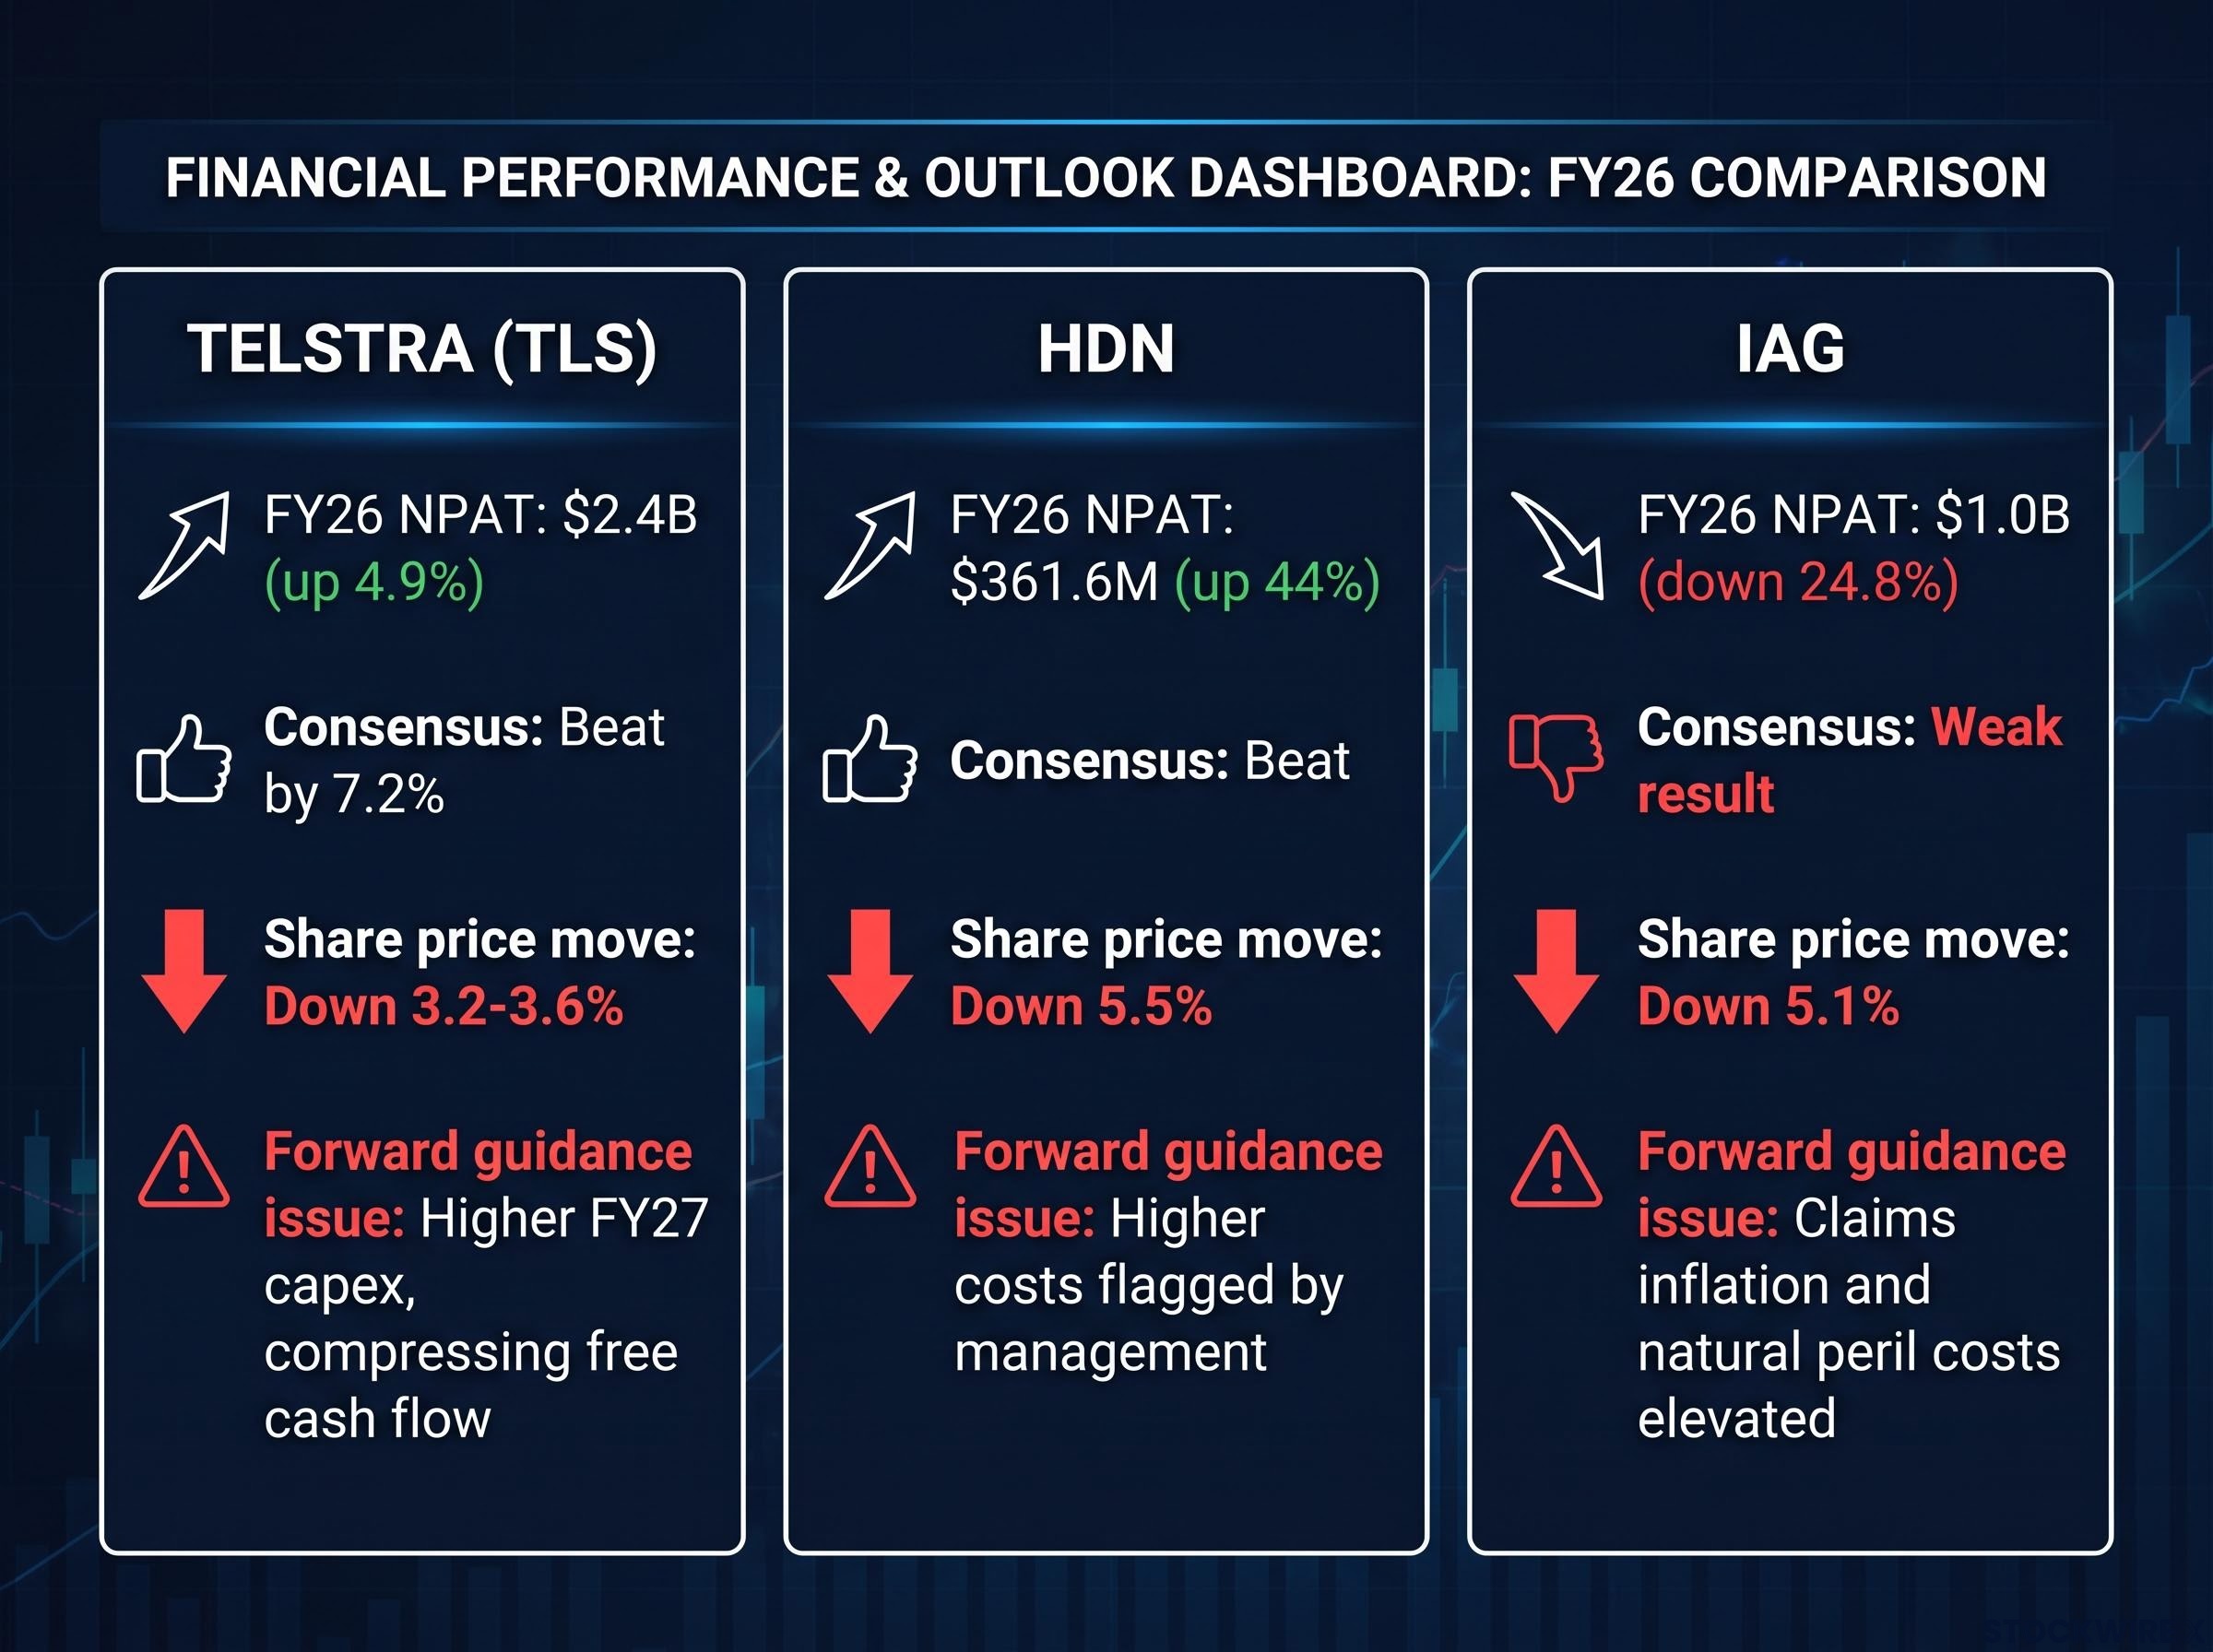
Telstra delivered a 7.2% beat on consensus. H1 FY26 underlying NPAT came in at $2.4 billion, up 4.9% on the prior corresponding period. The stock fell 3.2-3.6% to approximately $4.82-$4.84.
The profit number was fine. What wasn’t fine was the forward guidance. FY27 capital expenditure (capex, the money a company spends on building or maintaining its infrastructure) was guided higher, signalling greater capital intensity ahead and compressing future free cash flow expectations. UBS retained Neutral with a $5.30 price target, acknowledging upside but not enough to justify a more positive rating.
HomeCo Daily Needs REIT (HDN) told the same story from a different sector. FY26 underlying NPAT of $361.6 million was up 44% year on year, a result that looked strong in isolation. Yet with management signalling that costs would rise in the year ahead, investors in a sector acutely attuned to margin pressure sent the share price down 5.5% to $1.205.
Insurance Australia Group (IAG) completed the pattern. FY26 underlying NPAT of $1.0 billion was down 24.8%, driven by claims inflation and elevated natural peril costs. The market’s question was whether those cost drivers are structural or cyclical. Citi retained Neutral at $9.00; UBS retained Buy at $9.45, viewing the sell-off as a potential buying opportunity. The stock fell 5.1% to $7.81.
Telstra’s result is the sharpest illustration of the day’s lesson: a 7.2% consensus beat punished with a 3.6% share price decline. The profit was backward-looking. The capex guidance was forward-looking. The market chose the future.
| Company | FY26 NPAT | Consensus outcome | Share price move | Forward guidance issue |
|---|---|---|---|---|
| Telstra (TLS) | $2.4B (up 4.9%) | Beat by 7.2% | Down 3.2-3.6% | Higher FY27 capex, compressing free cash flow |
| HDN | $361.6M (up 44%) | Beat | Down 5.5% | Higher costs flagged by management |
| IAG | $1.0B (down 24.8%) | Weak result | Down 5.1% | Claims inflation and natural peril costs elevated |
All three underperformers share the same investor logic. A result that demonstrates past strength but signals future cost pressure will be sold. If you are tracking the remaining results through August, apply this lens: when a stock drops on what looks like a decent profit number, check the cost and capex guidance first. That is where the market is looking.
Treasury Wine Estates and how markets read through a billion-dollar statutory loss
A company reports a statutory loss exceeding $1 billion and its stock rises 4.9%. That demands an explanation.
Treasury Wine Estates (TWE) delivered FY26 EBITS (earnings before interest, tax, and the SGARA agricultural accounting adjustment) of $492.3 million, down 36.1% on the prior corresponding period. The statutory loss exceeded $1 billion, driven by asset write-downs. Yet the stock climbed to $5.77.
The market decoded it in three steps:
- Beat versus own guidance: TWE had previously guided FY26 EBITS at $480-$490 million. The result cleared that bar.
- Non-recurring write-downs: The billion-dollar-plus statutory loss stemmed from asset resets, not operating weakness. Investors with a sophisticated read of the accounts concluded that those write-downs reset the balance sheet for a cleaner earnings base going forward.
- FY27 floor guidance: Management guided FY27 EBITS to be “at least equivalent” to FY26, providing a floor without committing to growth. The market read this as conservative rather than cautious.
All three major covering brokers retain Buy or Outperform ratings. Bell Potter (Buy, price target cut to $16.50 from $18.00), Macquarie (Outperform, $15.70), and UBS (Buy, price target cut to $16.50 from $17.50) all see price targets in the $15-$17 range against a current price near $5.77.
That implied upside is substantial, but the thesis depends on the write-downs being genuinely non-recurring and the brand recovery continuing on schedule. For investors who encounter large write-downs in other results this month, the TWE case study offers the critical distinction: is the loss an operational failure, or an accounting reset? The market’s answer determines the reaction.
Energy, geopolitics, and the Iran conflict premium still flowing through ASX results
Origin’s result was not just a company story. It was a geopolitical one. Elevated wholesale energy prices tied to the Iran conflict were explicitly cited as the driver of the Energy Markets division’s outperformance, making geopolitical risk a live earnings variable rather than background context.
The FY27 Energy Markets EBITDA guidance range of $1.55-$1.85 billion tells you exactly how uncertain that variable is. The $300 million width of the range reflects genuine ambiguity about how long the geopolitical premium persists. Any investor position in Origin is implicitly a view on Iran conflict duration as much as it is a view on the company’s operating performance.
The broader energy sector attracted constructive broker activity on the same day. AGL Energy saw a notable range of views:
- Citi: Buy, price target $10.90
- Ord Minnett: upgraded to Accumulate, price target $11.25
- UBS: Buy, price target $10.00
- Morgan Stanley: Underweight, price target $9.28
- Macquarie: Underperform, price target $7.94
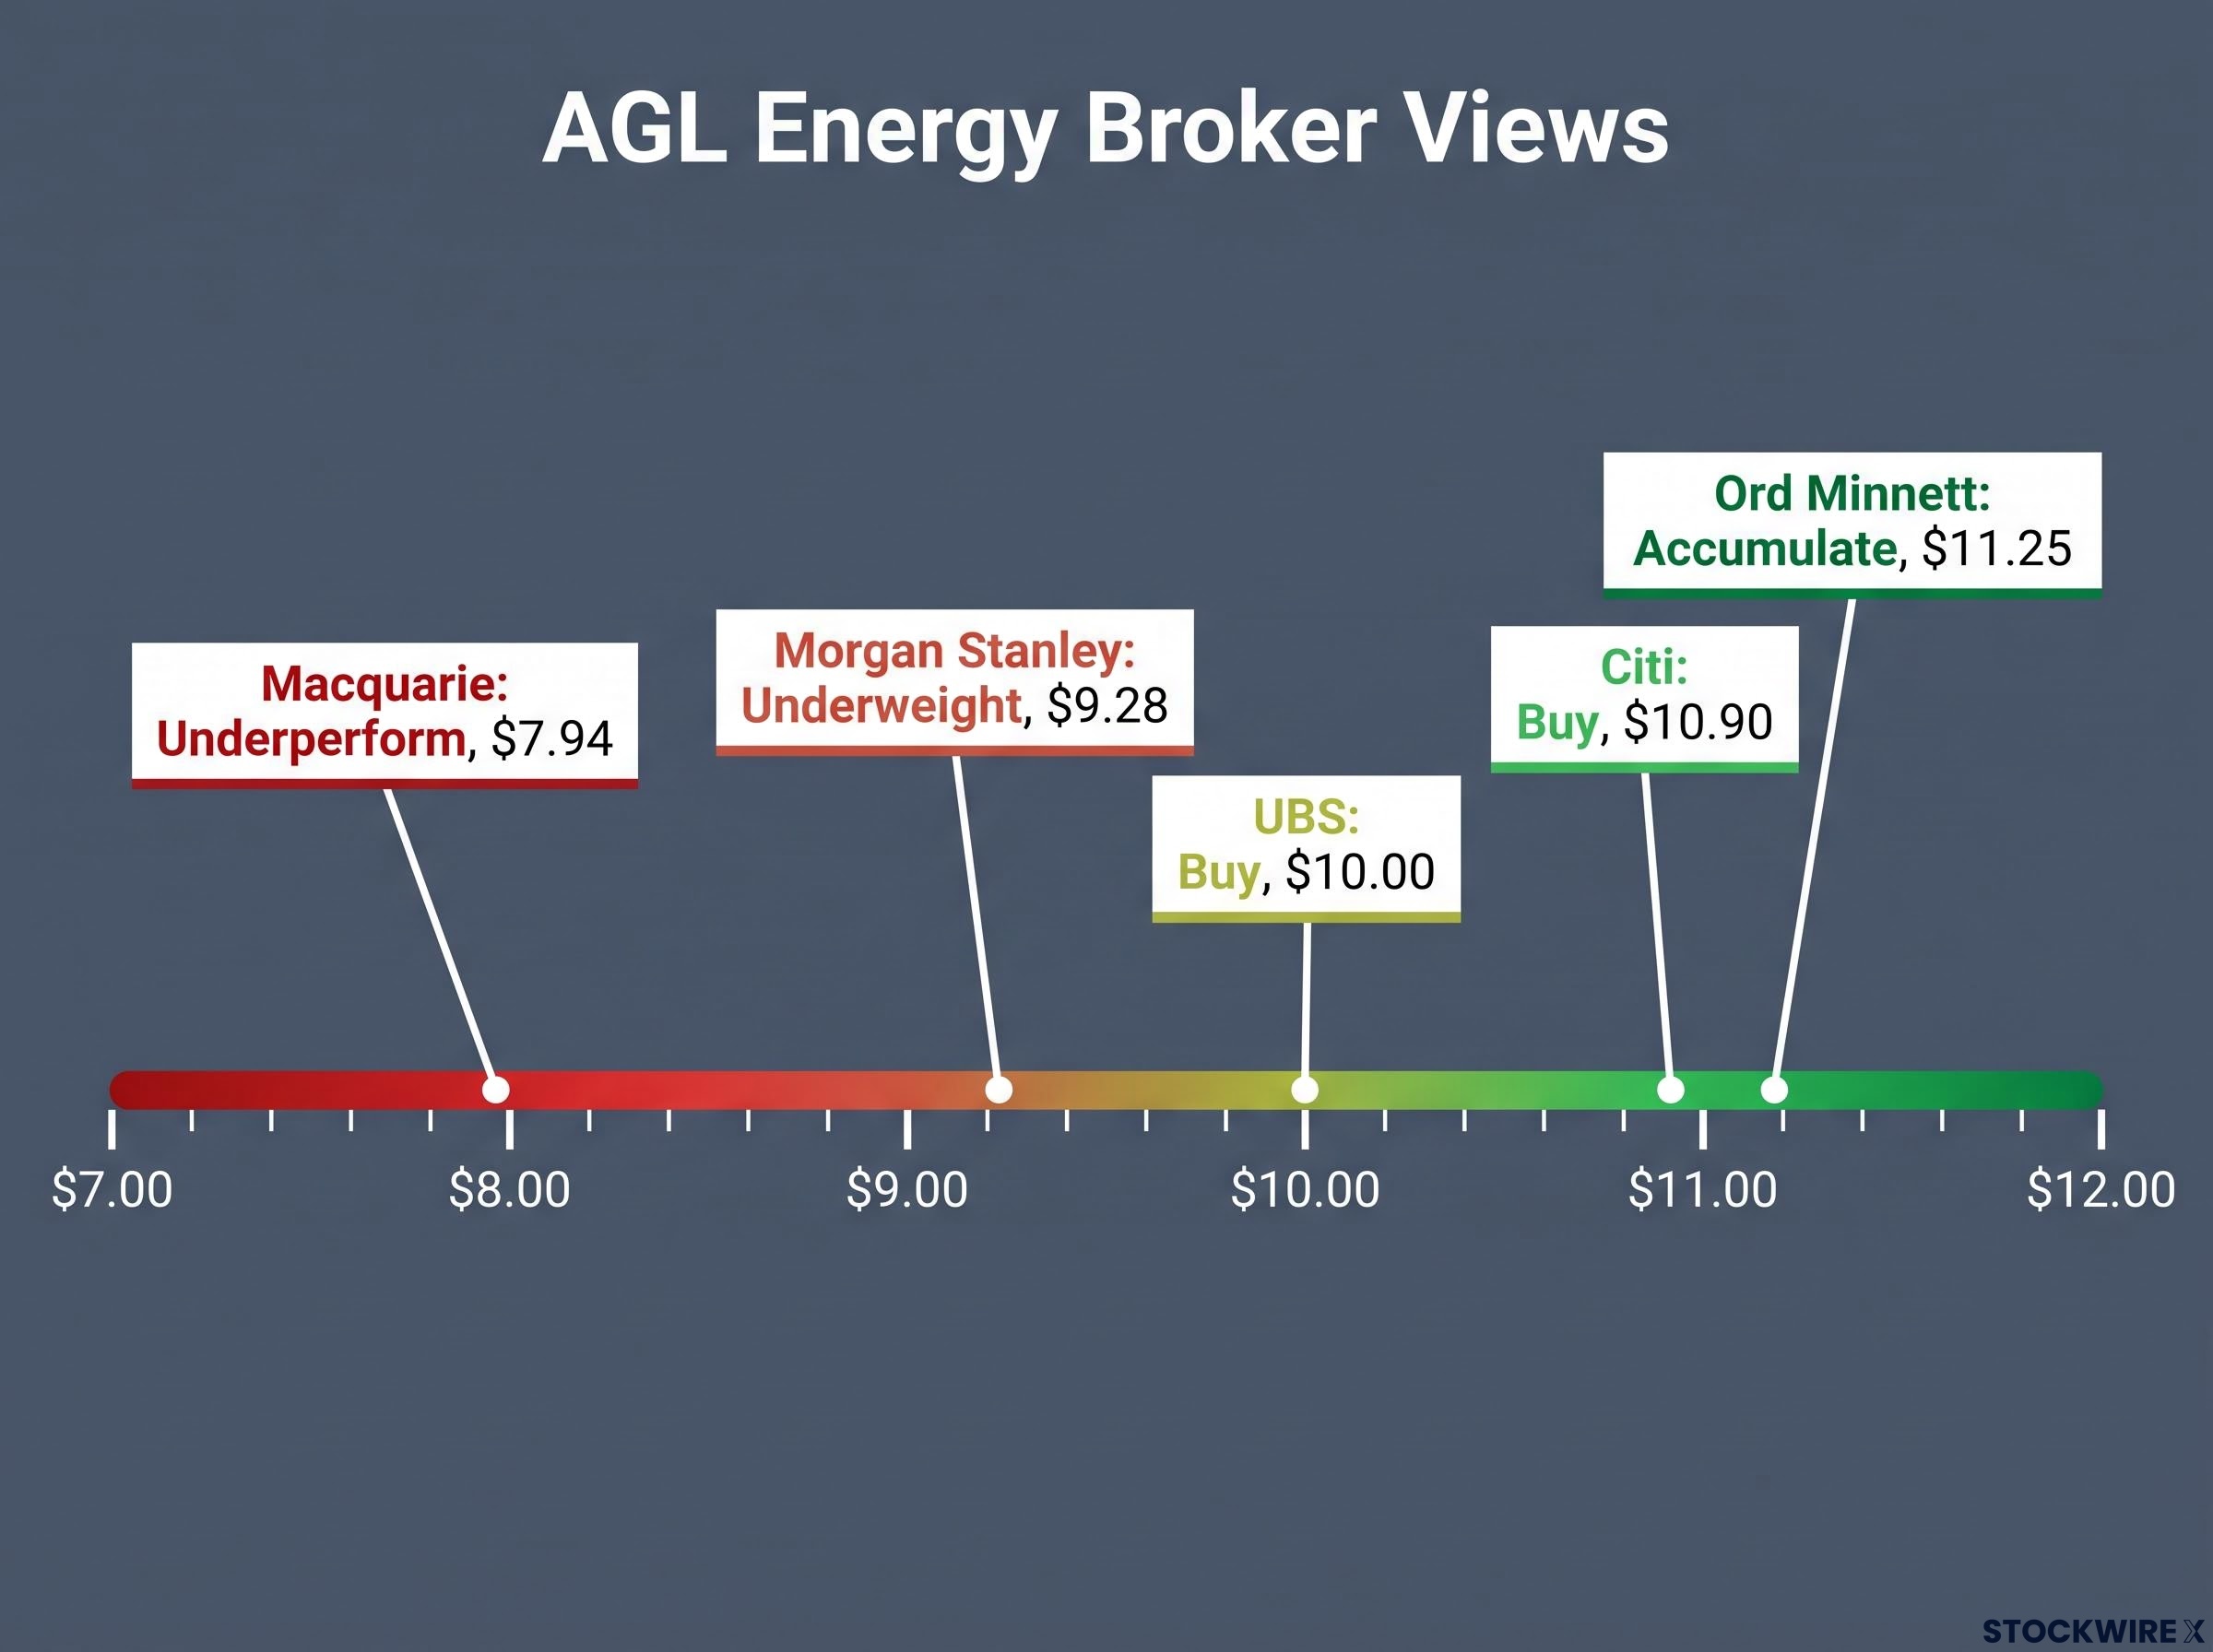
The breadth of that divergence, from Macquarie’s $7.94 to Ord Minnett’s $11.25, reflects genuine disagreement about whether the geopolitical energy premium is durable or fleeting. For investors holding or considering energy sector exposure, understanding that the current earnings strength is at least partly geopolitical rather than structural helps calibrate how durable the profit base actually is.
What this session signals for the weeks ahead in reporting season
The day’s dominant signal is clear: guidance on future costs and capital expenditure is more price-determinative than past profit in the current reporting environment. Telstra, HDN, and IAG proved it from the sell side. Origin, ASX Limited, and TWE proved it from the buy side, each for different reasons but all rewarded for forward signals rather than backward results.
Broker price target changes on the day were predominantly conservative. Most ratings were retained rather than upgraded or downgraded, with target revisions modest. The analyst community does not view this session as fundamentally altering sector outlooks but rather confirming existing theses.
The insurance sector showed the sharpest intra-sector divergence. While IAG fell 5.1%, Suncorp attracted price target raises from three of four covering brokers: Citi to $19.80, Macquarie to $20.60, and UBS to $21.50. Same sector, opposite direction.
Three live variables will determine which remaining August results are bought and which are sold:
- Geopolitical energy price premium durability: How long the Iran conflict sustains elevated wholesale prices, and whether Origin’s wide guidance range proves conservative or optimistic.
- Bank NIM trajectory: Whether ANZ’s marginal stabilisation at 1.54% extends to NAB and Westpac full-year results, or whether it proves to be bank-specific.
- Cost guidance sensitivity in REITs and insurers: HDN and IAG showed that these sectors face the harshest market punishment for forward cost signals; watch for the same dynamic in remaining results.
The SEEK broker divergence is also worth monitoring: Bell Potter downgraded to Hold at $15.20 while Ord Minnett retained Buy at $22.00, a gap that additional data should resolve in the coming weeks.
When a result drops in the weeks ahead, the first question is not what the profit number was. It is what the cost and capex guidance said. The market demonstrated that clearly on 13 August, and the pattern is unlikely to shift before the reporting window closes.
This article is for informational purposes only and should not be considered financial advice. Investors should conduct their own research and consult with financial professionals before making investment decisions. Past performance does not guarantee future results. Financial projections are subject to market conditions and various risk factors.
—