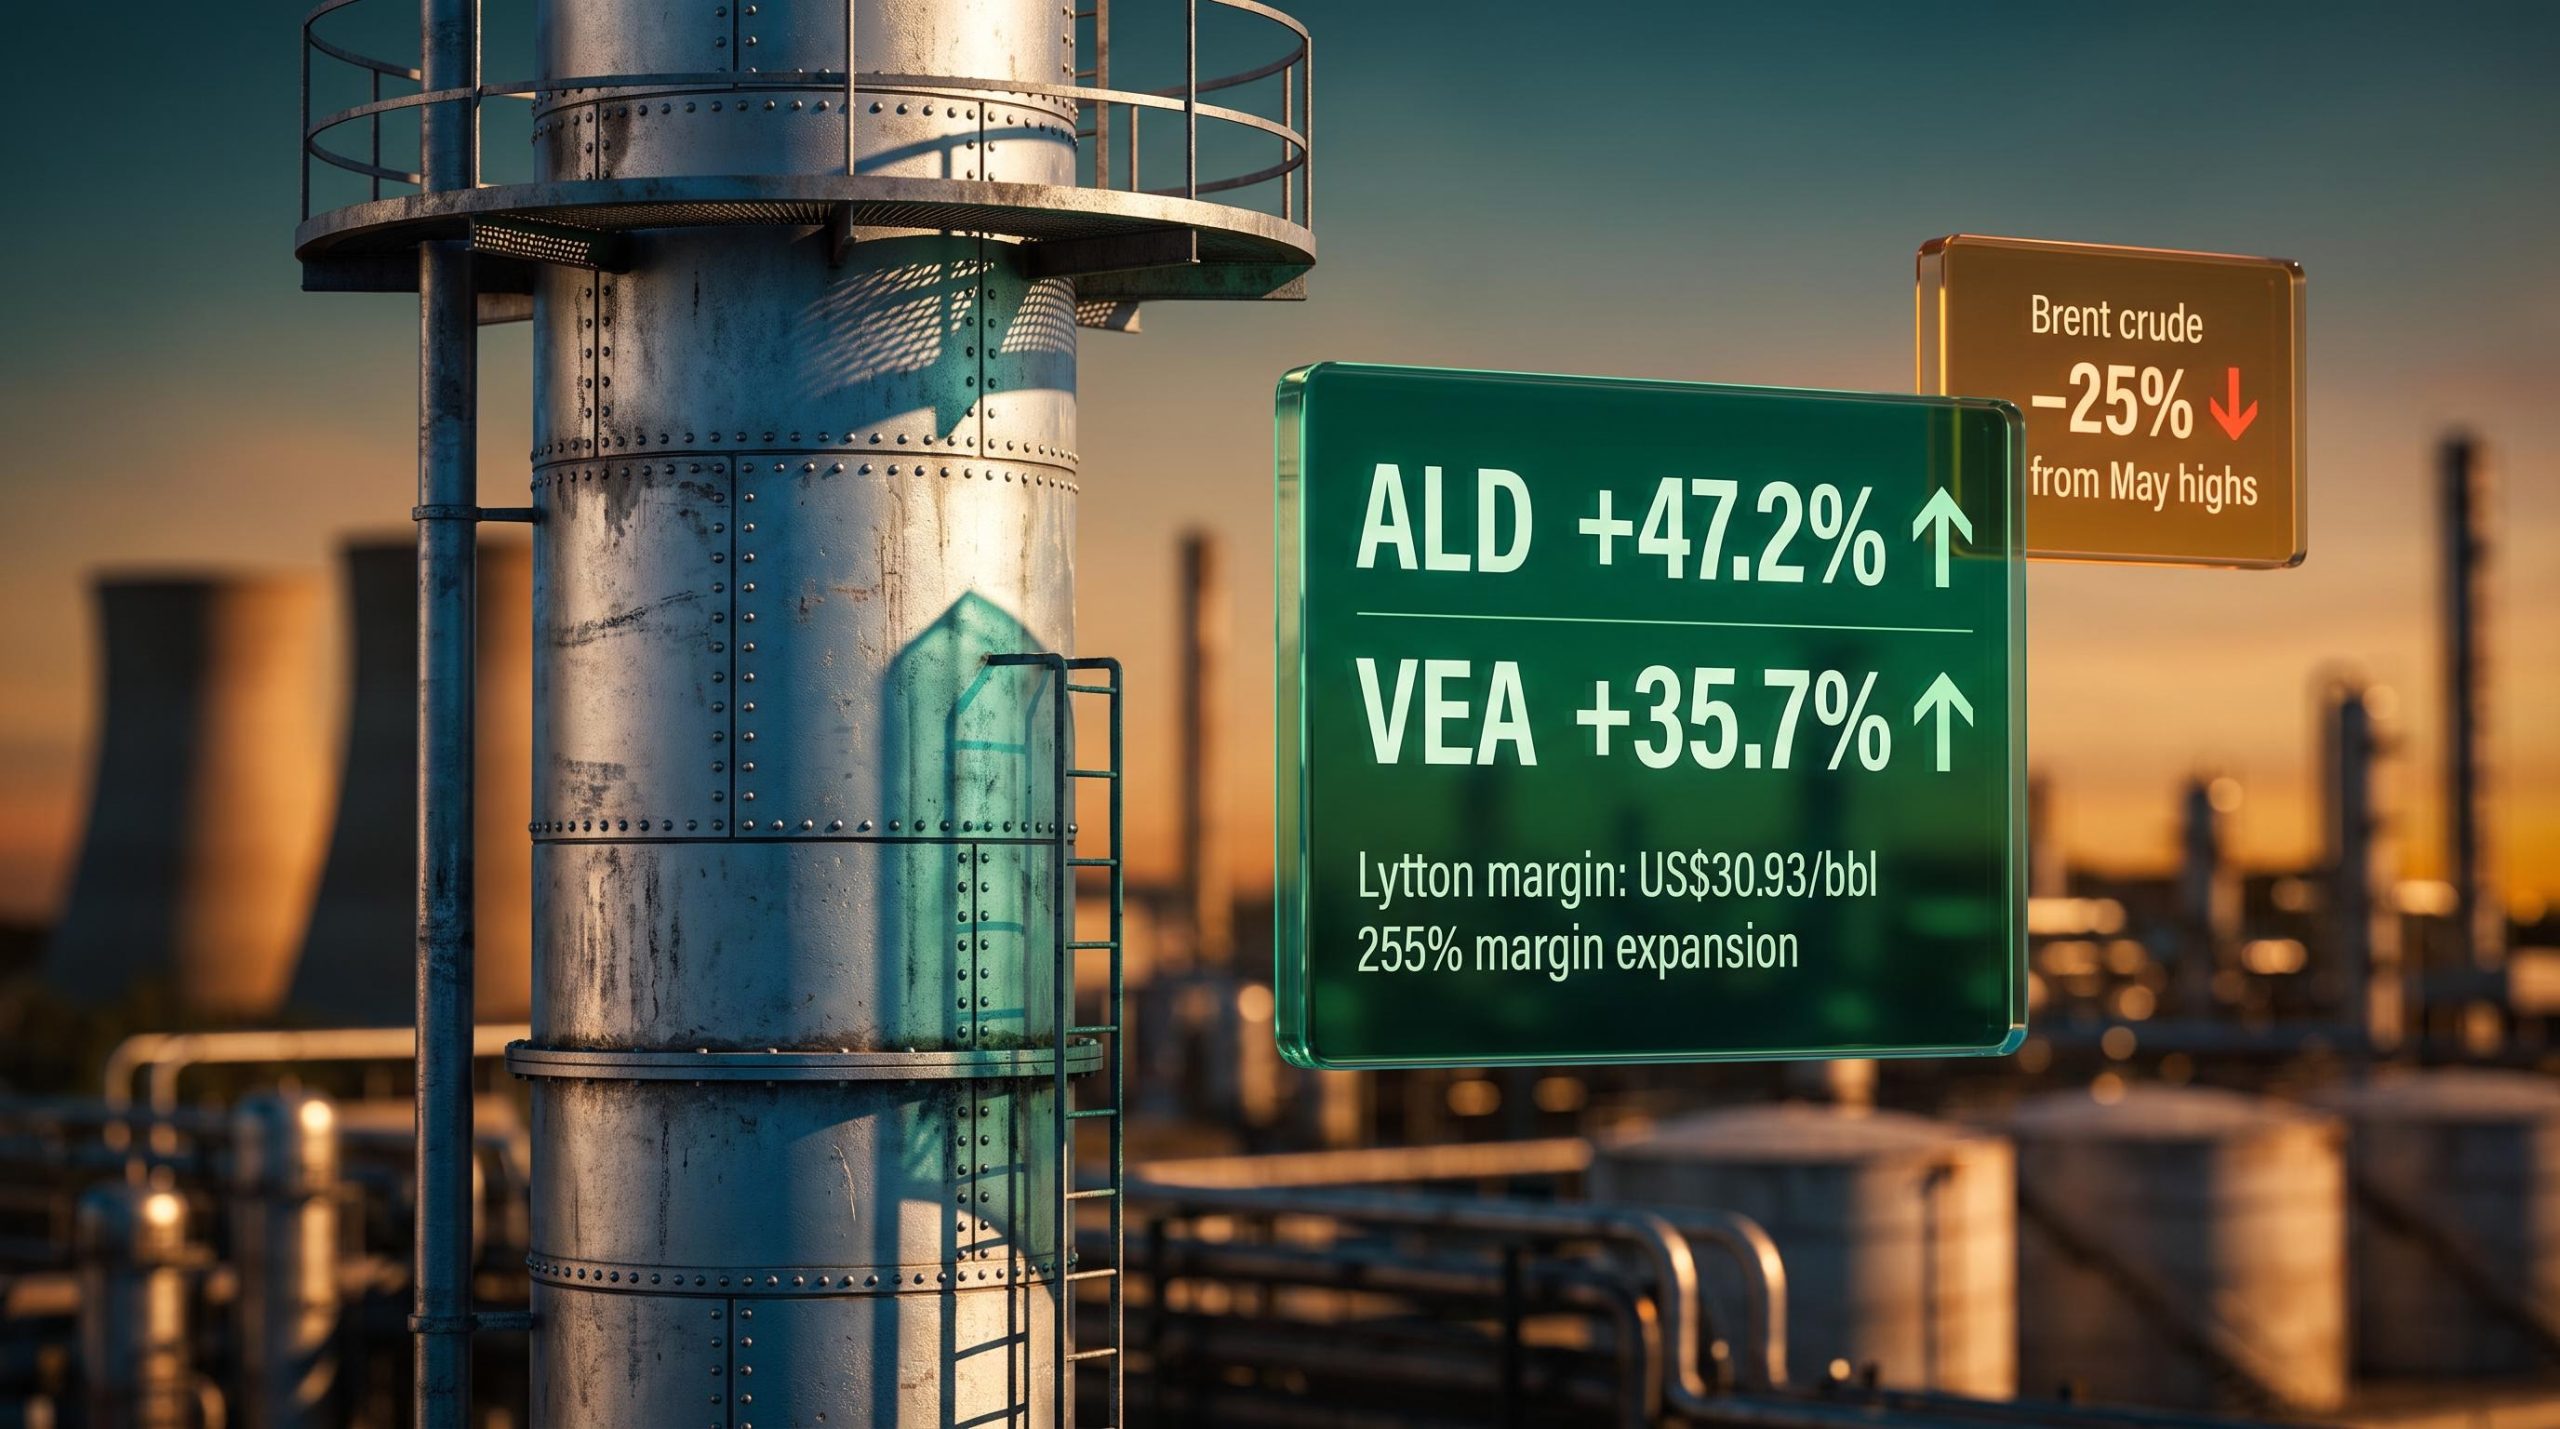
Crude oil has pulled back to a level roughly 25% beneath the peaks it reached in early May 2026. That is supposed to be bad news for energy stocks. Yet in the final week of July, two ASX energy names hit multi-year share price records.
Ampol (ASX: ALD) closed at $39.90 on 31 July 2026, a multi-year high. Viva Energy (ASX: VEA) closed at $2.85, a fresh 52-week high. Both stocks surged while the majority of their energy sector peers were nursing losses of 10-15% against earlier highs, still working through the crude selloff that characterised mid-2026.
The divergence is not a lucky quarter. It is a structural story about what these two companies actually are: downstream refiners and fuel retailers, not upstream oil producers. Their profits track a completely different variable. Here is the framework for understanding why that distinction drove a 47% rally in one stock and a 36% rally in the other, whether the move has structural legs or is a margin spike, and how to think about downstream versus upstream exposure in your ASX energy holdings.
One week, two stocks, two multi-year highs
Ampol gained 3.2% for the week ending 31 July 2026 and is now up 47.2% year-on-year. Viva Energy surged 14.0% in the same week and has gained 35.7% over the past twelve months. Both hit their respective multi-year and 52-week highs in a week where the ASX 200 itself had only just broken to a five-month high for the first time in months.
The broader energy sector told a different story. Brent crude had climbed approximately 20% off its 2 July 2026 low, yet the recovery still left it around 25% short of where it was changing hands in early May. The typical upstream ASX energy names, the Woodsides and Santos of the index, were still trading well short of their earlier peaks, in some cases by 10-15% or more. They were in repair mode while the refiners were setting records.
The internal divergence was unusually stark. Among the 16 S&P/ASX 200 stocks that registered new 52-week extremes during Week 32, the energy sector alone managed to place two names at fresh highs while simultaneously sending one to a new low.
The contrast with conditions just weeks earlier is sharp: while Ampol and Viva were setting records in late July, ASX energy names were sliding to energy sector lows in Week 26 as easing US-Iran tensions stripped a geopolitical risk premium from crude prices and directly repriced upstream cash flows, illustrating how quickly the upstream-downstream divergence can shift direction.
| Company | One-week return | One-year return | Share price milestone |
|---|---|---|---|
| Ampol (ALD) | +3.2% | +47.2% | Multi-year high |
| Viva Energy (VEA) | +14.0% | +35.7% | 52-week high |
| Upstream average (e.g. Woodside, Santos) | Flat to slightly positive | Considerably below earlier highs, by roughly 10-15% | No new high |
That gap between refiners setting records and upstream names still in recovery is not noise. It tells you that the ASX energy sector is not a single trade, and investors treating it as one are likely misreading where the actual earnings momentum sits.
When big ASX news breaks, our subscribers know first
What crack spreads are, and why they matter more than oil prices for refiners
If you looked only at the crude oil price in June and July 2026, you would expect every energy stock on the ASX to be struggling. Crude was down 25% from its May highs. Yet Ampol’s Lytton refinery reportedly saw second-quarter refining margins jump approximately 255%, from roughly US$8.71 per barrel to approximately US$30.93 per barrel. Viva’s Geelong refinery reportedly more than doubled its first-half margins versus the prior corresponding period.
The explanation sits in a single metric: the crack spread. A crack spread is the difference between what a refiner pays for crude oil (its input cost) and the market price of the refined products it sells, petrol, diesel, and jet fuel. It is the refiner’s profit margin per barrel processed.
The key insight is that crack spreads can widen even when crude falls. If product markets tighten, meaning the price of petrol and diesel holds firm because supply is constrained, while the cost of crude declines, the gap between input and output widens. The refiner captures more profit per barrel.
The divergence between crude and diesel prices is not unique to Australia: refined product markets globally registered a 20% surge in US diesel futures during a single week in July 2026 while headline crude held flat, confirming that physical delivery stress in refined products can materialise well before aggregate supply is formally disrupted.
Three supply-side factors kept product markets tight across the first half of 2026:
- Middle East conflict disrupting shipping routes and oil product flows
- China reportedly instructing major refiners to suspend gasoline and diesel exports, reducing Asia-Pacific refined product supply
- Broader Asia-Pacific refining capacity constraints from maintenance outages and underinvestment
Lytton margin expansion: Ampol’s Lytton refinery margins reportedly jumped approximately 255%, from roughly US$8.71/bbl to approximately US$30.93/bbl year-on-year.
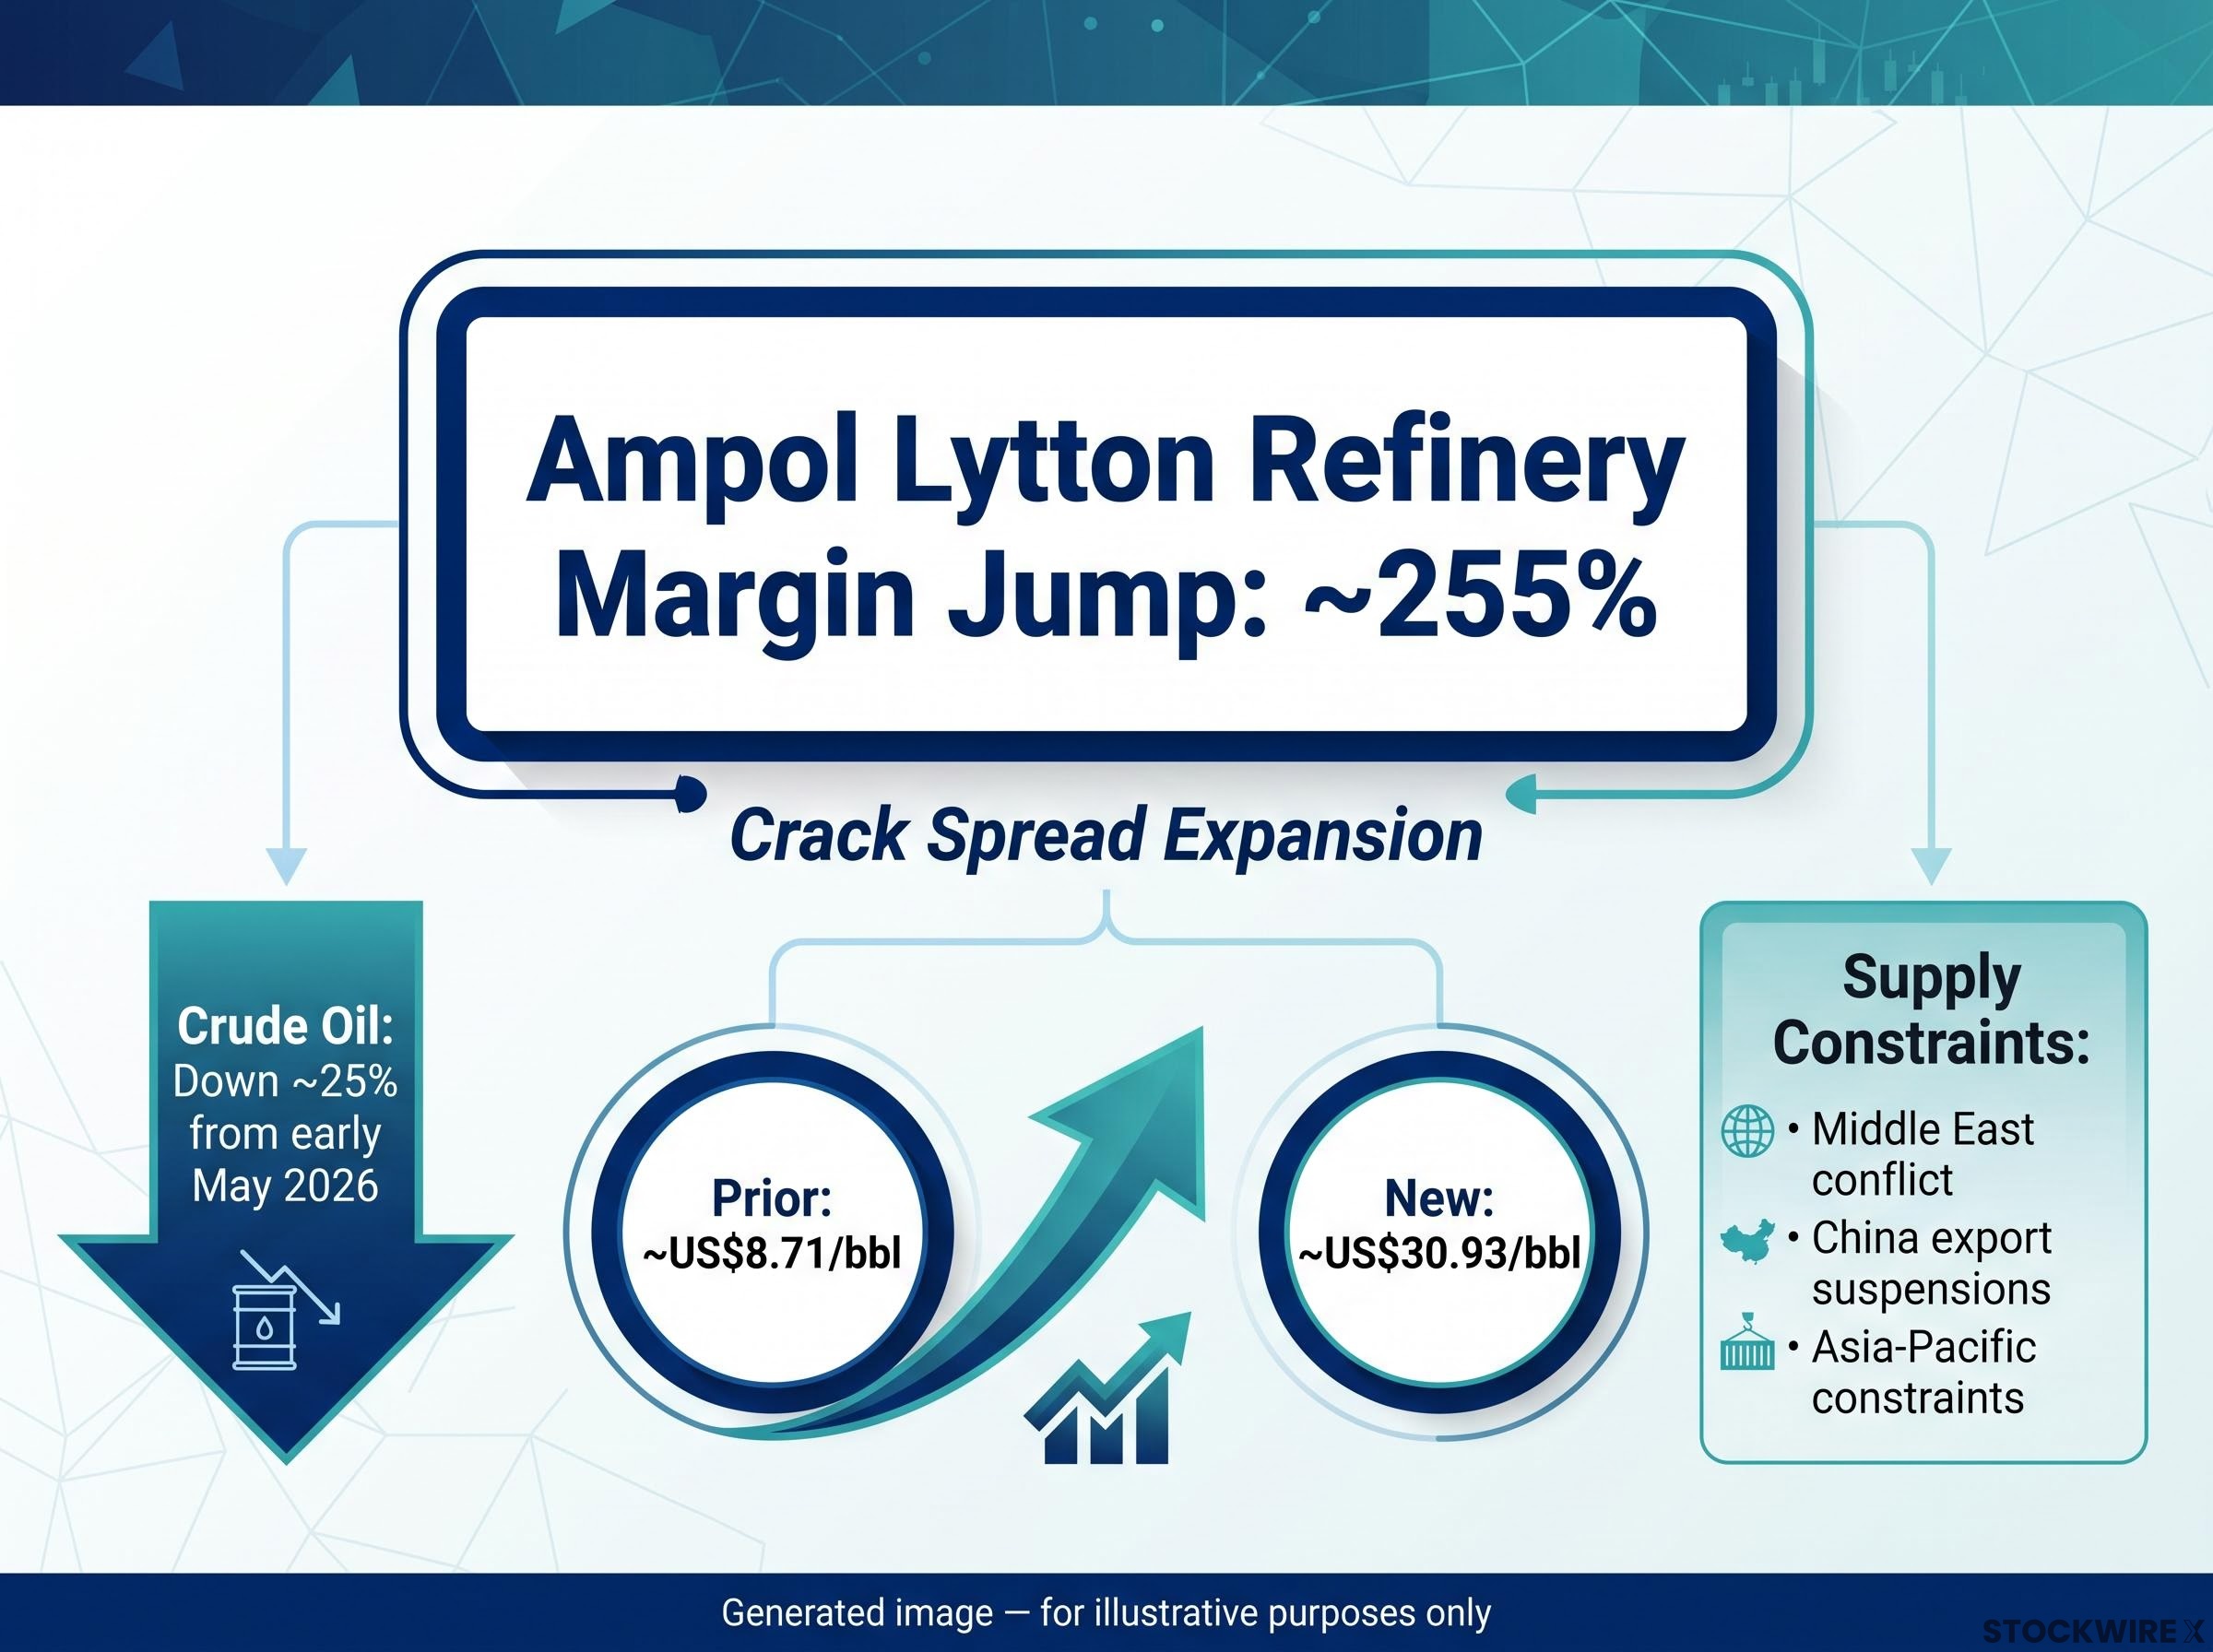
That 255% margin jump means Ampol was capturing roughly three and a half times more profit per barrel processed than a year earlier, and that dynamic held even as crude-linked stocks were repricing downward. Understanding crack spreads gives you a completely different lens for evaluating refiner earnings. A refiner’s share price can surge on falling oil if product prices hold firm, which is precisely what happened here.
Why Australia’s limited refining base amplifies the margin effect
Strong crack spreads explain the current quarter. But the rally in Ampol and Viva is not purely cyclical. There is a structural layer underneath it that gives these two companies a more durable advantage than the margin data alone would suggest.
Australia’s domestic refining capacity has shrunk dramatically over the past decade. A series of refinery closures left the country with just two principal remaining domestic refineries: Ampol’s Lytton (Brisbane) and Viva’s Geelong (Victoria). That scarcity matters. With fewer domestic competitors, both refiners play a more significant role in national fuel security and face less margin pressure from local competition than refiners in the US or Asia.
Their vertically integrated retail networks (Ampol operates the Ampol/Caltex network; Viva operates Shell-branded sites) add a further layer of downstream revenue that upstream producers simply do not have.
- Limited domestic competition: two principal refineries remain after years of closures
- National fuel security role: both are strategically important to Australia’s fuel supply chain
- Vertically integrated retail networks: fuel distribution adds revenue beyond refining margins
- FSSP earnings floor: government-backed downside protection (see below)
The Fuel Security Services Payment as an earnings floor
The Fuel Security Services Payment (FSSP) is a federal mechanism designed to keep domestic refining viable. When crack spreads fall below a defined threshold (the margin marker), the government supplements refiner revenue to ensure operations remain economically sustainable. It functions as an earnings floor: when margins are strong, refiners keep the upside; when margins weaken, the FSSP limits the downside.
A recent review of the programme reportedly raised the margin marker collar, improving the threshold at which support begins. Both Ampol and Viva publicly welcomed the revised terms, and their shares responded positively to the announcement.
Upstream producers have no equivalent policy backstop. When crude prices fall, Woodside and Santos absorb the full impact on their revenue lines. The FSSP means Ampol and Viva operate with a genuinely different risk-return profile, one where the downside is structurally limited in a way that has no parallel elsewhere in ASX energy.
Upstream versus downstream: why the ASX energy sector is not one trade
Investors who hold “energy” as a single category in their portfolio made a category error in the first half of 2026. Within Week 32 alone, the sector produced two stocks at record highs, one stock at a fresh 52-week low, and the remainder scattered between those extremes. That is a sector pulling simultaneously in opposite directions, not moving together.
The distinction comes down to profit drivers. Upstream producers like Woodside and Santos earn revenue by selling crude oil and natural gas at or near prevailing commodity prices. When Brent drops 25%, their realised prices and earnings fall in near-direct proportion. Downstream refiners like Ampol and Viva earn on the spread between input costs and output prices. A crude price decline can actually benefit them if product markets stay tight, because their input costs fall while their selling prices hold.
Macquarie reportedly upgraded Viva Energy to Outperform during this period, with materially lifted target prices. That kind of broker action reflects a structural reassessment of where value sits in Australian energy, not just a short-term margin trade.
| Attribute | Upstream (Woodside, Santos) | Downstream (Ampol, Viva) |
|---|---|---|
| Primary profit driver | Commodity price (crude oil, LNG) | Crack spread (refining margin) |
| Sensitivity to crude oil price | High, direct | Indirect; can benefit from falling crude |
| Policy support mechanisms | None equivalent to FSSP | FSSP earnings floor |
| Recent share price trajectory | Materially below prior peaks, by 10-15% or more | Setting fresh multi-year and 52-week highs |
The fact that the ASX energy sector posted both new highs and a new low in the same week tells you that sector-level exposure smooths out precisely the divergences where active positioning creates value. If you hold an ASX energy ETF or a diversified energy allocation, Week 32 was a direct reminder that sub-sector positioning matters more than broad sector bets.
The pattern is consistent with a broader dynamic documented across the oil shock period: ASX sector rotation between February and March 2026 produced a 63-percentage-point spread between the best and worst performers, with the S&P/ASX 200 Energy index gaining 16.1% while most of the market fell, confirming that value-chain positioning inside energy drives more portfolio variance than any macro-level sector call.
What investors should watch to judge whether the rally has legs
The rally has happened. The question now is whether it continues, pauses, or reverses. That depends on four specific, observable variables, each with a clear signal direction.
- Crack spread trajectory. This is the primary variable. If refined product prices stay firm relative to crude because supply disruptions persist, margins remain elevated and the earnings story holds. If Asian refining capacity normalises, or China lifts its reported gasoline and diesel export suspension, product supply increases and margins compress. Watch Singapore complex refining margins as the regional benchmark.
- Geopolitical disruption. Ongoing Iran-US tensions and Middle East conflict maintain the risk of further shipping disruptions and export curbs. Any escalation keeps product markets tight and supports refiner margins. De-escalation eases supply constraints and likely compresses spreads.
- Domestic demand indicators. Transport fuel consumption, jet fuel demand recovery, and diesel volumes all feed directly into refinery utilisation and margin capture. Stronger domestic demand supports both throughput and pricing power.
- FSSP and policy stability. The FSSP provides the structural floor. Any revision to the framework, tightening of environmental regulation around domestic refining, or acceleration in electric vehicle adoption represents a medium-term headwind that could erode the structural advantages described above.
The core distinction for investors: current crack spread expansion is cyclical and will normalise. The FSSP earnings floor and limited domestic competition are structural and more durable. Your assessment of Ampol and Viva depends on how much of each is priced into the current share price.
Investors holding Ampol or Viva after this rally need to separate those two components. The cyclical part of the margin expansion will normalise as supply disruptions ease. The structural part, policy support and limited domestic competition, is more durable. The share price already reflects a lot of the good news, so the framework for deciding whether to hold, take profits, or wait for a pullback sits in tracking which component is driving marginal changes in earnings expectations.
For investors evaluating whether current Ampol and Viva valuations already price in the macro risks, our deep-dive into the Australian market outlook during the oil shock examines the near-zero ASX equity risk premium, institutional price forecasts of $140-150 per barrel, and the RBA rate path that frames the broader valuation environment for all ASX energy names.
What the refiner divergence tells you about positioning in Australian energy
The divergence across the sector is striking in its scale: Ampol advancing 47.2% year-on-year and Viva gaining 35.7%, while most upstream names continued to trade below their earlier peaks. The rally was driven by a combination of cyclical factors (elevated crack spreads from supply disruption) and structural factors (FSSP earnings floor, limited domestic refining competition, vertically integrated retail networks). Each requires separate monitoring going forward.
The structural case for Australian refiners is distinct from the cyclical case. Policy-backed downside protection and limited domestic competition are durable advantages. Current crack spread expansion is temporary. Each deserves separate analysis when evaluating current valuations.
The investor who can separate what is structural from what is cyclical in Ampol and Viva’s current earnings is the one positioned to make a confident call on whether these valuations represent fair value, stretched pricing, or a buying opportunity after any future pullback.
The broader lesson applies beyond this quarter. Every time a macro event hits crude prices and the question becomes which ASX energy names are actually exposed to it, the upstream-downstream distinction is where the actionable insight lives. Sector-level analysis misses it. Value-chain positioning captures it.
This article is for informational purposes only and should not be considered financial advice. Investors should conduct their own research and consult with financial professionals before making investment decisions. Past performance does not guarantee future results. Financial projections are subject to market conditions and various risk factors.