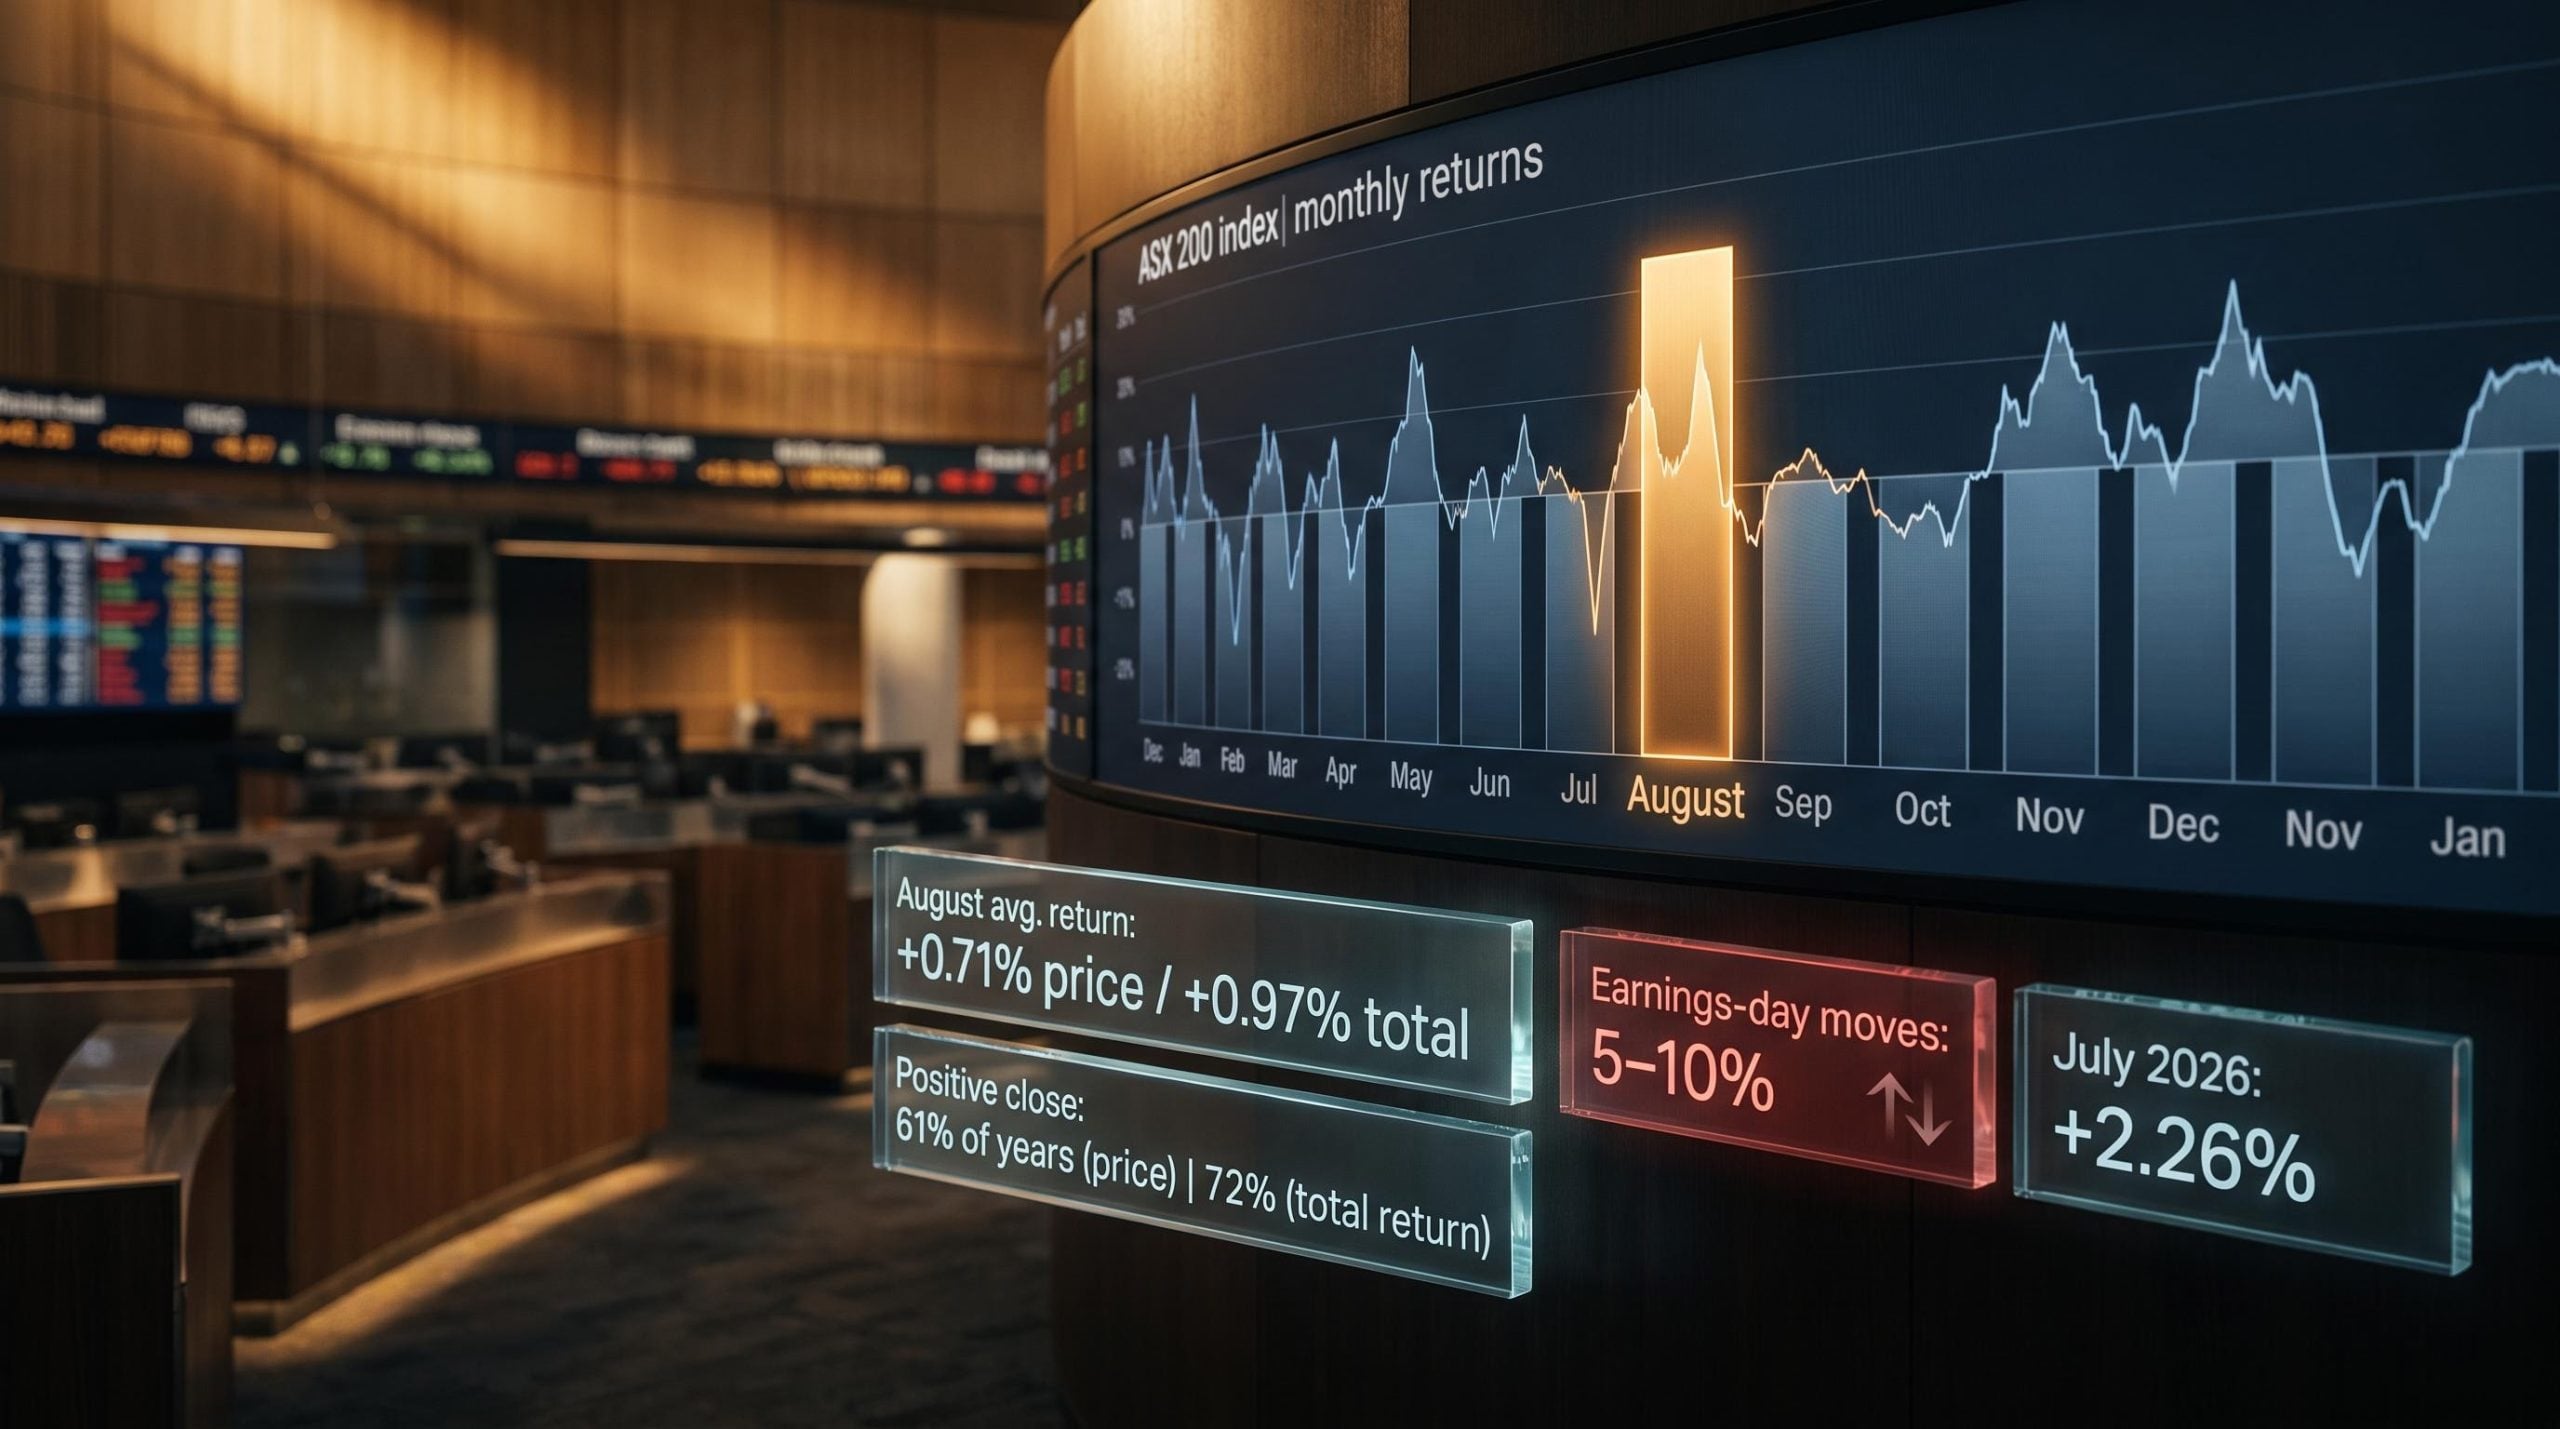
August sits in a curious position in the Australian equity calendar. Historically, it ranks among the better months for the ASX 200. Yet recent Augusts have repeatedly disappointed investors who trusted that average.
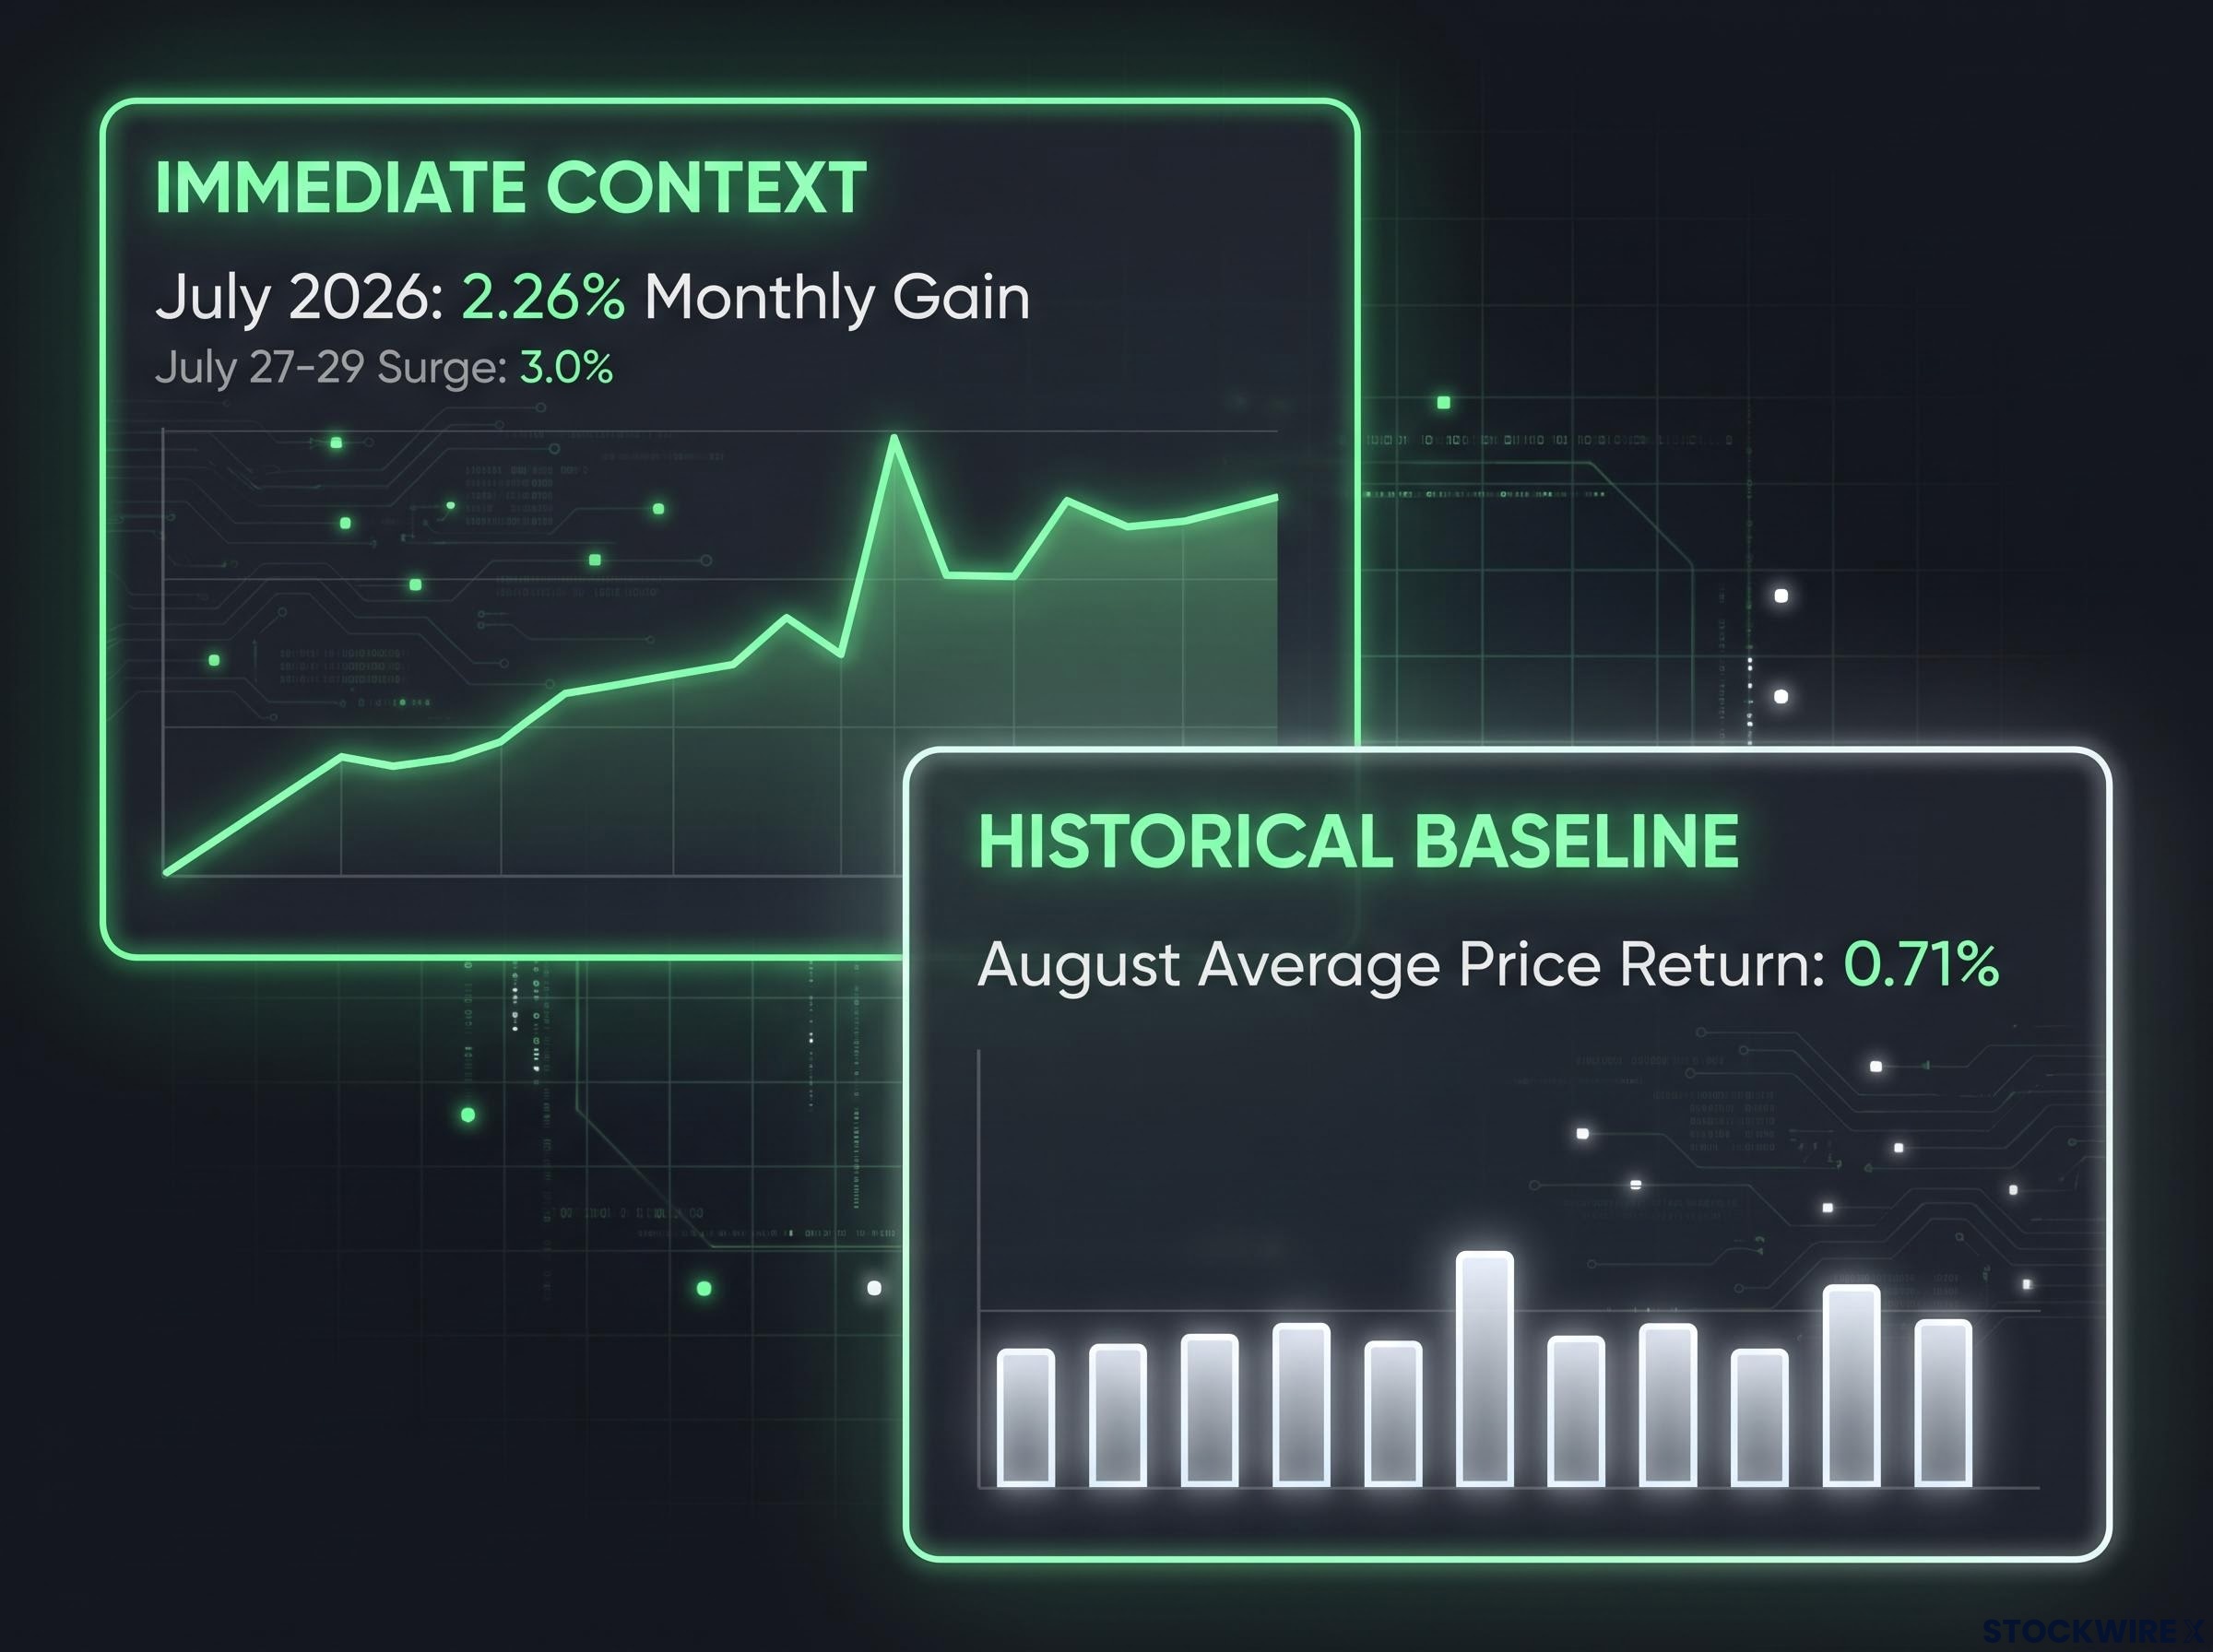
The gap between the long-run record and recent experience is not random noise. It reflects a structural shift in how reporting season now moves markets, one that every investor positioning portfolios at the start of August needs to understand. July 2026 delivered a 2.26% gain for the index, finishing close to a five-month peak. Whether August continues that momentum or stalls depends less on seasonal tendencies and more on what unfolds across a concentrated burst of earnings releases.
Here is what the data actually tells you about ASX 200 August performance, where the averages are reliable and where they mislead, and how to place all of it in your thinking when sizing positions and managing risk through the month.
What 45 years of data actually says about August
Looking back to 1980, the ASX 200 has posted an average August price return of 0.71%, finishing above its opening level in 61% of those years. That record places it as the fourth-strongest month by average price return in the Australian equity calendar. Constructive, but not spectacular.
Extending the analysis to total return data, which becomes available from 2001 onward, reveals a more favourable picture. Over that period, August has produced an average gain of 0.97%, with a positive monthly close recorded in 72% of years. That 26 basis point gap between price return and total return is almost entirely attributable to dividends, and it tells you something worth pausing on: investors looking only at the price chart are systematically underestimating what August has historically delivered for a buy-and-hold portfolio.
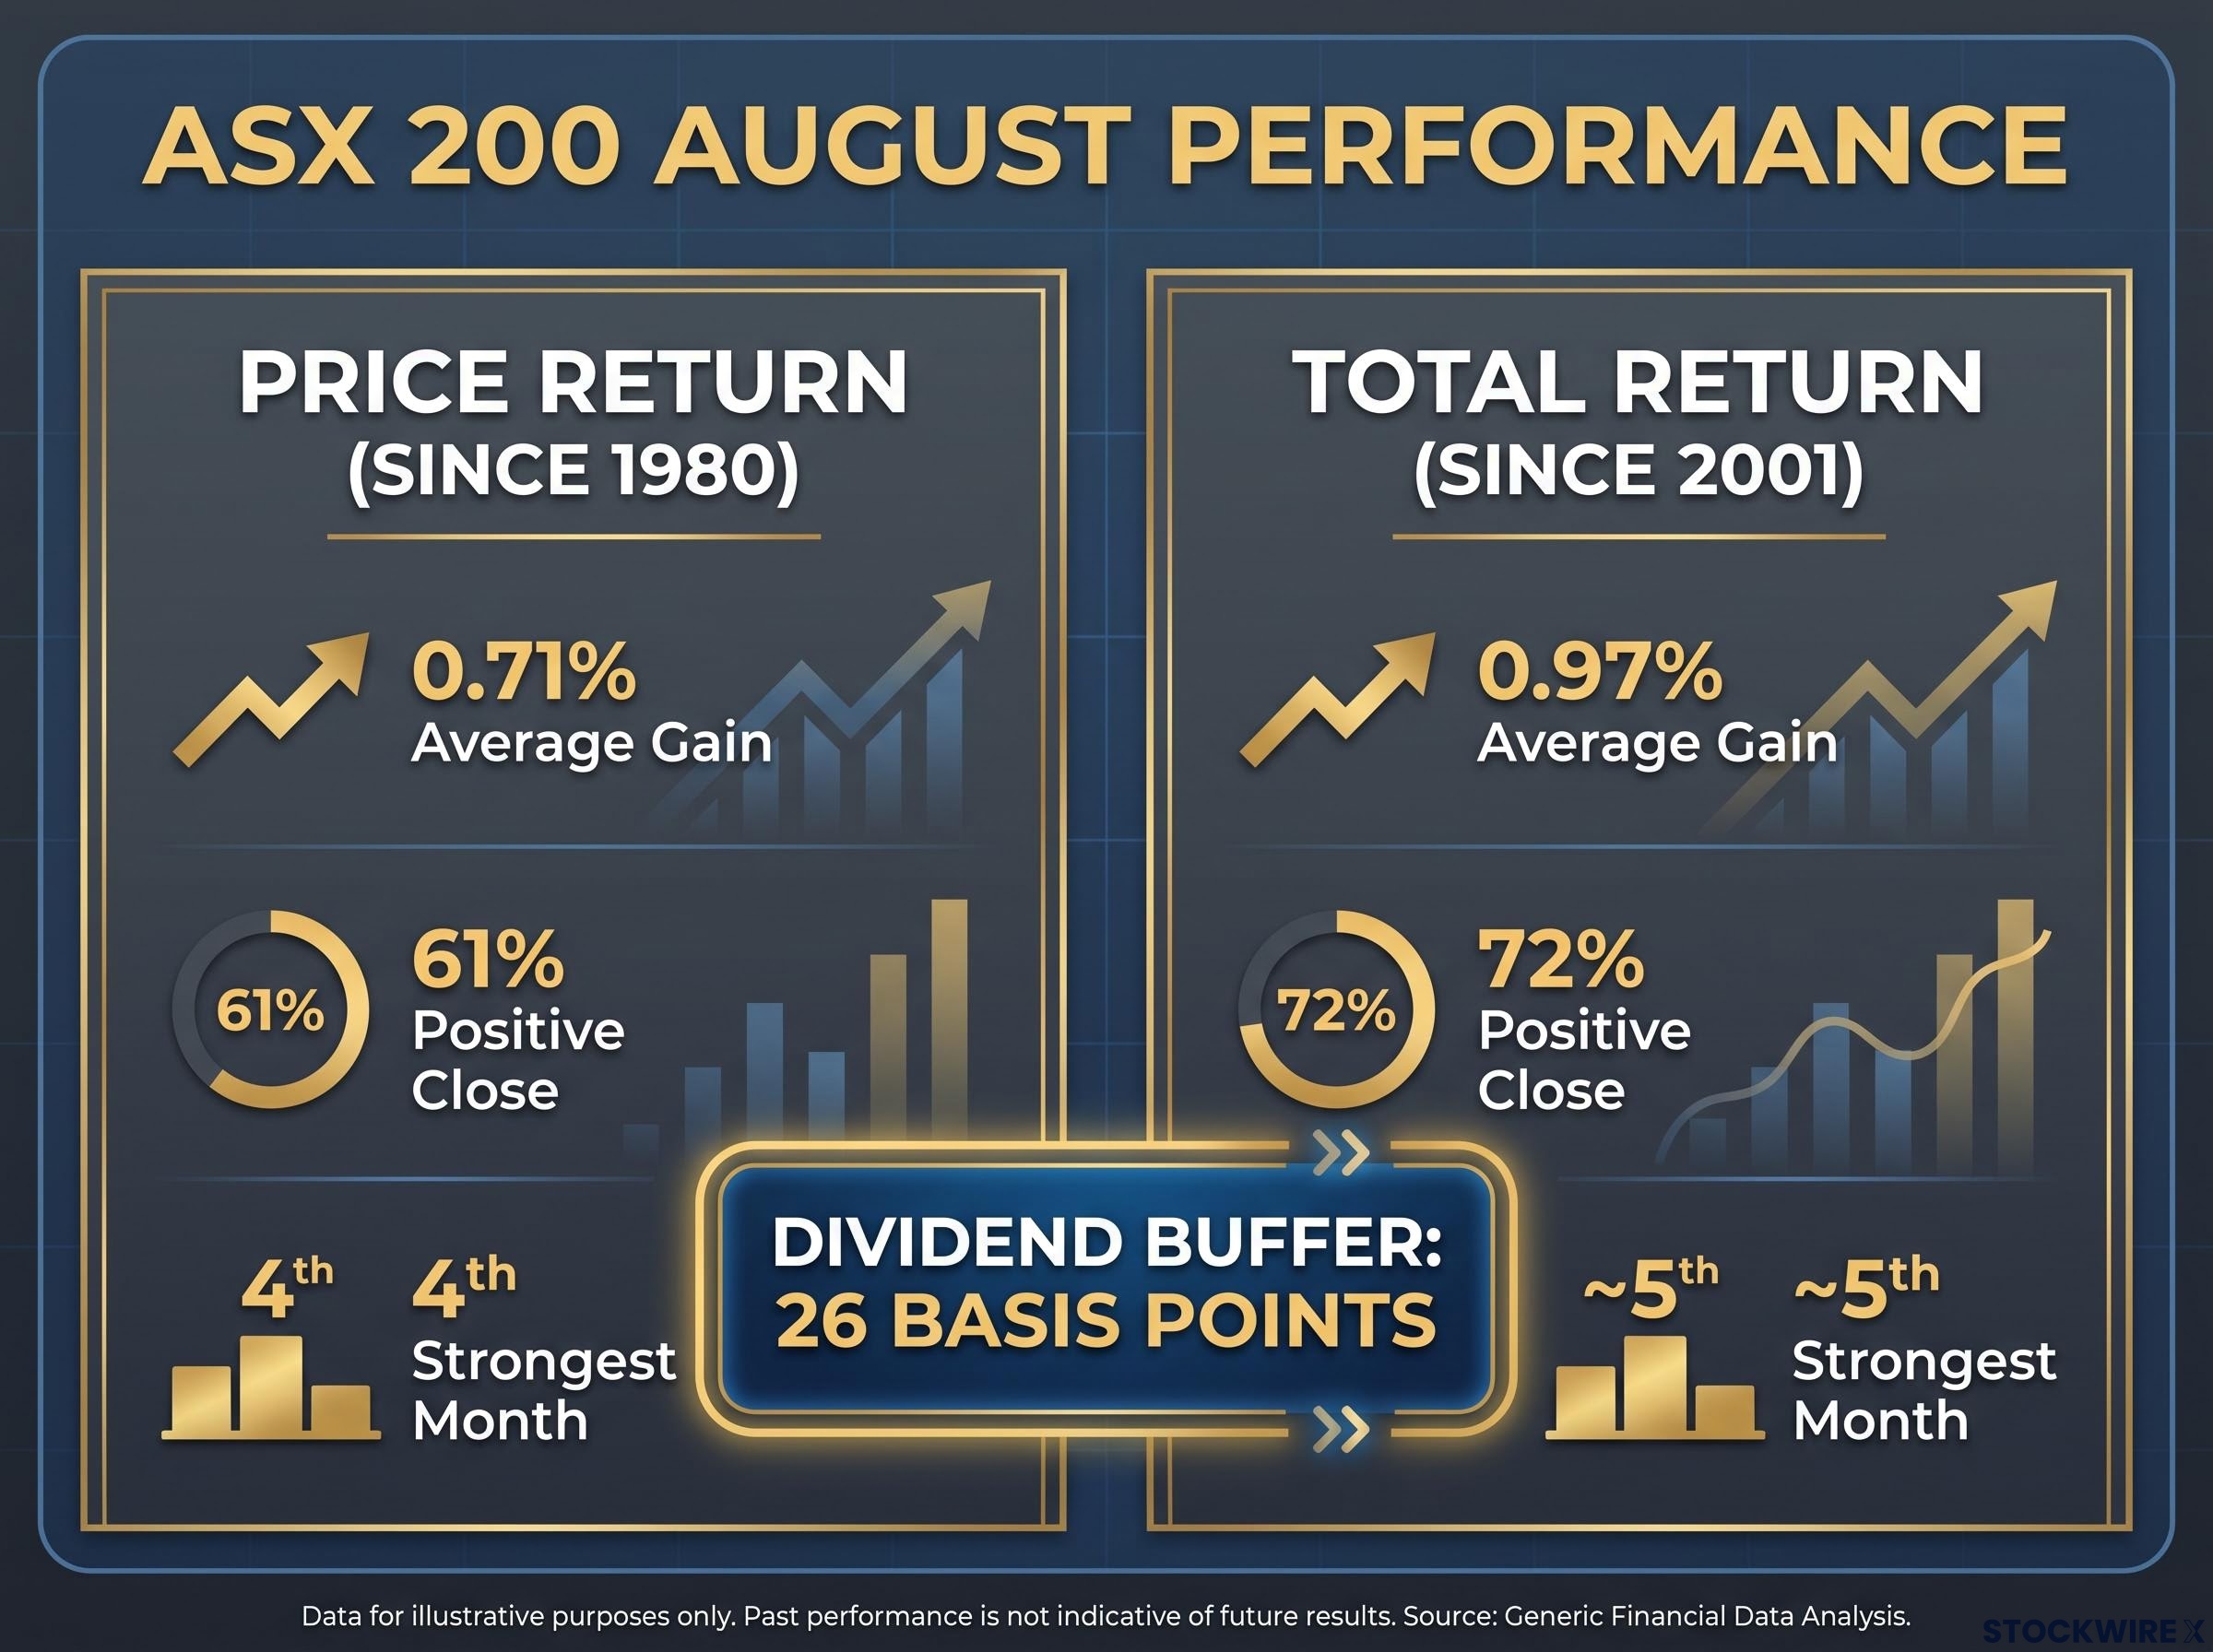
“Since 1980, the ASX 200 has averaged a 0.71% gain in August, closing higher in 61% of years.”
| Metric | Price return | Total return |
|---|---|---|
| Average August gain | 0.71% | 0.97% |
| Positive-close frequency | 61% | 72% |
| Calendar ranking | 4th strongest | ~5th strongest |
One more detail worth noting: according to Market Index data authored by Kerry Sun, cumulative gains from mid-August through mid-December have historically been close to zero, with most of the remaining annual upside arriving in the December Santa rally. That positions August as a transitional month, the last constructive window before a historically uneven stretch into spring.
July 2026 offers the immediate prior context. The index’s 2.26% monthly advance was built almost entirely on a three-session surge of 3.0% across 27-29 July, which lifted the index toward a five-month peak. Whether August can build on that momentum is the question the seasonal data alone cannot answer.
The July seasonal data provides the benchmark context for interpreting August’s starting point: the ASX 200 has closed higher in approximately 92% of the last 12 Julys, producing a mean return near 2.88%, which means August 2026 inherits a momentum condition that historically precedes the index’s most consequential reporting season month.
When big ASX news breaks, our subscribers know first
Why recent Augusts have broken from the long-run pattern
If you have been investing through the past several Augusts, the mild positive average may feel disconnected from your actual experience. That is because recent returns have been materially weaker than what the long-run numbers suggest.
The explanation is not some deterioration in the broader market environment. It is more specific than that.
What has changed
Each successive reporting season has brought sharper price swings than the one before. The major banks, miners, and industrials all release results in a concentrated window, and the market’s reactions to those results have grown sharper. The key mechanisms:
- Concentrated release window: A large share of index-weight companies report within the same two to three weeks, compressing the period in which earnings surprises can move the index.
- Larger earnings-day price reactions: Day-of-results moves of 5-10% have become a regular occurrence across the index, appearing even in large, traditionally stable names that once absorbed earnings news with little fanfare.
- Index-heavyweight amplification: When a major bank or miner drops 6-8% on a guidance downgrade, the index-level impact is immediate and disproportionate, enough to override the seasonal tailwind inside a single session.
ASX sector concentration in financials and materials, which together represent approximately 45% of the ASX 300, is the same structural characteristic that makes August earnings season so consequential: when the banks and miners that dominate the index report simultaneously, their combined index weight means a guidance downgrade from even one major name can override weeks of seasonal tailwind in a single session.
Why this is structurally persistent
In earlier decades, earnings-day reactions tended to be more contained. August performance tracked the underlying seasonal tendency more closely because the noise from individual company results was lower. The current environment is different: faster repricing of expectations, more algorithmic trading around results, and larger position adjustments in the hours after an announcement. That structural shift is not temporary.
ASX reporting season August 2026 arrives with an unusual tension: analysts are forecasting approximately 12% year-on-year earnings growth, the strongest collective result in nearly four years, yet investor sentiment has simultaneously collapsed to its most bearish reading in over a year, a disconnect that sharpens the asymmetry between upside surprises and downside misses.
What this means for you is that the historical average is not broken as a long-run reference point. But it is increasingly unreliable as a guide to any specific August. A handful of heavyweight earnings misses can wipe out the seasonal tailwind inside a week.
The dividend layer most price charts miss
August looks different depending on which lens you use, and for income investors, it looks materially better.
The source of the gap is straightforward. Many ASX-listed companies announce and pay final dividends alongside their full-year results, which concentrate in August. Ex-dividend dates cluster around reporting season, meaning income-oriented portfolios collect distributions precisely when price volatility is highest.
“For income investors collecting and reinvesting dividends, August has historically returned an average of 0.97%, positive in 72% of years.”
The distinction between price return (0.71%) and total return (0.97%) is not just a technical footnote. It changes which investors August is actually a good month for. Three reasons August is structurally attractive for income portfolios:
Dividend yield mechanics clarify why the price return and total return figures for August can diverge as significantly as the historical data shows: a share price falling on results day reduces the yield denominator and can simultaneously inflate the yield figure while the income component of total return holds firm, creating the impression of both poor performance and high income at the same time.
- Final dividend concentration: Full-year results trigger final dividend payments, clustering payouts in August more than in most other months.
- Ex-dividend clustering: Multiple large-cap names going ex-dividend within the same fortnight adds to total returns for investors holding through reporting season.
- Dividend buffer against price volatility: Even in years when price performance is flat or slightly negative, the income component can push total returns into positive territory.
For an investor running an income-oriented portfolio, this means the 0.97% total return average is the more relevant benchmark. The price chart alone can create a misleading impression of underperformance in a month that, for dividend-focused investors, has historically delivered more reliably than the headline numbers suggest.
What this means for positioning and risk management in August 2026
Seasonal context as background, not forecast
The historical data supports a mildly constructive bias. A 0.71-0.97% average gain and a 61-72% positive frequency are real, but they are probabilistic base rates. They tell you the wind has historically been at your back in August, not that it will be this month. July 2026’s 2.26% gain provides a constructive entry point, but that momentum can reverse quickly once reporting season is underway.
Reporting season risk management
Earnings-day swings in the 5-10% range have become a feature of reporting season across the index, and concentrated positions carry asymmetric risk that the historical average does not capture. If you hold a large position in a major bank or miner reporting this month, you are not just taking company risk. You are taking reporting-season-structure risk, where a single earnings miss that drops a stock 8% can also drag the index enough to compress weeks of patient positioning.
Four considerations for navigating the month:
- Treat August seasonality as a mild tailwind, not a forecast. The data is supportive but not strong enough to justify allocation shifts on its own.
- Size individual positions for 5-10% earnings-day moves. If you cannot absorb that range of outcomes on a single holding, the position is too large for reporting season.
- Recognise dividends as a genuine buffer. For income portfolios, the total return profile is materially more favourable than the price chart shows.
- Consider medium-term September-October softness when adding risk late in August. September and October are historically among the weaker months for the ASX 200, so aggressive late-month additions may face seasonal headwinds almost immediately.
Where August leaves investors heading into spring
The tension that runs through August’s record resolves into three layers, and all three matter for how you position from here.
- Historical positive bias: Mild and real. A 0.71-0.97% average gain with 61-72% positive frequency gives you a constructive starting point, not a strong conviction signal.
- Reporting season risk: The dominant variable. What the major banks, miners, and industrials report over the next few weeks will determine August’s outcome far more than any seasonal tendency. This is the layer where recent Augusts have diverged from the long-run average, and the structural reasons behind that divergence have not changed.
- Income buffer: Genuine for dividend-focused investors. The total return record is meaningfully better than the price record, and that distinction matters if your portfolio strategy prioritises income alongside capital appreciation.
The months that follow have historically tended to be softer, with September and October among the weaker points in the annual calendar. That makes the quality of this reporting season relevant not just for the month itself but for how confidently you carry positions into the back half of the year.
Fundamentals and earnings outcomes will shape the result. The seasonal data tells you the historical wind direction. It cannot tell you whether this month’s earnings releases will reinforce or override it.
This article is for informational purposes only and should not be considered financial advice. Investors should conduct their own research and consult with financial professionals before making investment decisions. Past performance does not guarantee future results. The historical figures above are best viewed as probabilistic background rather than a forecast for the weeks ahead.