ASX Sector Rotation: Why FY25 Leaders Became FY26’s Worst
1 hr ago
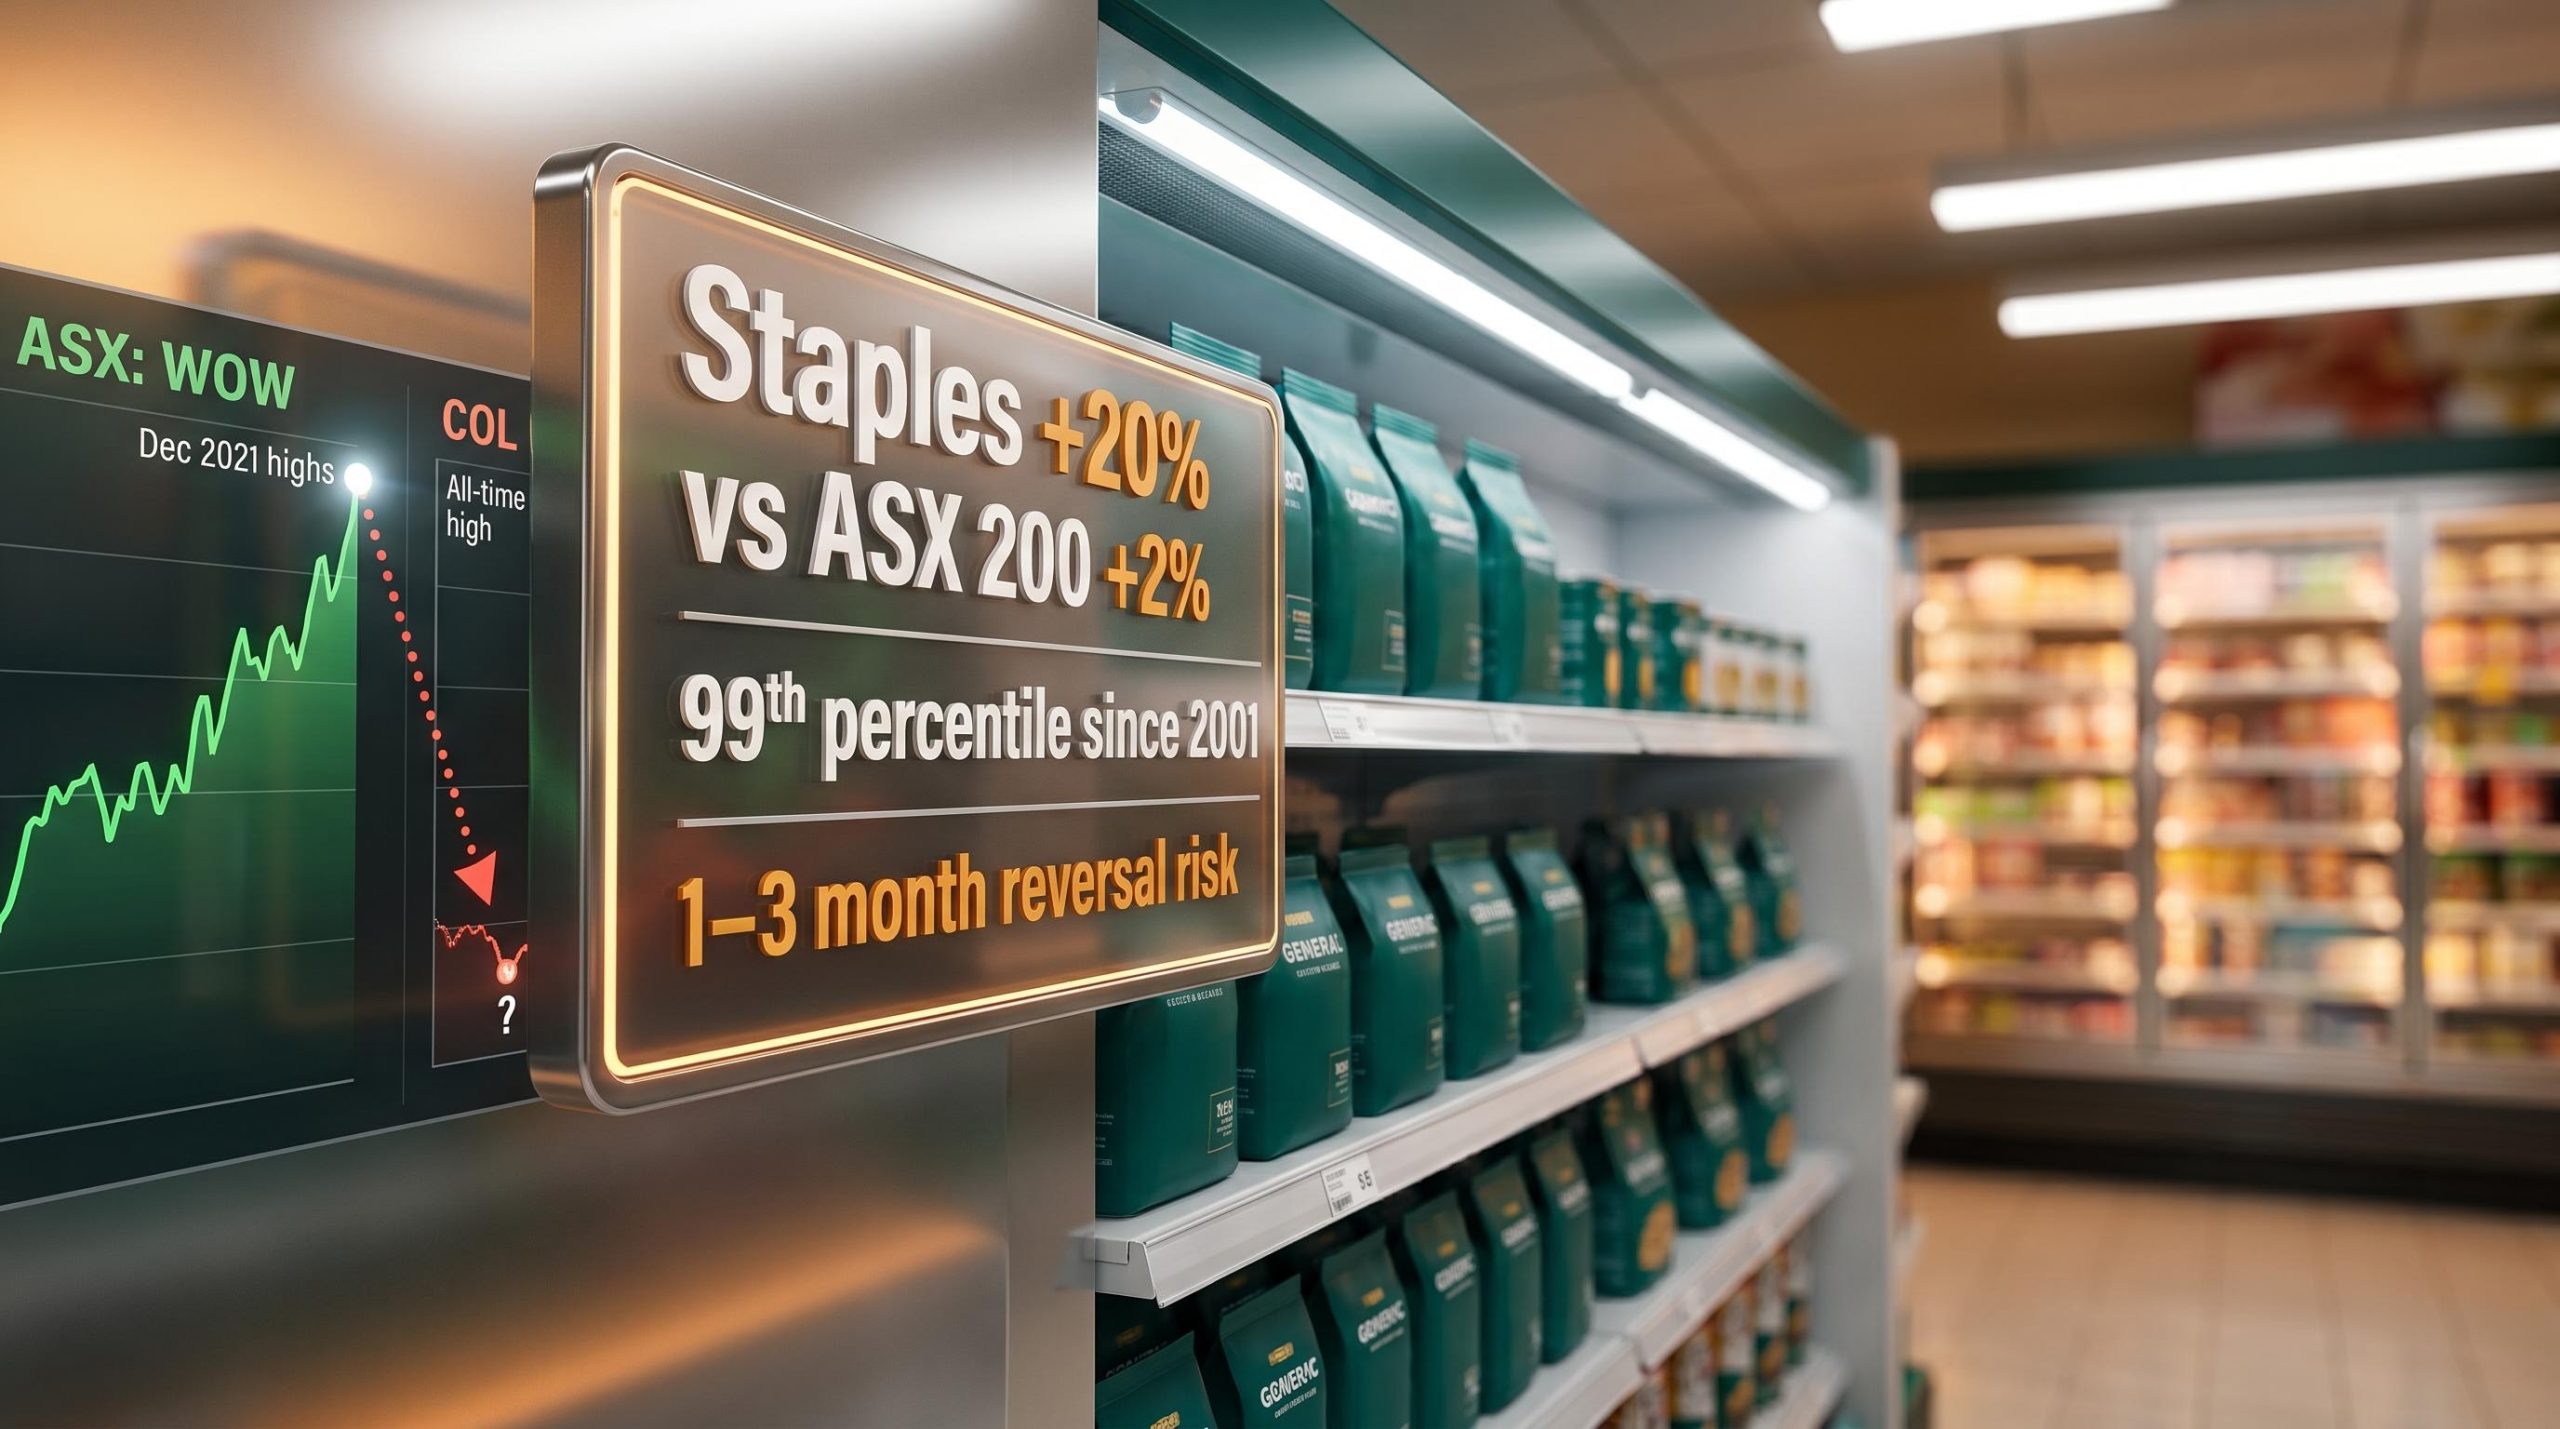
In just seven weeks, the ASX 200 Consumer Staples index has surged by roughly 20%, while the broader ASX 200 gained only about 2% across the same period. The resulting spread has climbed to the 99th percentile of all readings going back to 2001. The sole episode that produced a wider gap was the March 2020 pandemic selloff, which generated a spread of approximately 26 percentage points.
But that was a defensive rotation during a market crash. The current move belongs to a rarer, structurally different category, one where staples surge while the broader market stays positive. That distinction matters more than the headline number.
Here is what the historical data actually shows after moments like this, broken into the two regimes that define the dataset, so you can assess whether holding, adding, or reducing your ASX consumer staples exposure makes sense right now.
The scale of the Consumer Staples rally is worth grounding in specific numbers before any interpretation:
The rally lifted individual names sharply: Woolworths (ASX: WOW) traded back to levels not seen since December 2021, while Coles (ASX: COL) pushed through to an all-time price high.
The structural context behind the current spike matters here: staples sector underperformance over the five years to 2026 averaged -1.17% annually against +4.21% for the broader ASX 200, meaning the sector was deeply out of favour before this rally began and the re-rating may carry a catch-up component that complicates pure mean reversion assumptions.
The March 2020 spread of approximately 26 percentage points remains the only recorded reading larger than the current episode. That spike came during a full-scale market crash. The current one arrived with the ASX 200 in positive territory, making it structurally different and, in some respects, harder to explain away as temporary.
This is not background noise. Across 25 years of data, readings above the 95th percentile have occurred roughly once per year. The current reading clears that threshold by a wide margin, placing it in genuinely rare territory. That makes this a decision point, not a data point to file away.
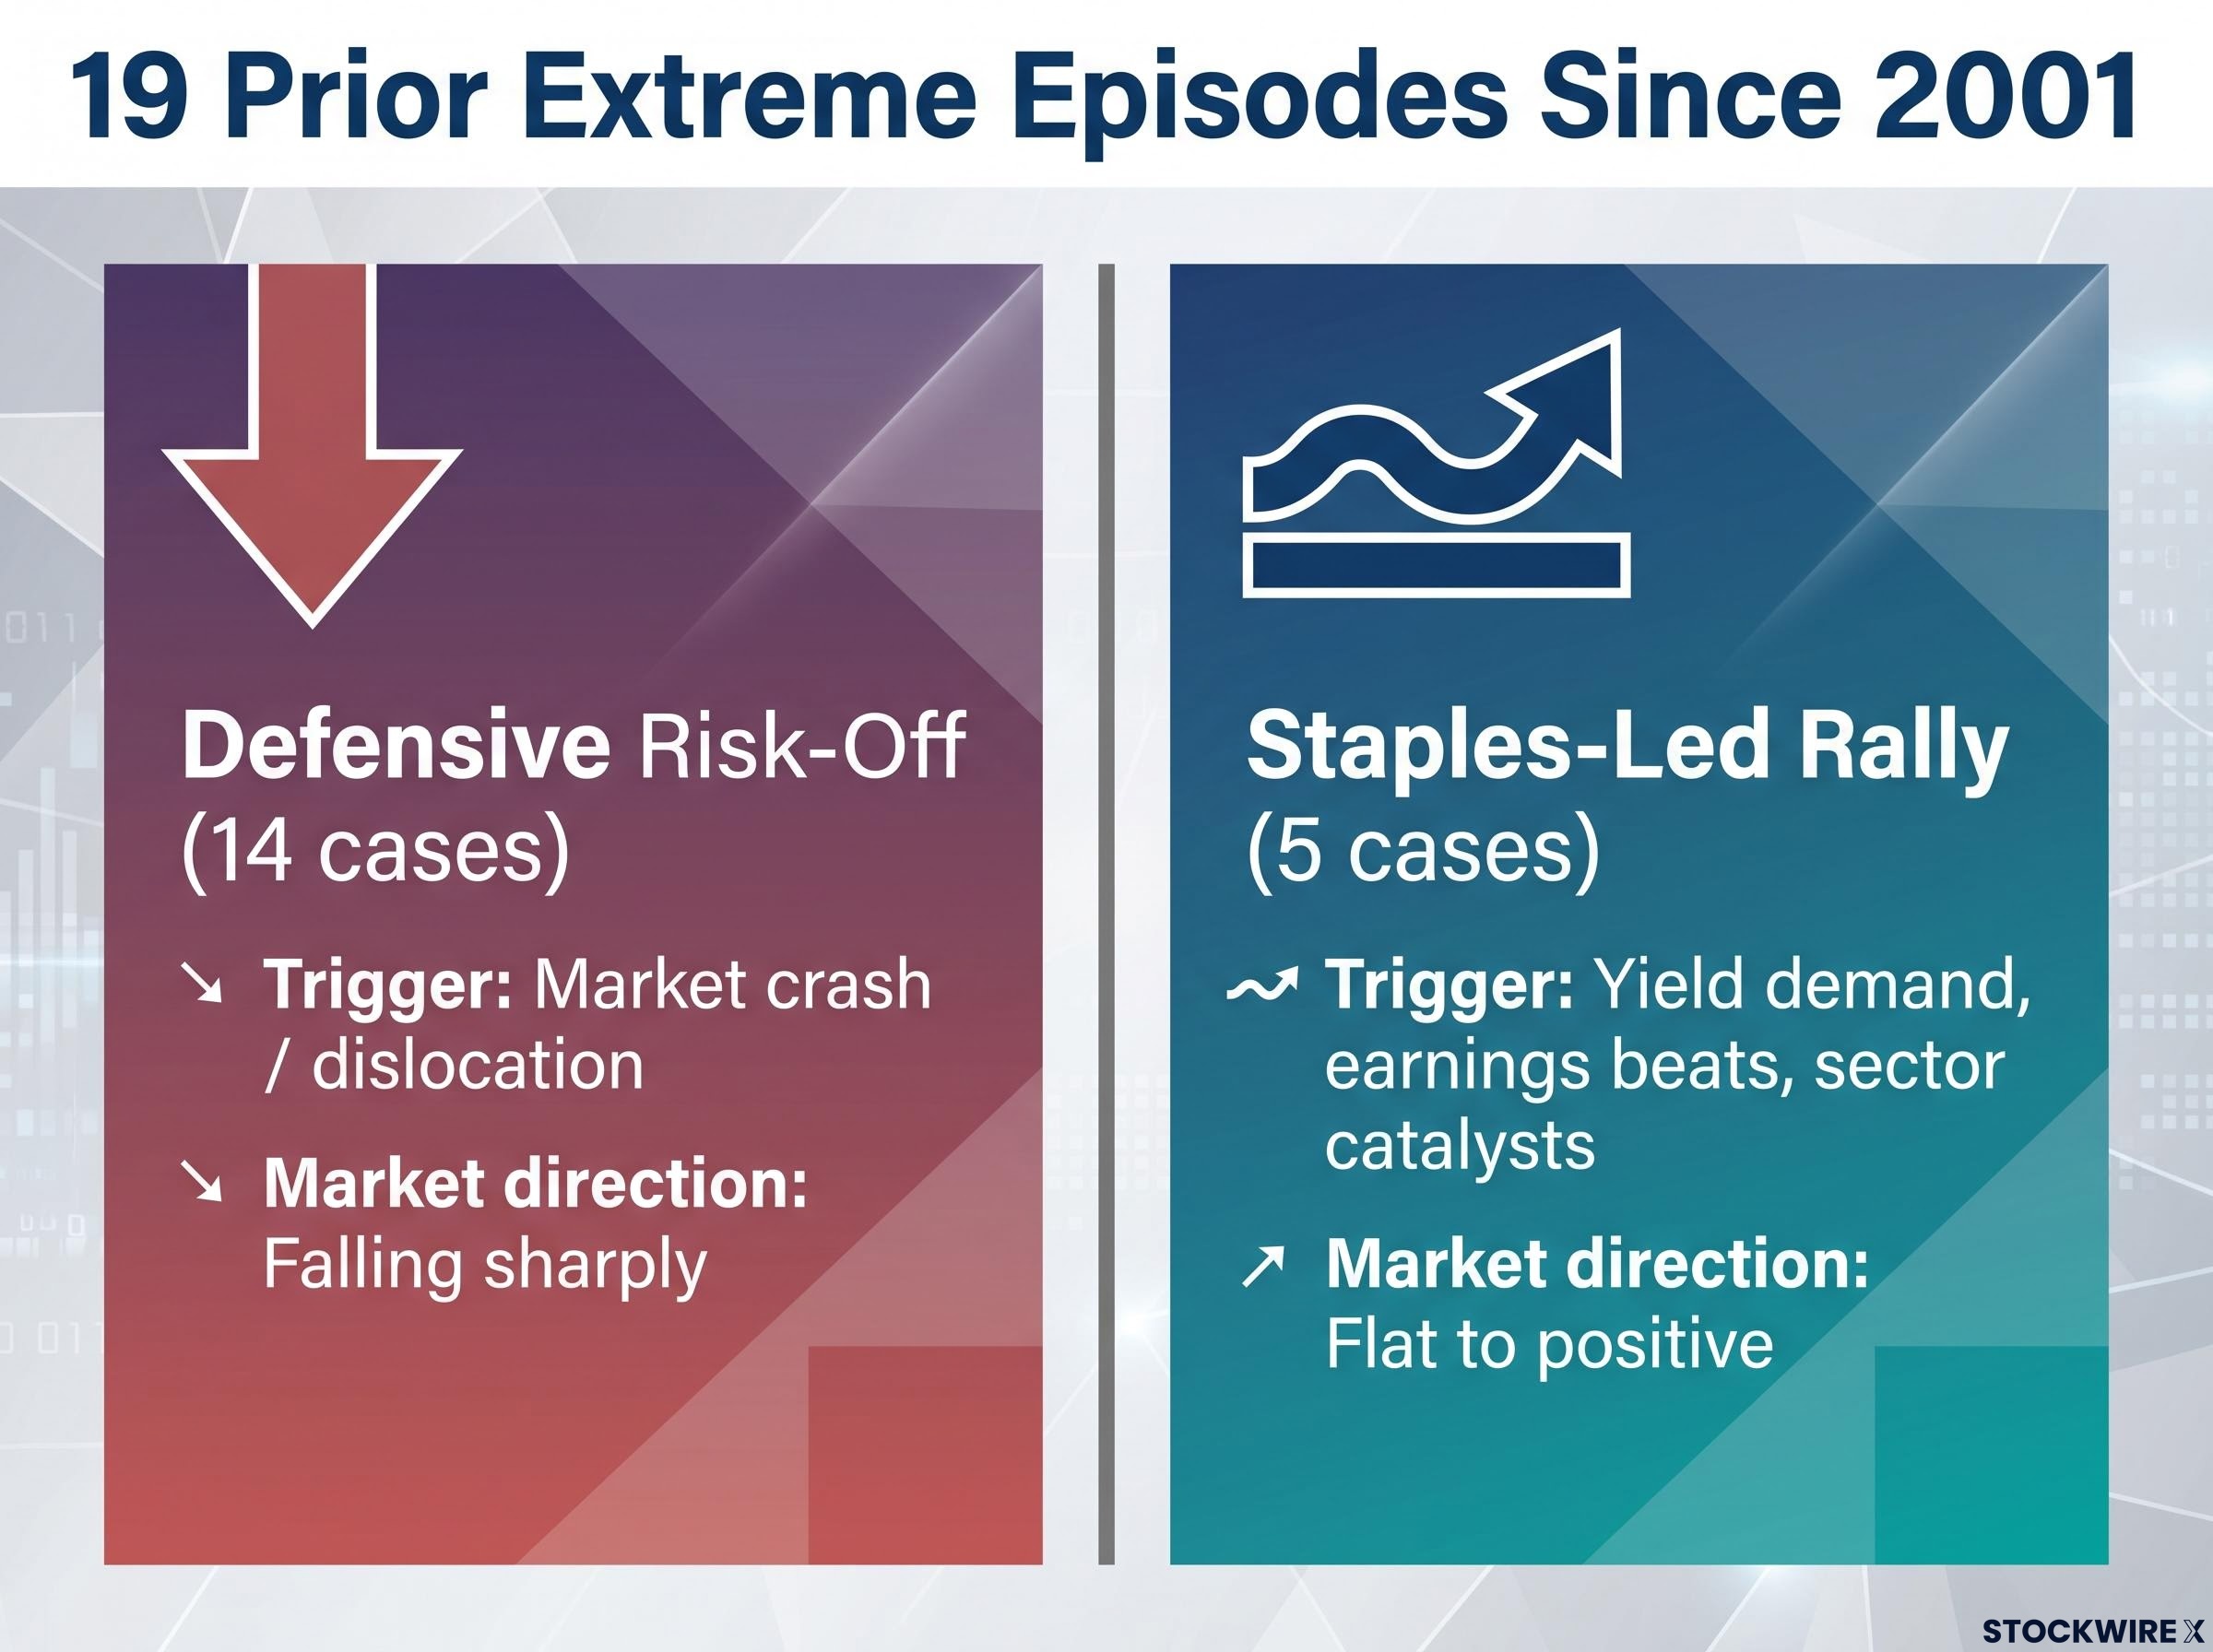
Treating all 19 prior extreme episodes as a single group produces misleading conclusions. The dataset splits into two distinct regimes, and correctly identifying which one applies to the current moment changes the forward return picture entirely.
| Regime | Trigger type | Prior count | Broader market direction | Representative episodes |
|---|---|---|---|---|
| Defensive Risk-Off | Market crash / dislocation | 14 | Falling sharply | 2008 GFC, 2020 pandemic, April 2025 tariff shock |
| Staples-Led Rally | Yield demand, earnings beats, sector catalysts | 5 | Flat to positive | Sep 2006, Sep 2012, Mar 2013, two in 2019 |
The more common pattern is straightforward. Broad market losses trigger a flight to earnings stability, with staples holding their ground while the rest of the index slides. This pattern accounts for 14 of the 19 prior episodes and maps onto the major dislocations you would expect: the 2002 dot-com trough, the 2008 global financial crisis, the 2011 European debt crisis, the 2016 Chinese currency devaluation, the 2020 pandemic, the 2022-23 rate tightening cycle, and the April 2025 tariff shock.
The mechanism is fear. The reversal, when it comes, is sharp.
The rarer pattern looks different at every level. Here, the index is broadly flat to positive, yet staples move higher in absolute terms, propelled by yield-seeking flows, merger and acquisition speculation, regulatory tailwinds, or earnings outcomes that justify a re-rating on their own merits. This set covers only five of the prior 19 episodes: September 2006, September 2012, March 2013, and two separate occasions in 2019.
The current episode belongs here. The ASX 200 is positive, not falling. That classification carries meaningfully different forward return expectations, and conflating it with a panic rotation would point you toward the wrong probabilistic framework.
The historical record separates cleanly by regime and by time horizon. The pattern emerges most clearly when the data is laid out rather than summarised.
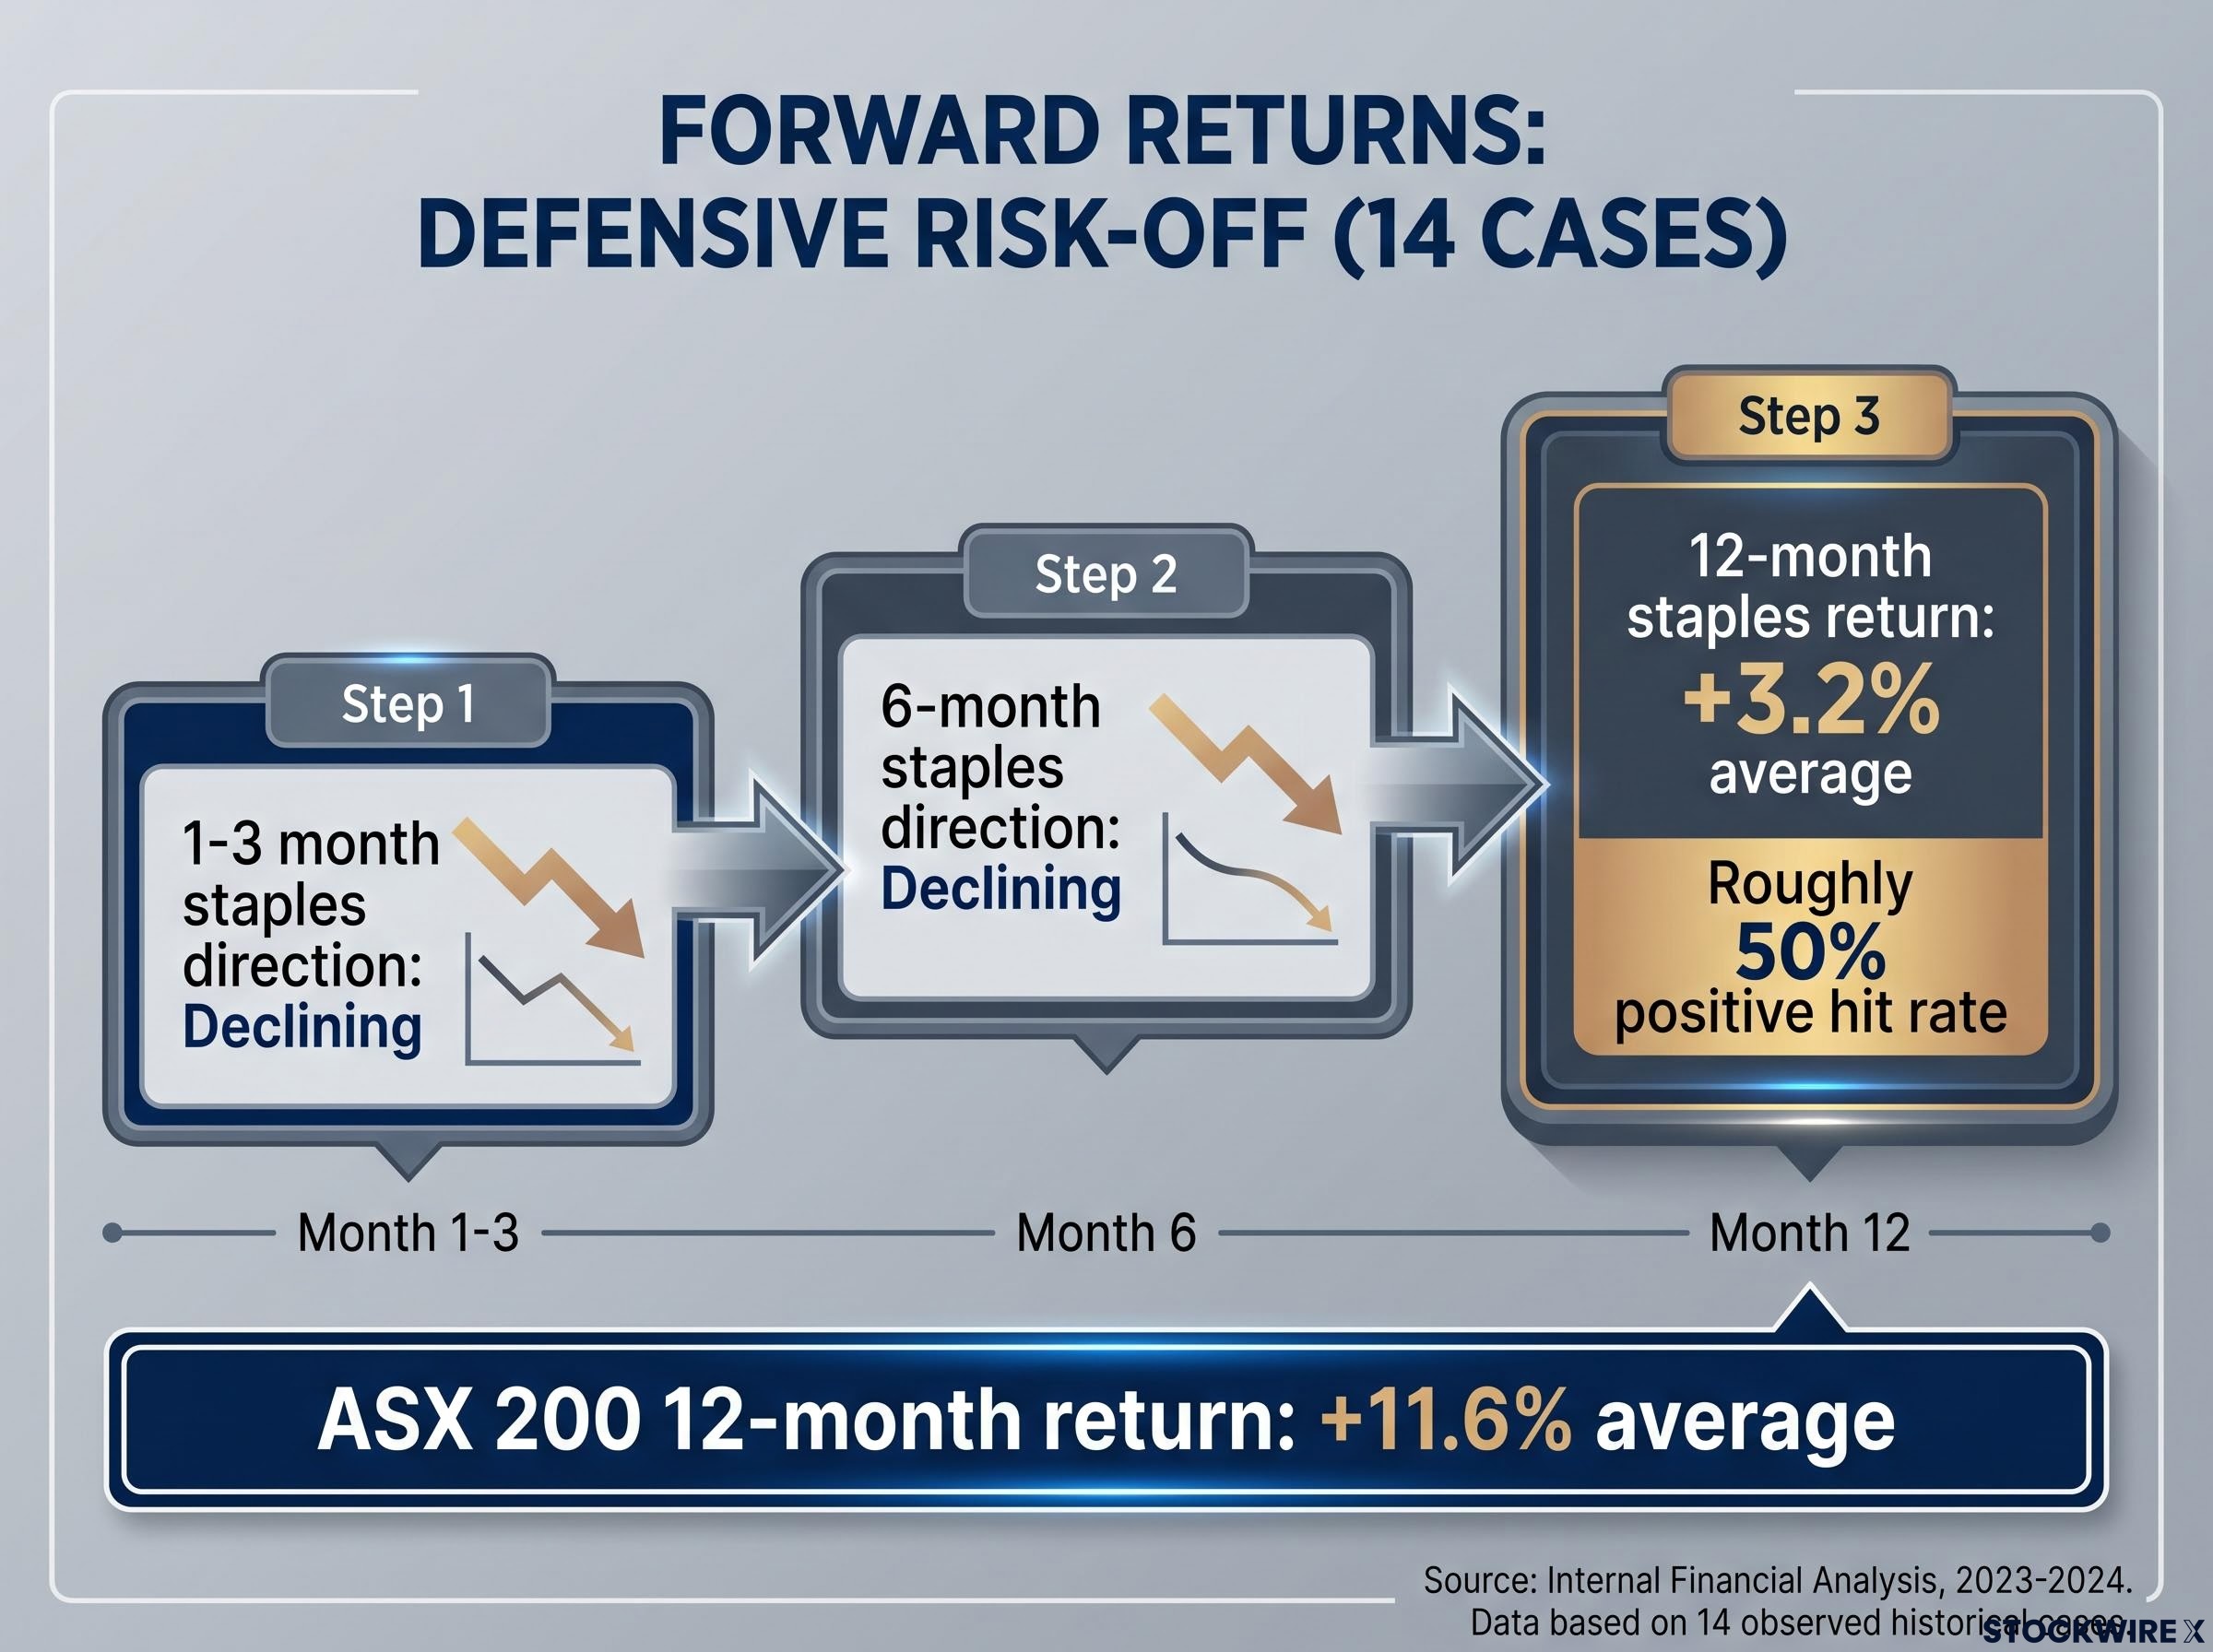
Following the 14 defensive risk-off episodes, the ASX 200 staged a strong recovery on average, posting a 5.1% gain over three months and 11.6% across the following twelve months. The Staples index, by contrast, declined through the one-to-six month period as capital cycled back into cyclicals and higher-beta names, finishing the twelve-month window with an average gain of just 3.2% and a positive outcome in only roughly 50% of cases.
A 50% positive hit rate at twelve months after defensive episodes reframes the “safe haven” narrative. In half of all cases, holding staples through the post-spike period produced a negative outcome over the following year.
In the 5 staples-led rally episodes (the category analogous to the current move), both the index and the staples sector faced headwinds in the near term, with weakness concentrated in the first one to three months. The sector edged toward modest relative recovery by the six-month point, while twelve-month results varied considerably across the small sample.
| Regime | 1-3 month staples direction | 6-month staples direction | 12-month staples return | ASX 200 12-month return |
|---|---|---|---|---|
| Defensive Risk-Off (14 cases) | Declining | Declining | +3.2% average | +11.6% average |
| Staples-Led Rally (5 cases) | Struggling | Slight relative recovery | Mixed | Mixed |
The shared finding across both regimes is clear: the 1-3 month window post-spike has been the most consistent period of staples underperformance or outright weakness. If you are sitting in staples positions today, that is the window where the historical odds tilt most firmly against you on a relative basis.
Knowing this episode belongs to the staples-led category does not remove the mean reversion risk. It changes the likely shape of the reversal.
Defensive unwinds snap back. When fear drove the original rotation, the abatement of fear drives the reversal, and capital exits staples quickly as risk appetite returns. Staples-led rallies fade more gradually. The move was partially driven by genuine fundamentals, whether earnings surprises, yield appeal, or sector catalysts, which means the stretched valuation reprices slowly rather than collapsing.
The difference in reversal dynamics:
There is also an institutional flow argument. If rate cut expectations, yield demand, or macro hedging drove the current move, much of that institutional repositioning is likely already expressed in the price. The buyers who were going to buy have largely bought. Incremental upside from here requires new fundamental or macro surprises, not continuation of the existing narrative.
Woolworths and Coles may have independent justifications for their current prices. Margin improvement, earnings revisions, and competitive positioning are company-level drivers that the sector-level data does not capture.
Regulatory risk for Woolworths and Coles has become a structural feature rather than a cyclical overhang since the ACCC supermarket inquiry, with legislation effective July 2026 adding compliance costs and potential margin drag that may not appear immediately in reported earnings and therefore may not be fully captured in current valuations.
The historical caution applies to the staples basket as a whole. If you hold WOW or COL specifically, the right question is whether their individual earnings and margin trajectories support the current valuation, not whether the sector momentum will continue.
For investors wanting to build a structured framework for evaluating WOW and COL on their own earnings trajectories, our dedicated guide to ASX share valuation methods covers the five-step sequence from P/S screening through DCF and dividend discount modelling, with specific guidance on how franking credits affect intrinsic value estimates for Australian resident investors.
The historical evidence translates into three distinct positions. Locate yourself in the one that fits.
The 1-3 month window is the primary risk period, drawn from the historical pattern across both regimes. This is the specific timeframe where mean reversion has been most consistent, and it applies whether you classify the current episode as defensive or staples-led.
A five-case analogous sample is suggestive, not definitive. Weight it accordingly. This is a probability tool, not a rulebook.
Across 25 years and two structural regimes, extreme staples outperformance has consistently been followed by mean reversion. The 1-3 month window has been the most reliable period of underperformance. The current staples-led classification moderates but does not remove that risk.
The honest limits of a five-case analogous sample deserve acknowledgement. The pattern is directionally consistent, and the broader 19-episode dataset reinforces the mean reversion tendency. But five data points do not constitute a high-confidence statistical guarantee.
Three variables could alter the base case from here:
The RBA tightening trajectory diverges sharply from the Fed, ECB, and Bank of England, which all held rates steady in the same week the RBA raised to 4.35%, a divergence that affects the yield differential driving Australian defensive equity demand and has direct implications for how quickly rate cut expectations could reverse the current institutional positioning in staples.
The six-month mark is where the risk-reward picture in prior staples-led episodes began to stabilise, conditional on fundamentals holding. Disciplined caution at statistical extremes is not pessimism about staples; it is a probabilistically sound response to a dataset that has consistently rewarded patience over momentum-chasing in the months immediately following these spikes.
This article is for informational purposes only and should not be considered financial advice. Investors should conduct their own research and consult with financial professionals before making investment decisions. Past performance does not guarantee future results. Forward return data is drawn from a limited historical sample and is subject to change based on market developments and macroeconomic conditions.
The ASX consumer staples sector groups companies that produce or sell essential everyday goods, including supermarket giants Woolworths (ASX: WOW) and Coles (ASX: COL), which are the most prominent names in the current rally.
The 20% gain in roughly seven weeks reflects a combination of yield-seeking institutional flows, earnings re-ratings, and a catch-up component after five years of average annual underperformance of 1.17% against the broader ASX 200, rather than a panic-driven flight to safety.
Across 19 prior episodes since 2001 where the spread hit the 95th percentile, the 1-3 month window after the spike has been the most consistent period of staples underperformance or outright weakness across both defensive and staples-led regimes.
A defensive crash rotation occurs when a falling broader market pushes investors into staples as a safe haven, accounting for 14 of the 19 prior extreme episodes; a staples-led rally occurs when the broader market is flat to positive but staples surge on their own fundamentals, which is the pattern the current episode fits.
Rate cut expectations increase yield demand for defensive sectors like consumer staples, and an unexpected acceleration in RBA cuts could extend the current rally, while any reversal of those expectations would likely remove a key pillar of institutional support for the sector.