Why the US-Iran Deal Won’t Cut Oil Prices Overnight
2 hrs ago

Macquarie Group shares hit a fresh record high of $250.78 on 17 June 2026, capping a 23% year-to-date run that has compressed the stock’s trailing dividend yield to just 2.81%, below every one of the ASX’s four major banks. That compression raises a direct question for income-focused ASX investors: does MQG still belong in a yield-driven portfolio, or has its growth story finally outrun its income credentials? The question is sharpened by Macquarie’s partial franking structure, which reduces the effective after-tax value of its dividends relative to fully franked bank alternatives.
What follows is an analysis of Macquarie’s current yield, its five-year dividend track record, the real cost of partial franking for Australian investors, and how MQG stacks up against the major banks on income measures. The aim is a clear-eyed verdict on which type of investor Macquarie actually suits at current prices.
A rising share price is good news for shareholders who already own it. For prospective income buyers, the maths runs the other way: the higher the entry price, the lower the yield on every dollar invested. At approximately $248.97-$248.99 as of 17 June 2026, with an intraday record of $250.78, Macquarie’s trailing dividend yield sits at 2.81% based on two recent payments totalling $7.00 per share.
That 2.81% figure is the conservative end of what investors will encounter across data providers. Independent services report yields of 2.9-3.0%, and some providers using franking-weighted or alternative rolling-period methodologies show figures as high as 3.5%.
The gap between 2.81% and 3.5% is not a rounding error. It reflects genuinely different calculation methodologies, and the difference matters when comparing Macquarie’s yield against the major banks. Using the conservative trailing figure provides the most honest baseline.
Forward-looking estimates paint a somewhat different picture. Analyst consensus points to an approximate forward yield of 3.6-3.8%, reflecting expected dividend growth in FY2027. That distinction, between what Macquarie has paid and what it is forecast to pay, is where the income story gets more nuanced.
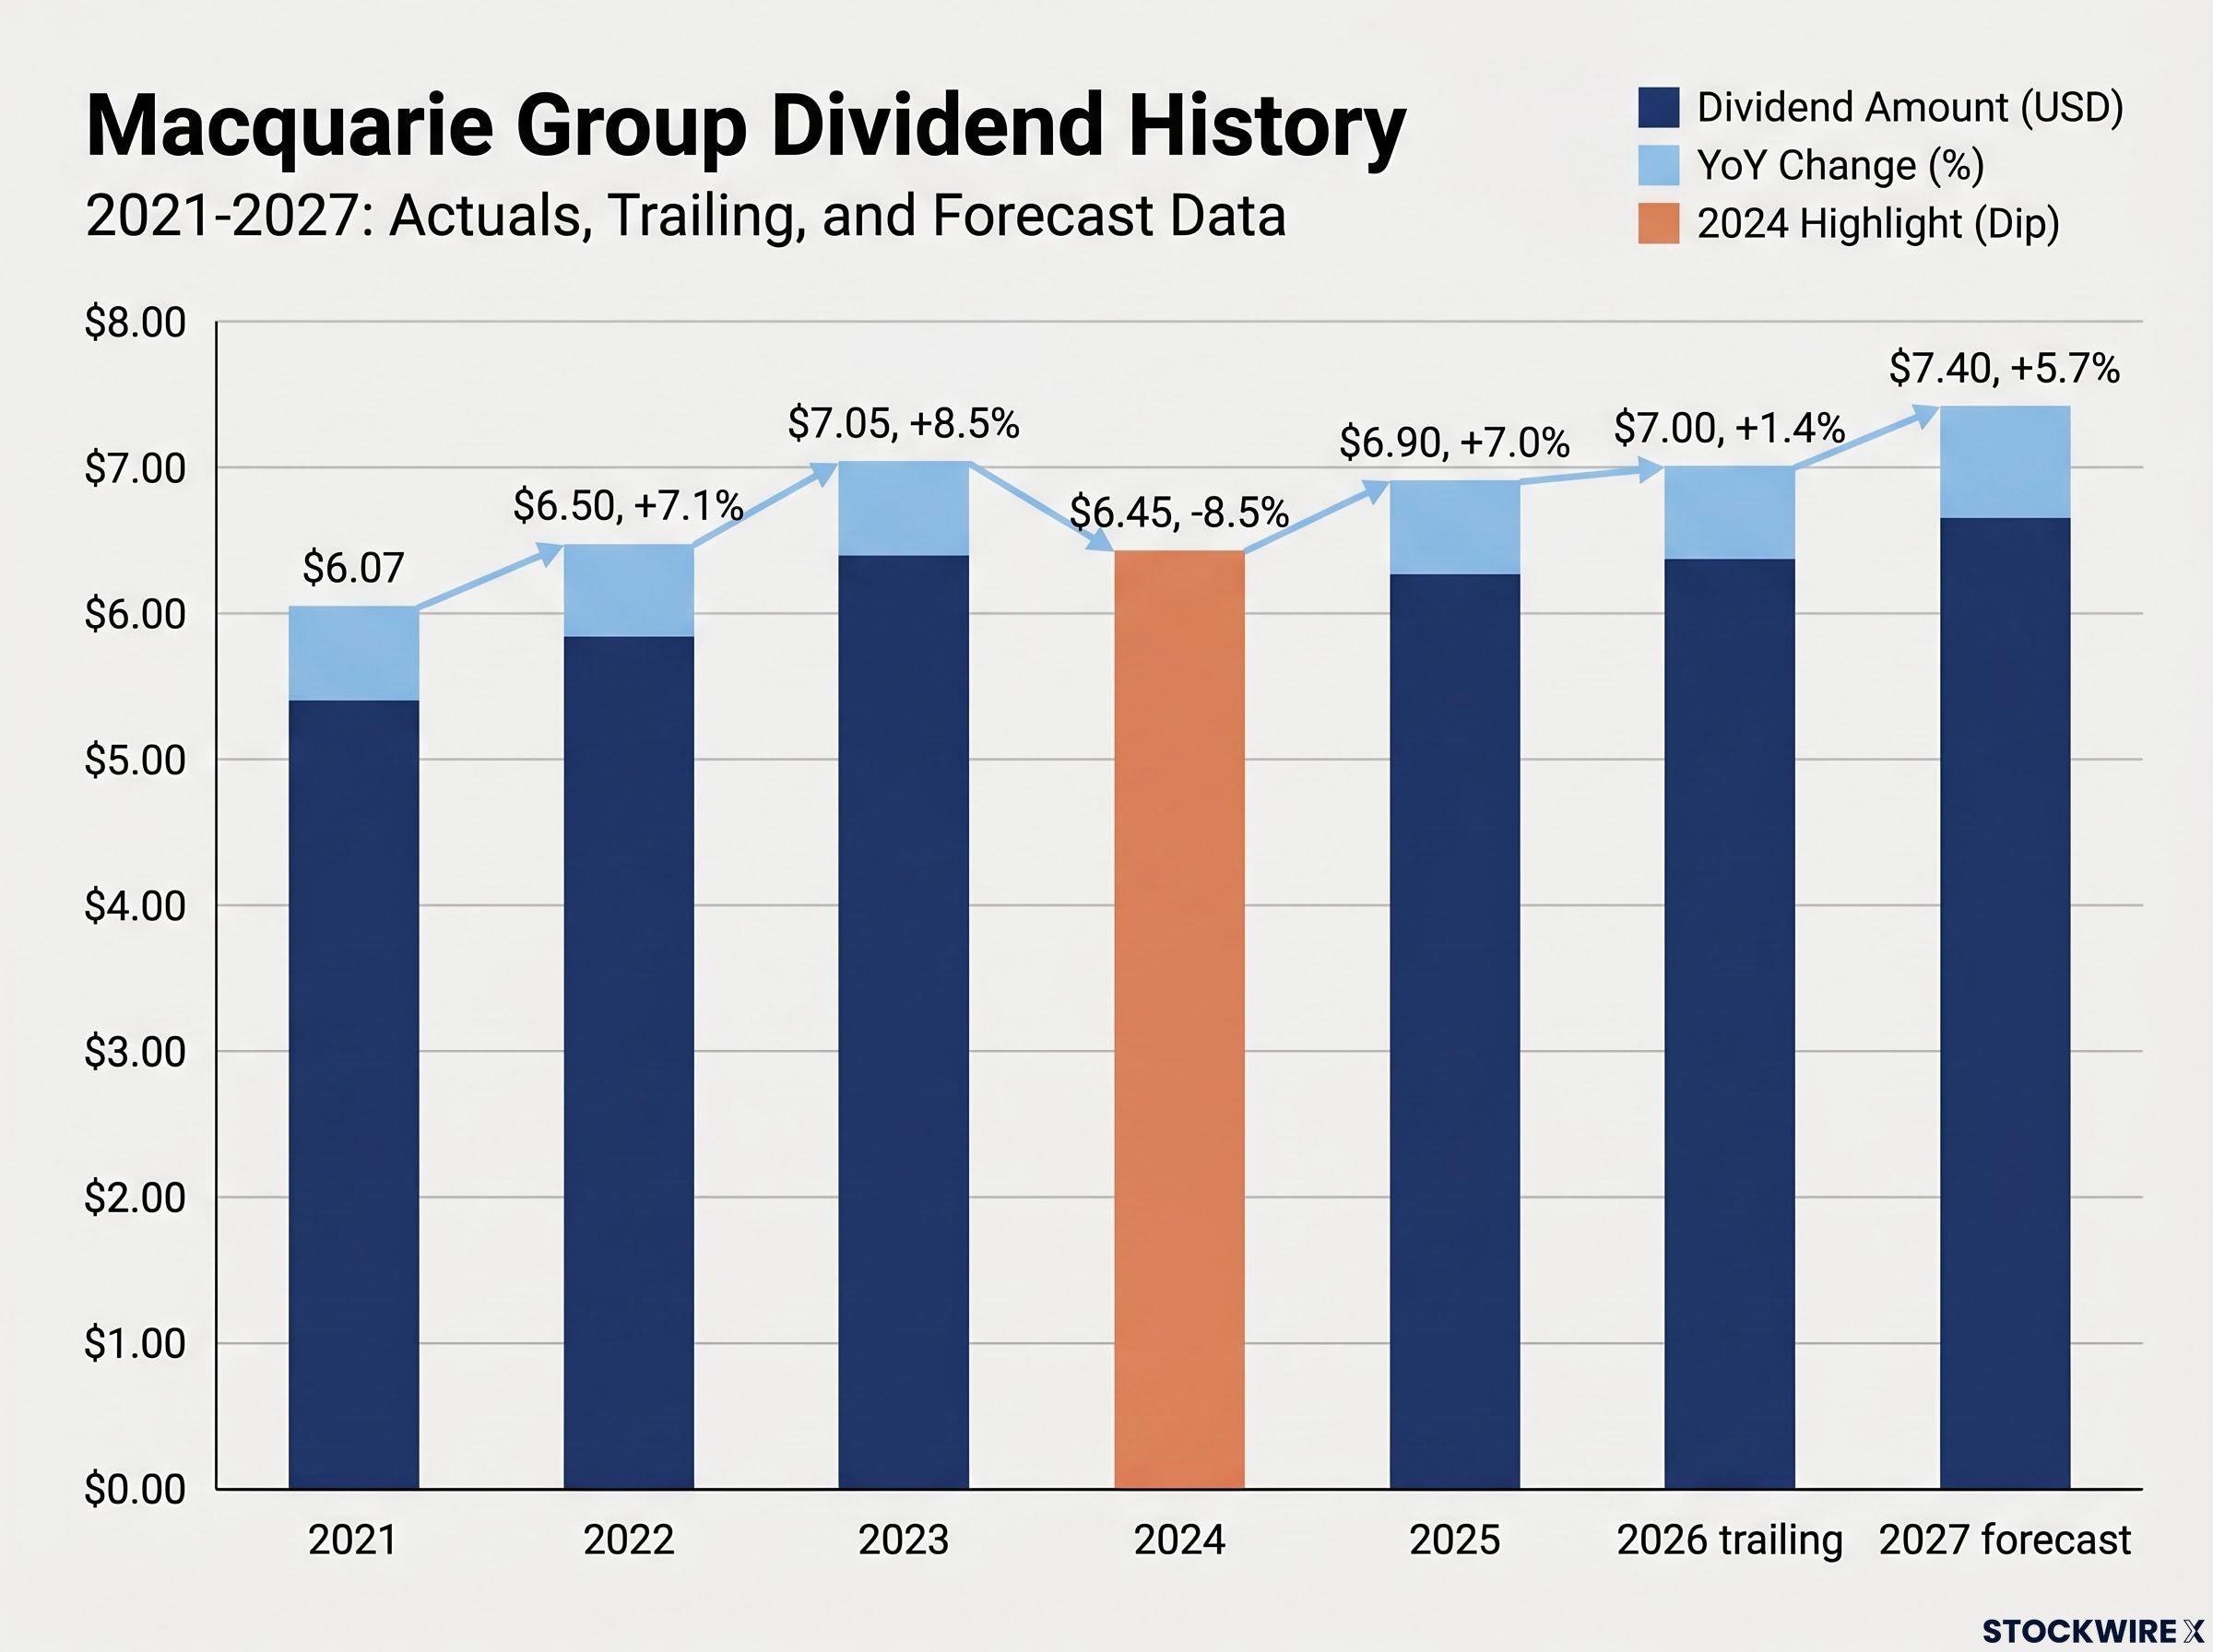
The numbers over six financial years tell their own story before any characterisation is needed.
| Year | Annual Dividend Per Share | Year-on-Year Change |
|---|---|---|
| 2021 | $6.07 | — |
| 2022 | $6.50 | +7.1% |
| 2023 | $7.05 | +8.5% |
| 2024 | $6.45 | –8.5% |
| 2025 | $6.90 | +7.0% |
| 2026 (trailing) | $7.00 | +1.4% |
| 2027 (forecast) | $7.40 | +5.7% |
The 2024 drop from $7.05 to $6.45 is the detail that matters most. Macquarie does not manage dividends to a progressive-growth model the way the domestic retail banks tend to. When global markets activity dips, so does the payout. When it recovers, the dividend follows. Investors building income forecasts around MQG need to price in that variability rather than extrapolate a growth trend.
Macquarie targets an ordinary dividend payout ratio of 50-70% of net earnings. In practice, recent payouts have landed in the mid-50s percentage range, consistently below the upper end of the stated band.
That gap is deliberate. A payout ratio in the mid-50s means Macquarie is retaining close to half its earnings for reinvestment across its global platform. Dividends are a secondary benefit of the earnings, not the primary claim. For investors comparing MQG to a bank paying out 70-80% of earnings, the capital allocation philosophy is fundamentally different.
A surface-level comparison of dividend yields assumes a dollar of income is a dollar of income regardless of the source. In Australia, that assumption is wrong. The dividend imputation system means that franking credits, which represent corporate tax already paid by the company, can offset an investor’s personal tax liability. When a dividend is fully franked, the investor receives the cash payment plus a credit for the full corporate tax rate. When it is only partially franked, the credit is smaller.
The difference between a 2.81% cash yield and the effective after-tax yield depends entirely on grossed-up dividend calculations, where the 30/70 formula converts a partially franked payment into a comparable after-tax figure; at 35% franking, Macquarie’s credits cover only a fraction of what fully franked bank dividends deliver to the same investor.
Macquarie’s dividends carry franking of 35%, and the rate has ranged between 35-40% across recent financial years. The reason is structural, not discretionary: a large proportion of Macquarie’s profits are earned offshore, and Australian imputation rules only permit franking credits to the extent that Australian corporate tax has been paid. International earnings generate no credits.
For SMSF trustees and retirees who can fully utilise franking credits, the gap between 35% and 100% franked is not a technical footnote. It directly reduces the effective after-tax yield of Macquarie’s dividends. The same cash yield is worth materially more after tax when fully franked, and this difference is most significant for investors in accumulation-phase or pension-phase superannuation.
Individual investors at typical marginal tax rates also feel the gap, though the impact scales with the tax bracket. For any Australian investor who structures a portfolio around maximising franking credits, Macquarie’s partial franking is a genuine cost, not an abstraction.
The comparison is not about which stock is better. It is about which stock is better suited to a specific objective.
Two ways to frame the decision:
Investors who pivot to the major banks for higher grossed-up income should not assume that dividend sustainability across the major banks is uniform; Morgans’ April 2026 analysis flagged ANZ and Westpac as carrying elevated payout ratio risk, with both sitting above their own stated target ranges ahead of the May results season.
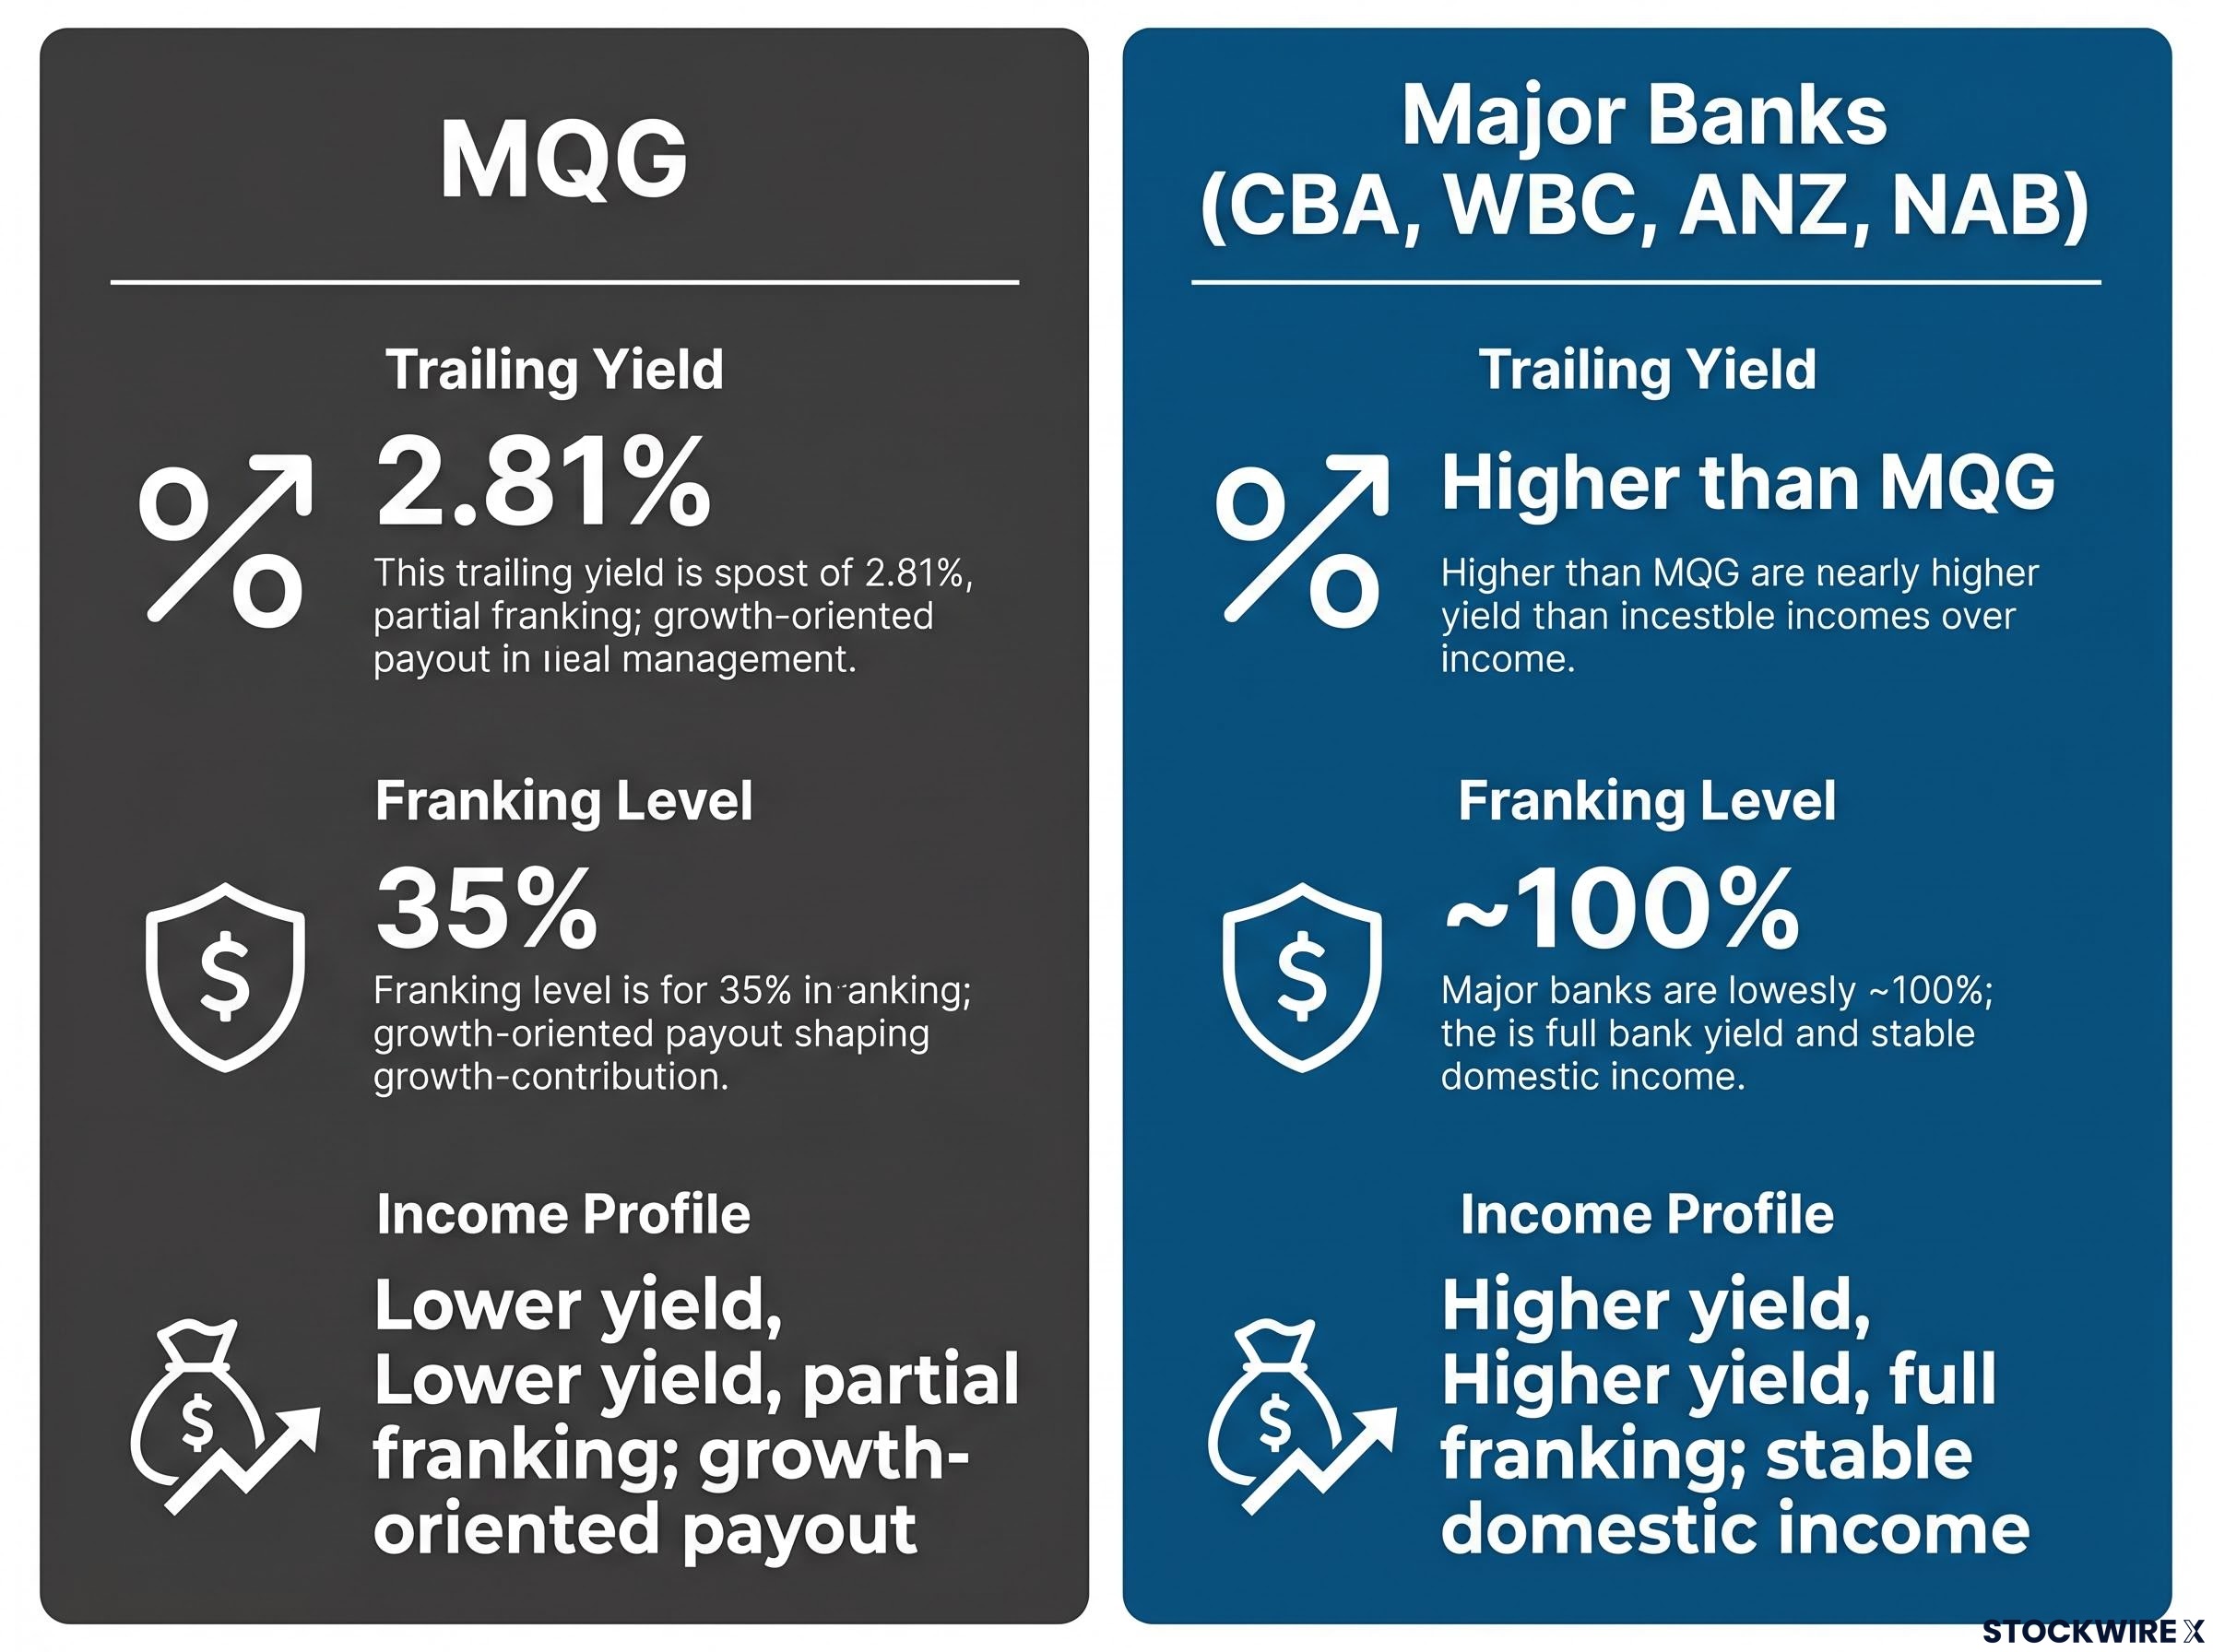
| Stock | Trailing Yield | Franking Level | Income Profile |
|---|---|---|---|
| MQG | 2.81% | 35% | Lower yield, partial franking; growth-oriented payout |
| CBA | Higher than MQG* | ~100% | Higher yield, full franking; stable domestic income |
| WBC | Higher than MQG* | ~100% | Higher yield, full franking; stable domestic income |
| ANZ | Higher than MQG* | ~100% | Higher yield, full franking; stable domestic income |
| NAB | Higher than MQG* | ~100% | Higher yield, full franking; stable domestic income |
Note: Exact trailing yields for the major banks should be verified from current market data at the time of reading. The directional comparison, that all four major banks offer higher fully franked yields than MQG, is consistent with the prevailing ASX financials yield structure as of 17 June 2026.
CBA is worth singling out. Despite being considered richly valued in its own right, it was noted as offering a higher trailing yield than Macquarie, which sharpens the income comparison: if even the most expensive of the big four out-yields MQG on a fully franked basis, the income case for holding Macquarie over the banks is difficult to sustain.
The previous sections establish what Macquarie is not: an optimal income stock at current valuations and franking levels. What it is, on a different set of criteria, is considerably more interesting.
Macquarie is best understood as a growth stock that happens to pay a dividend. Its earnings are driven by a business mix that has little in common with a domestic loan book:
Macquarie’s business mix is best understood in the context of how alternative asset manager earnings compound: fixed-cost platforms generate incremental fee revenue with minimal additional cost as AUM grows, which is why global alternatives AUM crossing $16.3 trillion has translated into outsized earnings growth at the large diversified managers.
The total shareholder yield, combining the cash dividend, moderate dividend growth, and active share buybacks, sits at approximately 4%. Combined with material capital appreciation (the 23% year-to-date gain being the most recent evidence), the total return profile materially exceeds the income yield alone.
A payout ratio in the mid-50s reinforces this framing. Macquarie is retaining meaningful earnings for reinvestment rather than maximising distributions, a capital allocation decision consistent with a management team that views the growth runway ahead as the primary source of shareholder value.
The MQG-suited investor is total-return focused with a long investment horizon, comfortable with year-to-year dividend variability, and seeking structural exposure to global infrastructure, asset management, and energy transition themes. The dividend is a supplement to capital growth, not the primary reason for holding the position.
The investor for whom MQG is not the right tool is the retiree or SMSF trustee optimising for high, stable, fully franked income. For that objective, the major banks offer a more efficient combination of yield, franking, and payout predictability.
Macquarie Group is not a compelling income stock at current valuations. A trailing yield of 2.81%, franked at only 35%, and subject to year-on-year variability, falls short of what the major banks deliver on every income measure that matters to Australian tax-resident investors.
It remains a credible total-return holding for a different type of investor: one who values global growth exposure, accepts dividend variability, and measures the position by total shareholder return rather than cash yield alone. The record-high share price, while compressing the yield, also validates the business model that makes Macquarie distinct from its domestic peers.
Income-focused investors should compare MQG’s grossed-up yield against the major banks before making an allocation decision, and not rely on the headline cash yield figure alone. The franking gap is real, and at current prices, it widens the effective income shortfall further.
For investors who conclude that MQG does not suit their income objectives and are ready to build an alternative income allocation, our comprehensive walkthrough of ASX dividend portfolio construction covers payout ratio analysis, dividend trap identification, franking credit optimisation, and sector diversification across the key ASX income buckets.
This article is for informational purposes only and should not be considered financial advice. Investors should conduct their own research and consult with financial professionals before making investment decisions. Past performance does not guarantee future results.
As of 17 June 2026, Macquarie Group's trailing dividend yield sits at 2.81%, based on total dividends of $7.00 per share, after the stock hit a record high of $250.78. Forward analyst estimates point to a yield of approximately 3.6-3.8% for FY2027.
Macquarie's dividends are franked at 35%, compared to effectively 100% franking across CBA, Westpac, ANZ, and NAB. The difference exists because a large share of Macquarie's profits are earned offshore, and Australian imputation rules only allow franking credits to the extent that Australian corporate tax has been paid.
Macquarie's annual dividend fell from $7.05 in FY2023 to $6.45 in FY2024 because the company does not manage dividends to a progressive-growth model; when global markets activity declines, the payout follows, and when activity recovers, the dividend rises again.
Macquarie targets an ordinary dividend payout ratio of 50-70% of net earnings, with recent payouts landing in the mid-50s percentage range, reflecting a deliberate decision to retain close to half of earnings for reinvestment across its global platform.
Partial franking at 35% means Macquarie's credits cover only a fraction of what fully franked bank dividends deliver in tax offsets, making the effective after-tax yield materially lower than the headline cash yield suggests, particularly for SMSF trustees and retirees who can fully utilise franking credits.