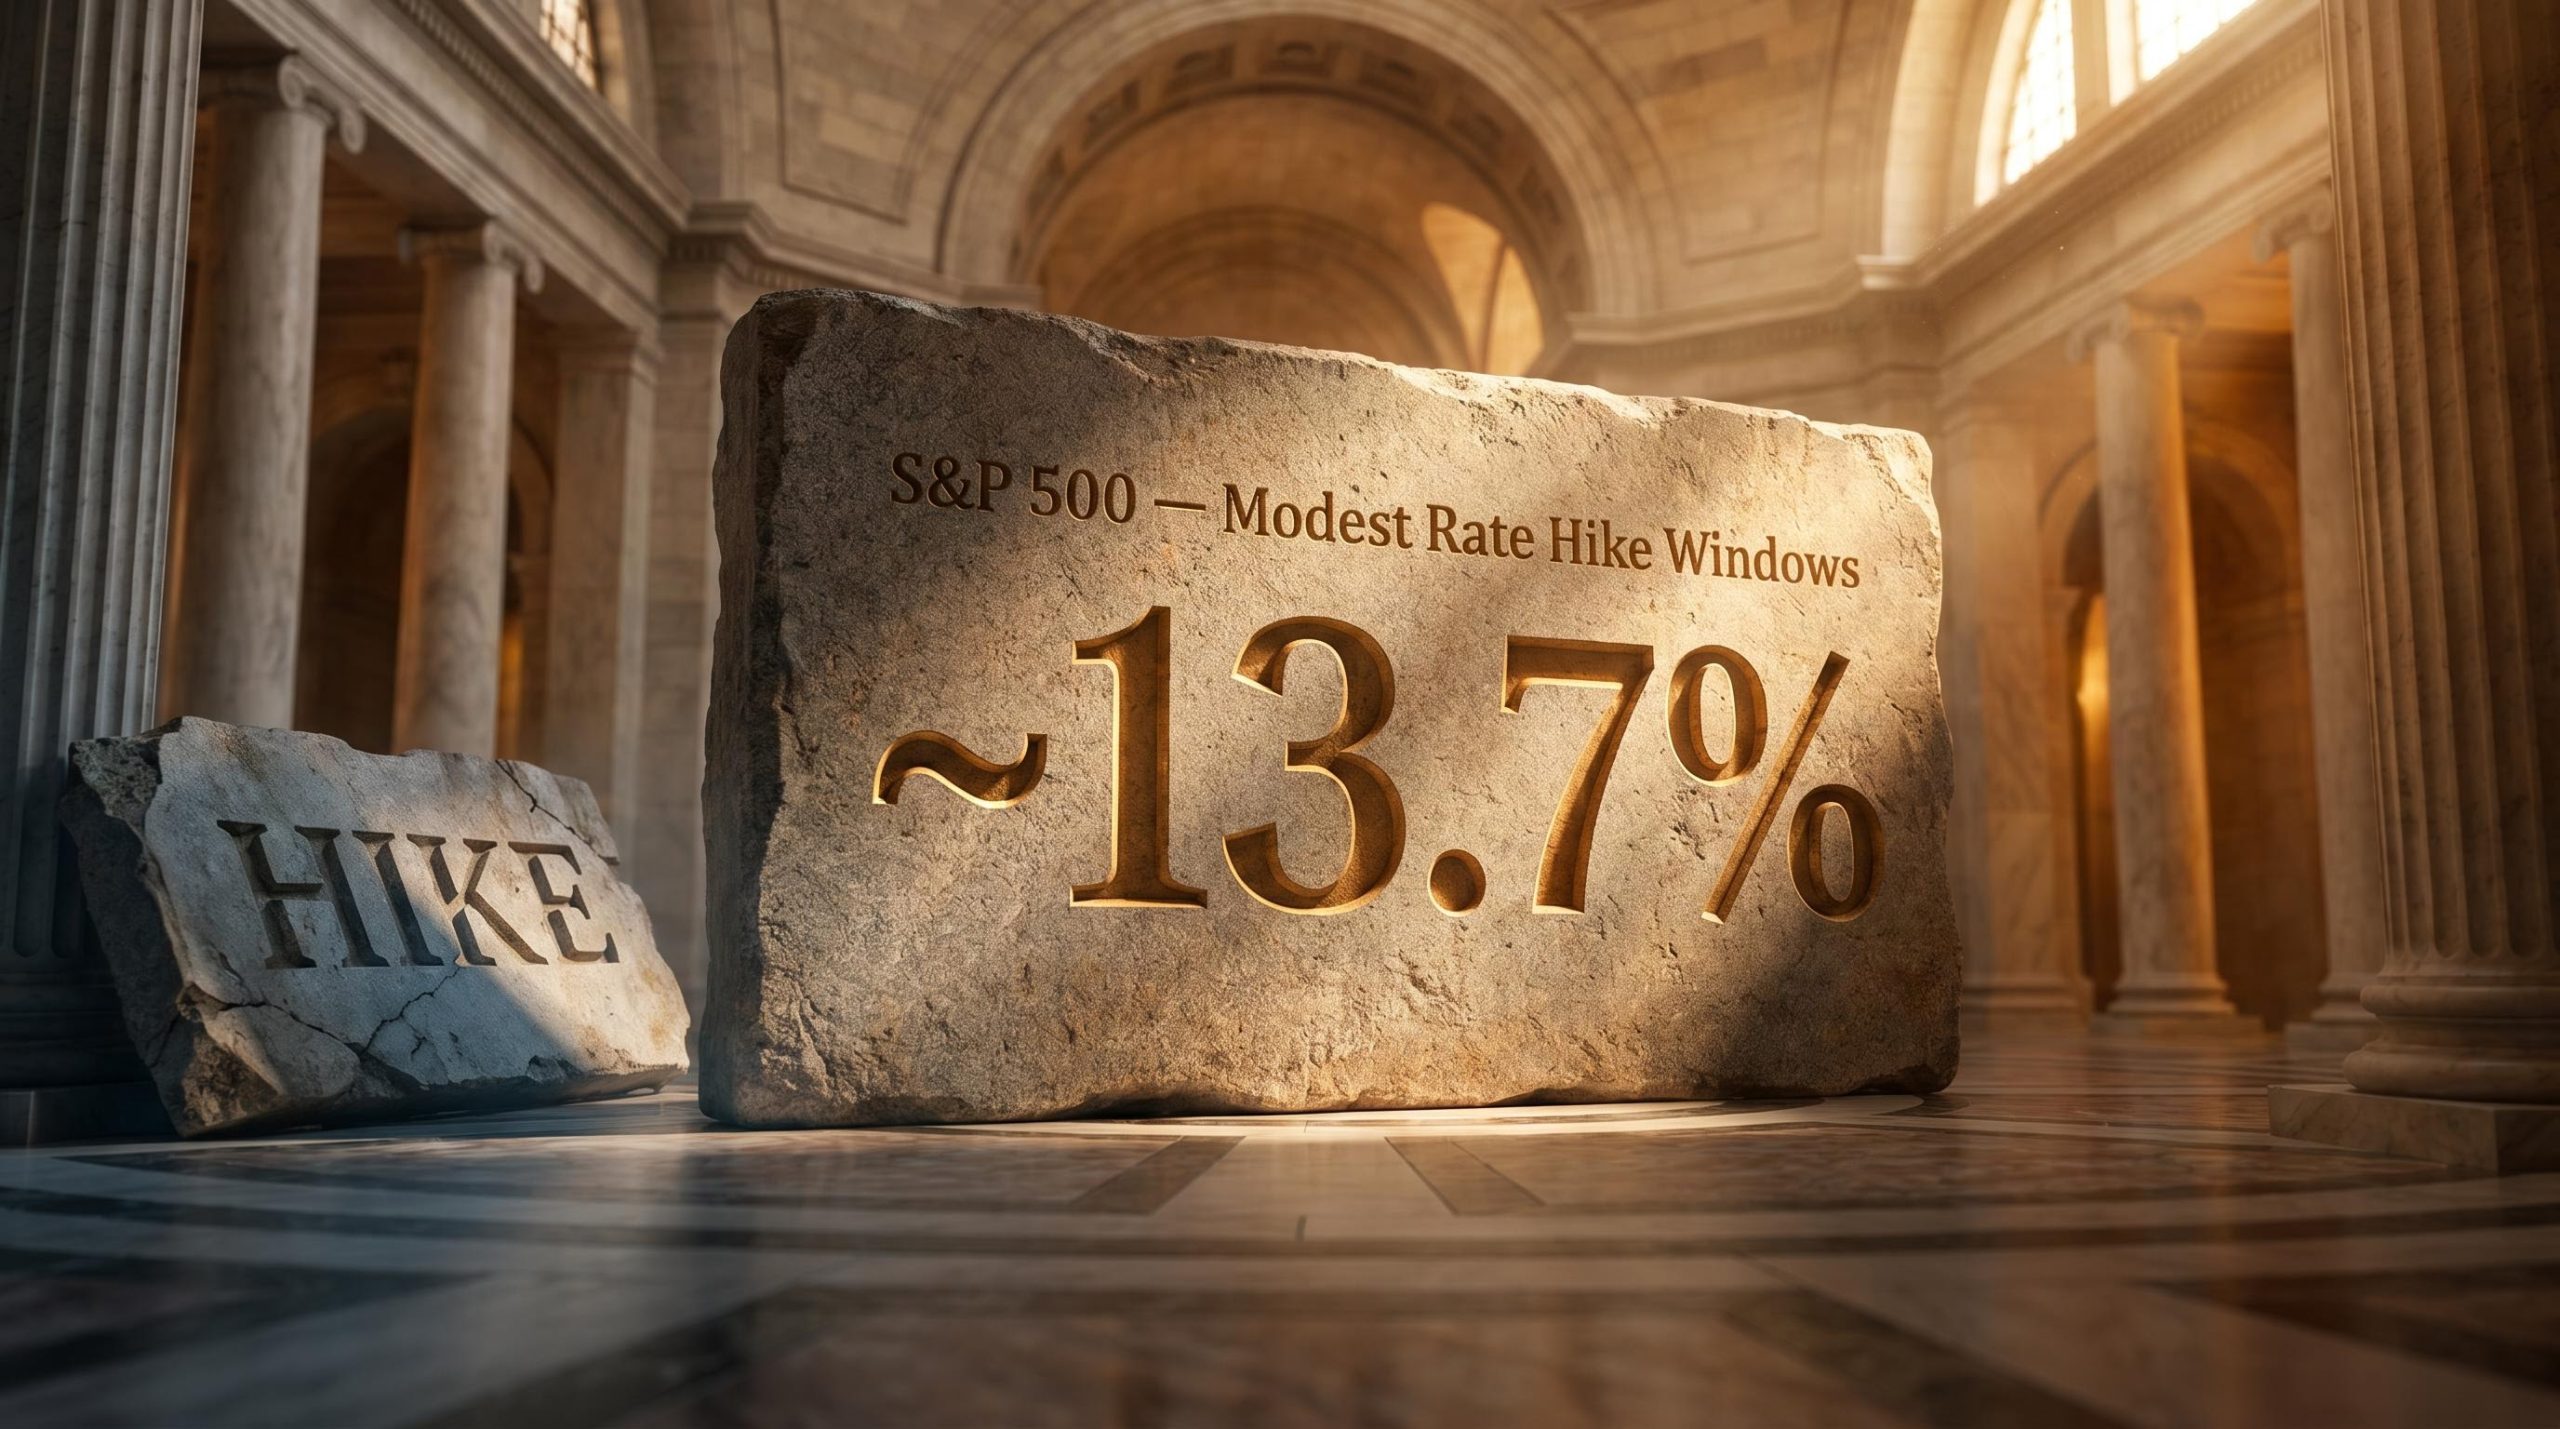
The S&P 500 has averaged approximately 13.7% during 12-month windows when the Federal Reserve raised rates by 1% or less, according to RBC Capital Markets. That single figure quietly dismantles one of the most persistent assumptions in retail investing: that rate hikes automatically spell trouble for equities.
Kevin Warsh took the chair of the Federal Reserve on 22 May 2026 and walks into his first FOMC meeting on 16-17 June facing PCE inflation at 3.8% year-over-year, its highest reading in roughly three years, and a futures market reflecting a non-trivial probability of at least one rate hike before year-end. The meeting is unlikely to produce an immediate move, but the tone, the dot plot, and Warsh’s press conference will be scrutinised for signals about how aggressively the new chair intends to restore the Fed’s 2% credibility. What follows is an examination of what the Warsh transition means for investors, what history actually says about equities during modest tightening cycles, and where the genuine risks lie in the current setup.
What Warsh inherits: the macro backdrop for his first FOMC meeting
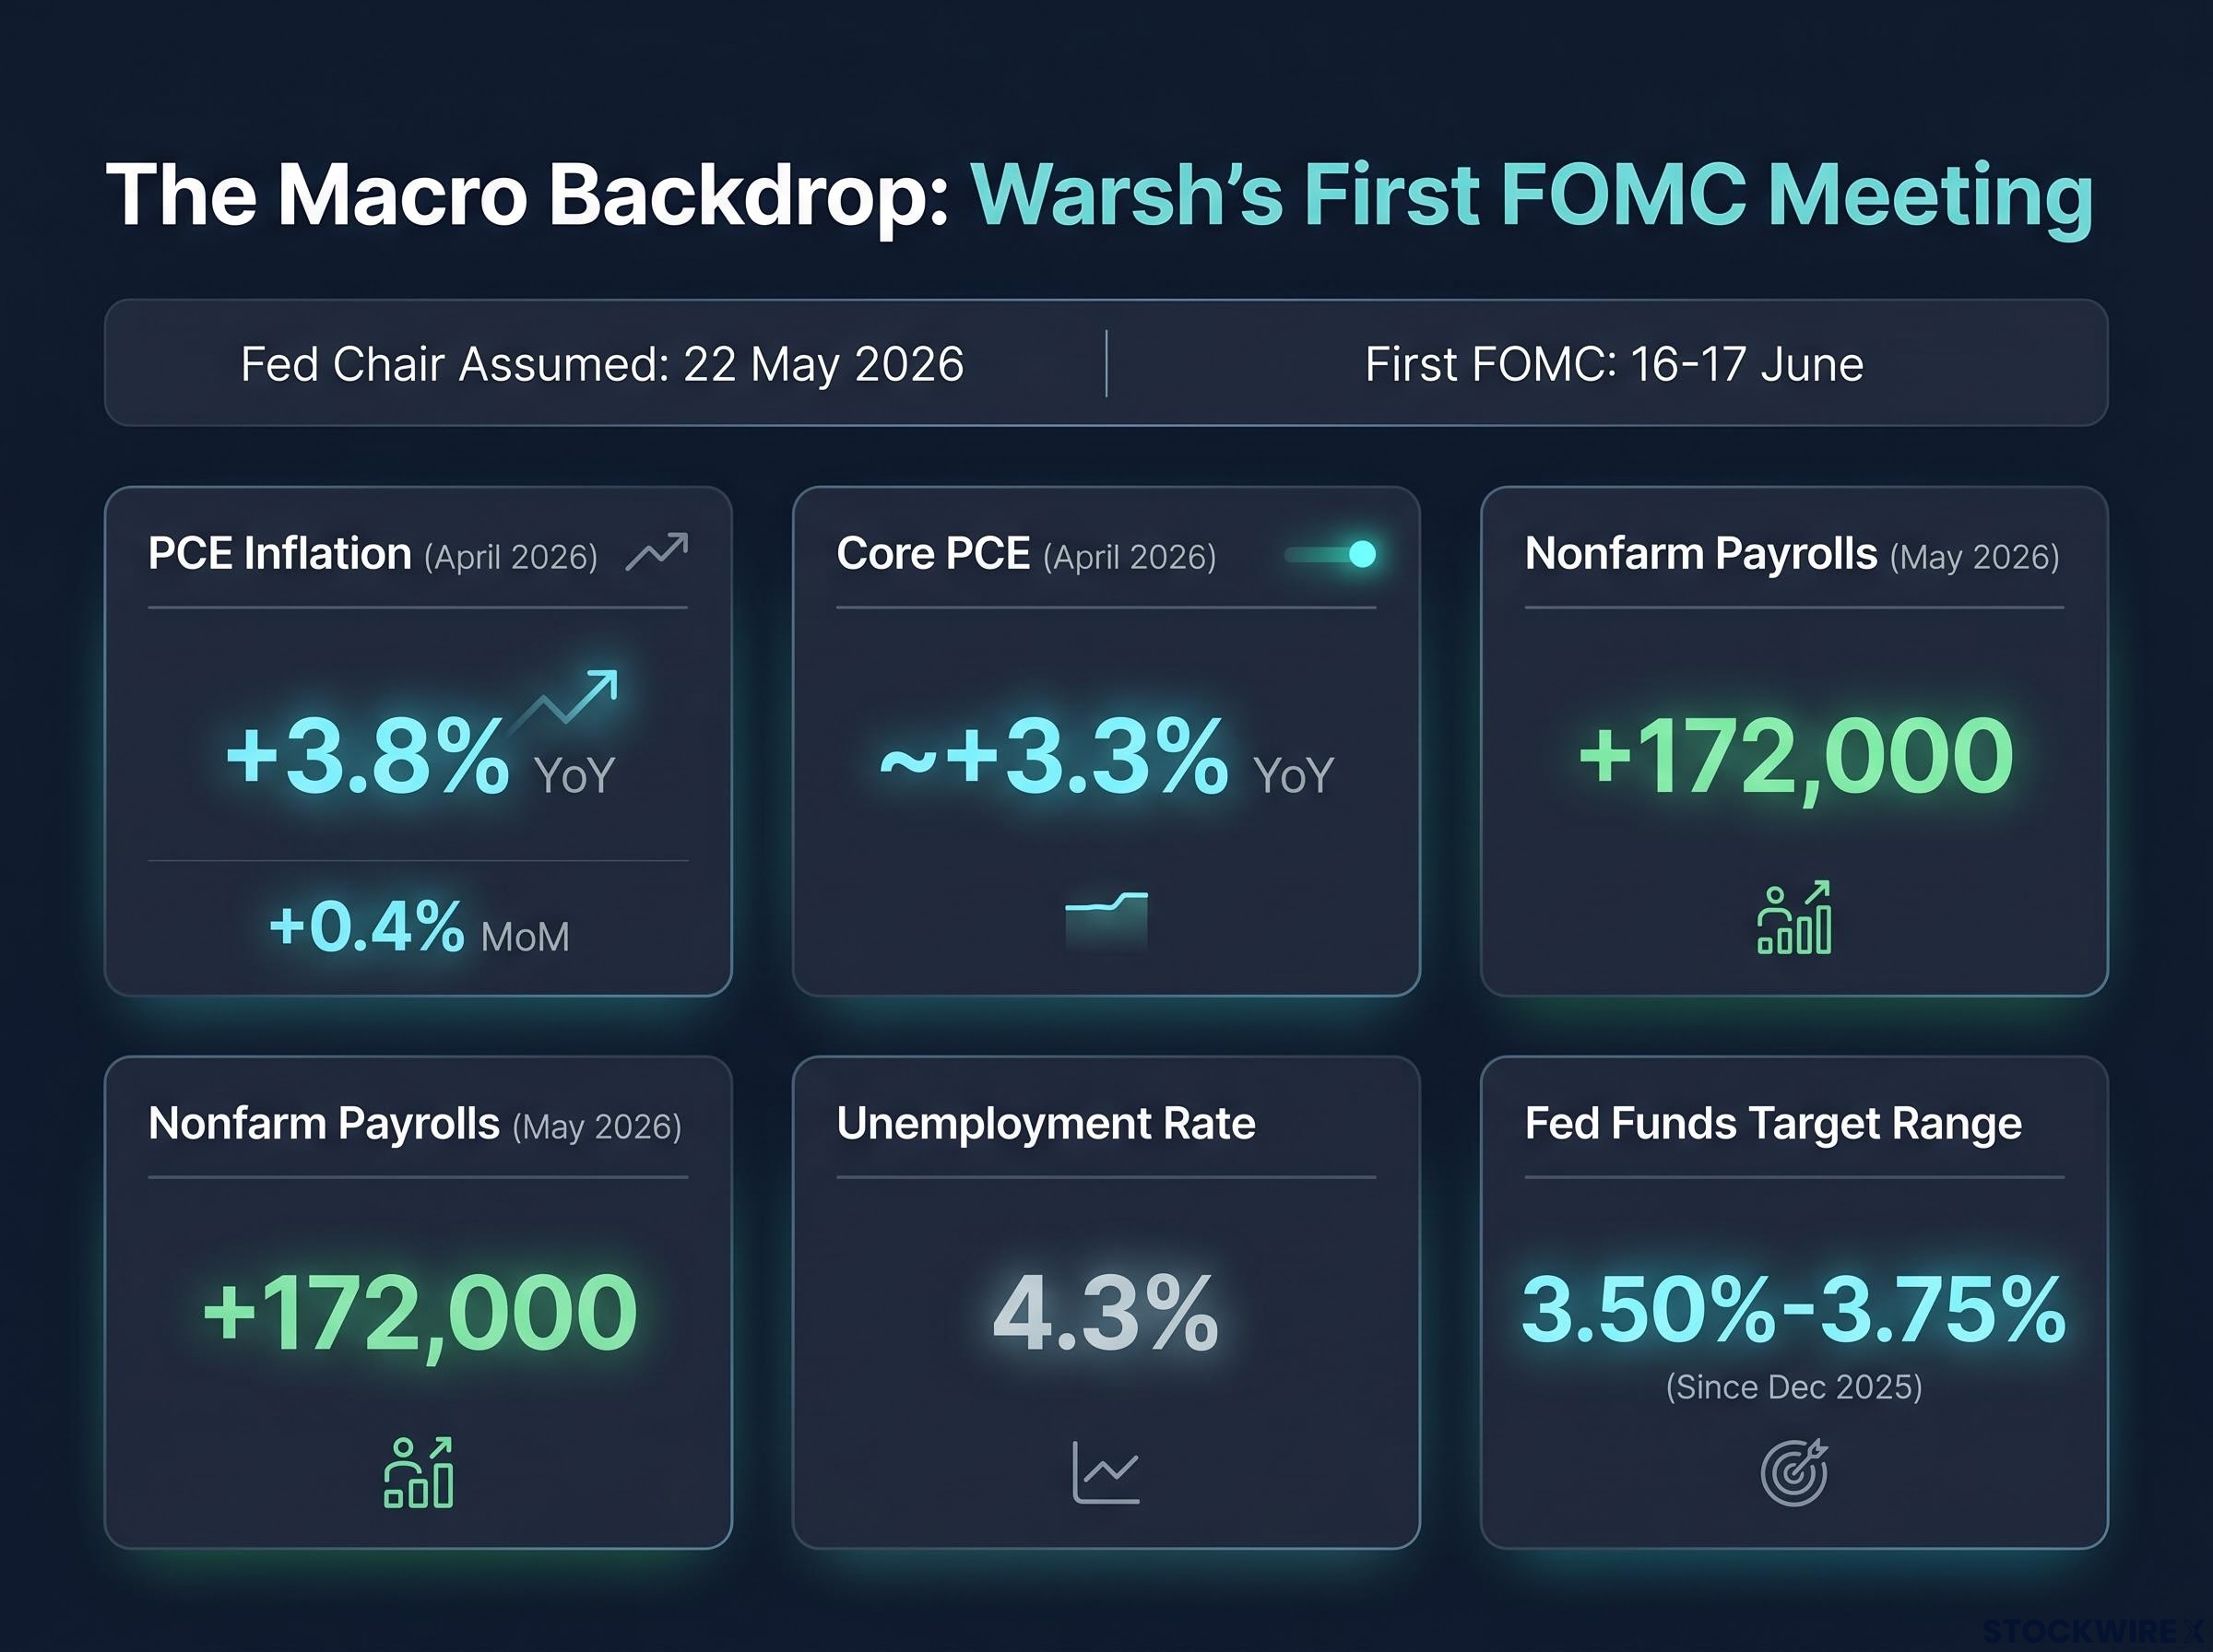
The numbers Warsh inherits tell their own story. Consider the set of facts he carries into the room on Monday:
- PCE inflation: +0.4% month-over-month and +3.8% year-over-year (April 2026), driven partly by higher oil prices
- Core PCE: approximately +3.3% year-over-year (April 2026), still well above the 2% target
- Nonfarm payrolls: +172,000 added in May 2026, above expectations
- Unemployment rate: 4.3%
- Federal funds target range: 3.50%-3.75%, in place since December 2025
PCE at 3.8% year-over-year represents the highest reading in roughly three years and remains the single most closely watched inflation gauge heading into the June meeting.
Consumer inflation in May 2026 rose at its fastest pace in three years, consistent with the April PCE reading. The labour market is not weakening. Futures markets reflect a non-trivial probability of at least one hike before year-end, though most institutional strategists’ base case remains rates on hold unless inflation continues to overshoot.
The headline versus core inflation split in the May 2026 CPI report, where headline hit 4.2% on a 40.5% annual surge in gasoline prices while core held at 2.9%, provides the most direct empirical test of whether the current price pressures represent economy-wide overheating or a geopolitical supply shock.
The Federal Reserve monetary policy communications released in April and May 2026, including the most recent FOMC statement and minutes, confirm the current federal funds target range of 3.50%-3.75% and reflect the majority view among members that some policy firming could be appropriate if inflation does not return toward 2%.
That combination, persistent inflation paired with a still-resilient labour market, is what makes Warsh’s position so loaded. The Fed’s next move, whatever it is, will be a response to this specific macro configuration.
When big ASX news breaks, our subscribers know first
How Kevin Warsh is likely to run a different Fed
Warsh’s stated priorities point to a measurably different institution. He has been a vocal critic of the Fed’s flexible average inflation targeting (FAIT) regime and favours a stricter interpretation of the 2% target, closer to a ceiling than a symmetric average. He is a strong proponent of using interest rates, not balance-sheet tools, as the primary instrument for managing inflation.
Recent FOMC minutes reflected a majority view that “some policy firming” could be appropriate if inflation does not return toward 2%. Under Warsh, that language carries more weight. His orientation suggests he would lean toward acting on it rather than waiting for further confirmation.
The April FOMC fracture, which produced four dissenting votes in a single meeting, the most internal disagreement in decades, is the committee Warsh must unify while simultaneously managing a PCE reading that has climbed to its highest level in roughly three years.
The more structural shift, however, is in how the Fed communicates.
What less forward guidance means for markets
Warsh has signalled interest in downplaying or potentially eliminating the dot plot, which analysts have characterised as potentially a “relic of the past” under his leadership. He prefers the chair speaking for the institution with fewer public signals about the precise future path of policy.
For investors, this changes the rules of engagement:
- Without regular dot plot updates anchoring rate expectations, each PCE print, payrolls report, and unscheduled Warsh comment carries more market-moving weight than investors have been accustomed to
- This week’s meeting may effectively be the last in which the dot plot occupies its traditional central role in market interpretation
- Warsh’s press conference tone will function as the primary forward signal, deserving as much attention as the statement itself
Markets become more sensitive to individual data releases and chair communication, elevating volatility around words, not just actions.
What the historical record actually shows about stocks and rate hikes
Before reacting to the prospect of a hike, the historical relationship between rate moves and equity returns deserves direct examination.
RBC Capital Markets strategists analysed S&P 500 performance across different rate-move magnitudes. The pattern that emerges is not the one most retail investors expect.
| Rate Move Type | Magnitude | S&P 500 Avg. 12-Month Return | Typical Economic Context |
|---|---|---|---|
| Modest hikes | 1% or less | ~13.7% | Growing economy, contained inflation |
| Modest cuts | 1% or less | ~13.3% | Targeted easing, stable growth |
| Aggressive hikes | Greater than 1% | Weaker or negative | Fed behind the curve on inflation |
| Aggressive cuts | Greater than 1% | Weaker or negative | Recession or crisis response |
~13.7% average S&P 500 return during 12-month windows with modest rate hikes of 1% or less, according to RBC Capital Markets strategists.
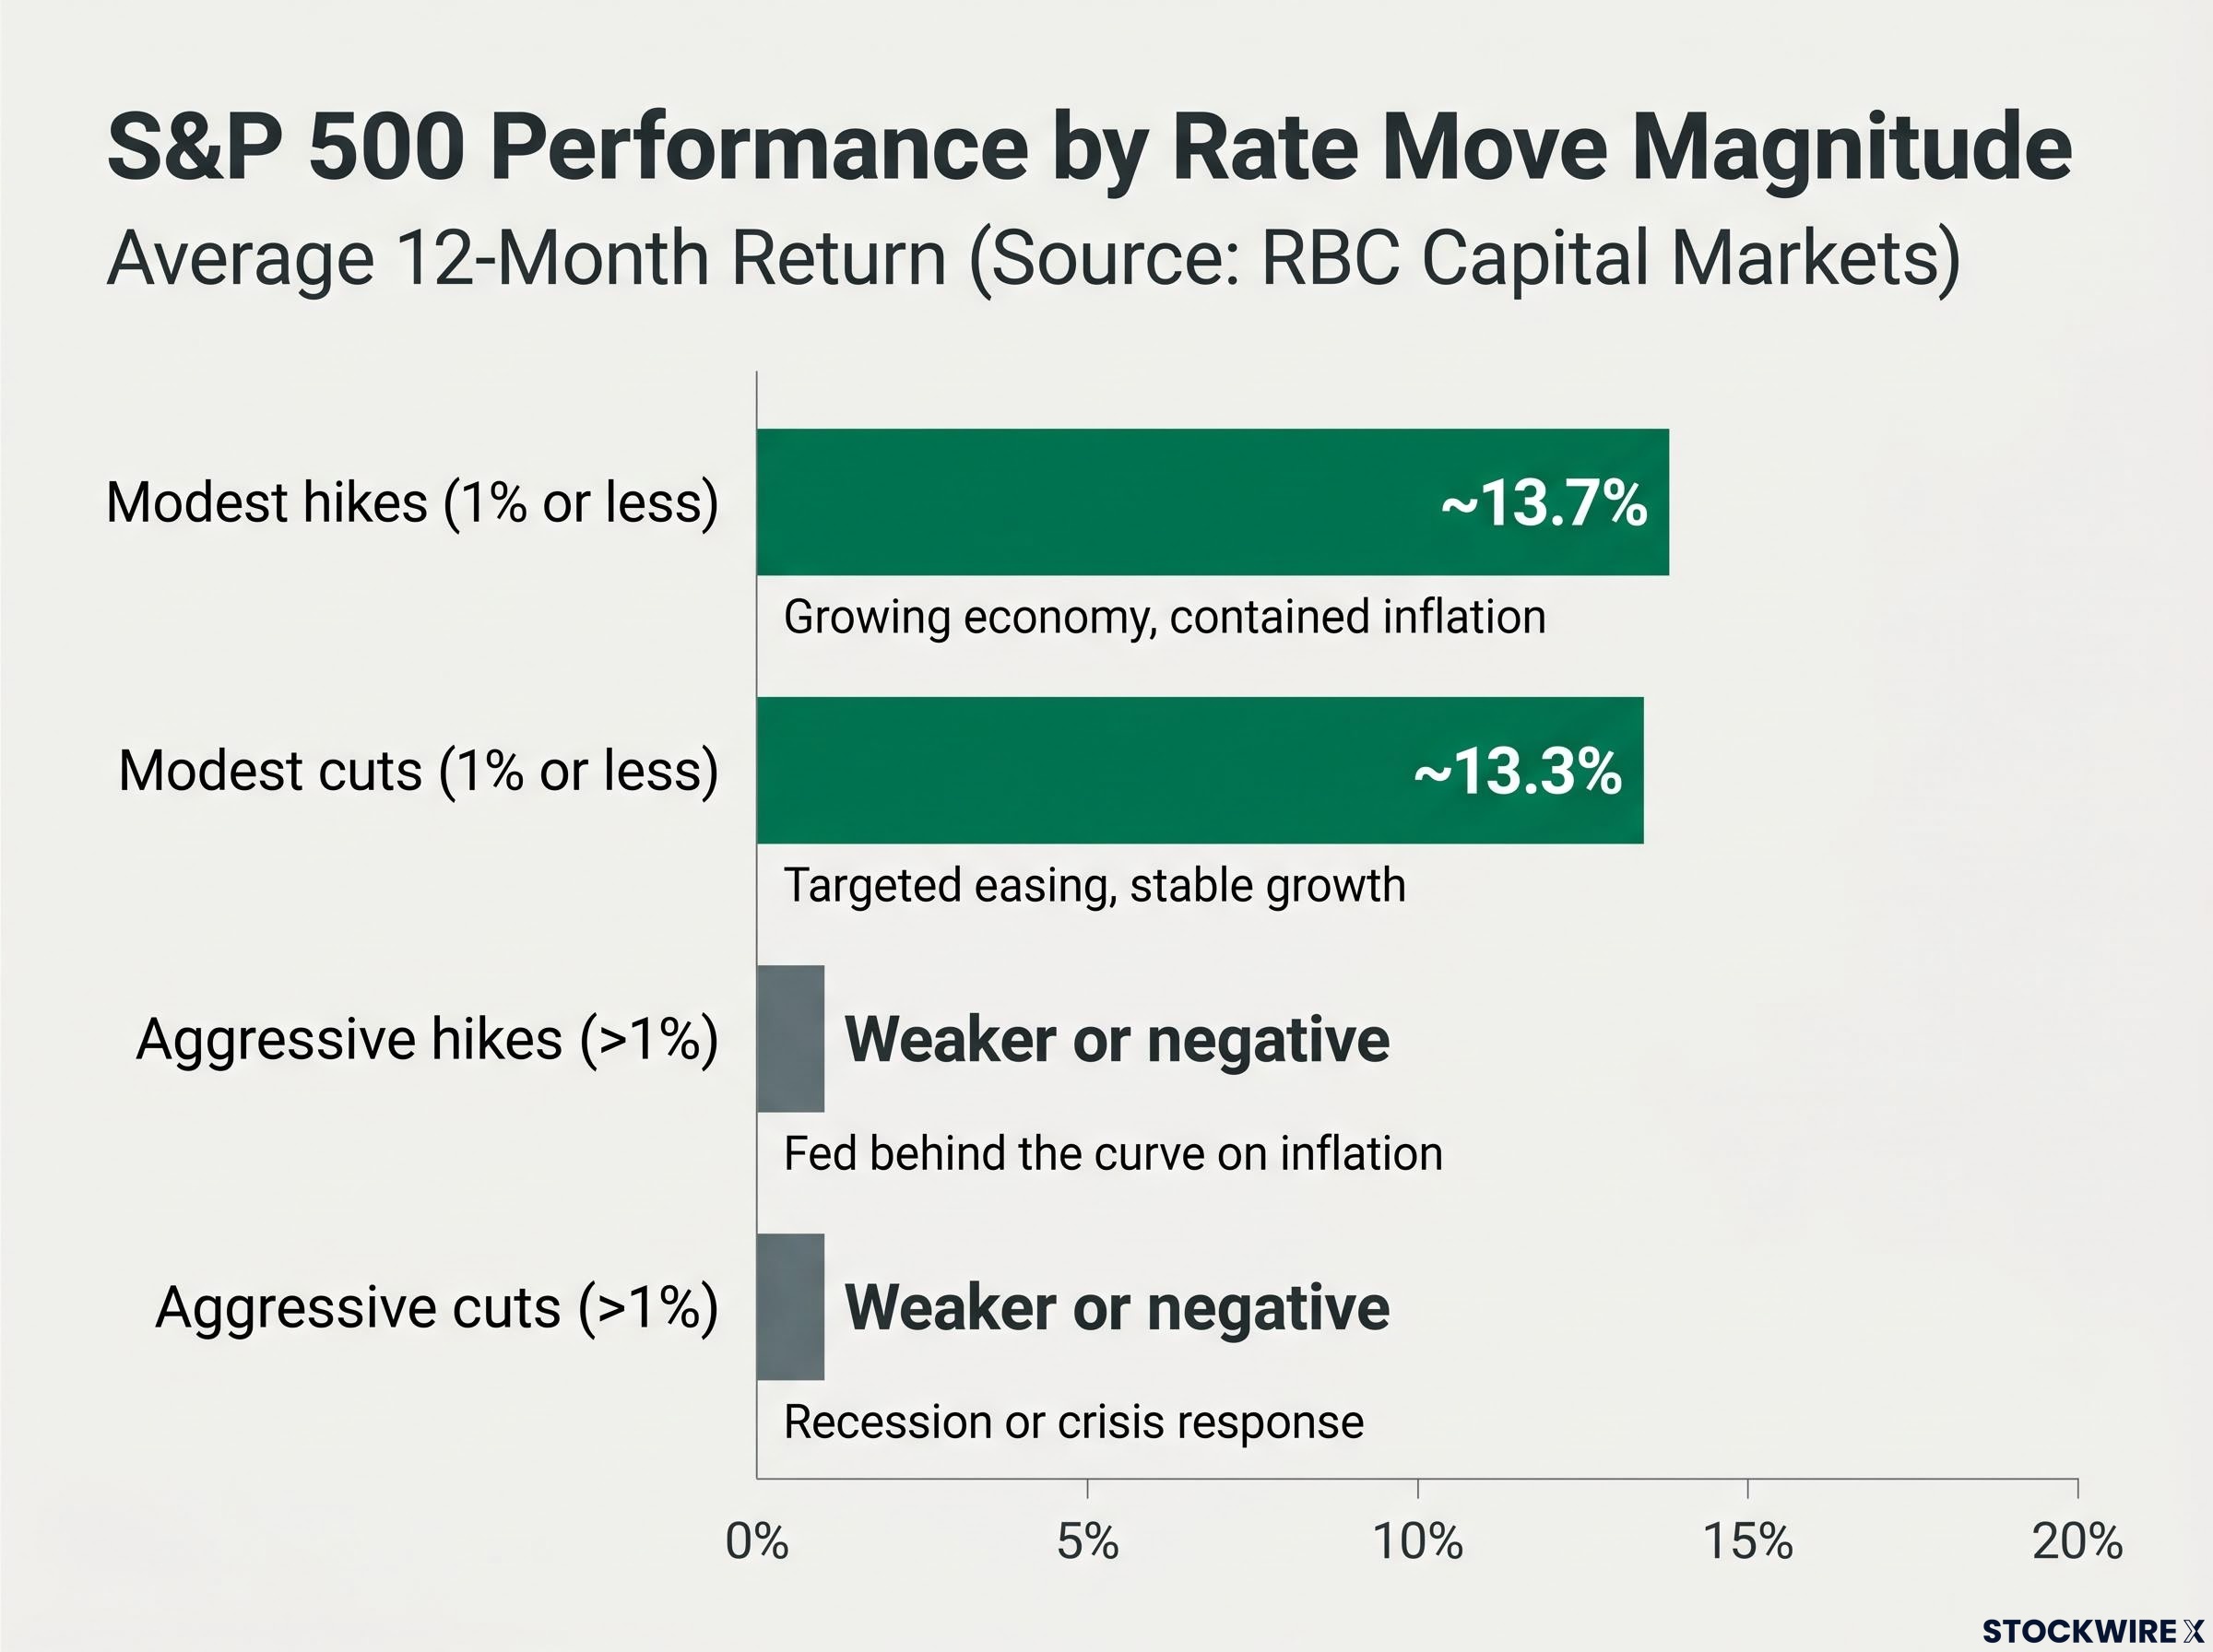
The data reframes the question investors should be asking. The relevant variable is not whether the Fed is hiking or cutting; it is how far and how fast it moves, and whether those moves track a controlled adjustment or a crisis response. Past averages mask variation across individual cycles, and these figures originate from a single firm’s study. But the directional finding is consistent with how professional strategists describe past rate environments: modest moves in either direction have coincided with solid equity returns.
The long-run equity return evidence, spanning a century of global market data and showing equities outperforming bonds by approximately 3-4 percentage points annually, provides the baseline against which any single rate cycle’s impact on stocks should be measured rather than evaluated in isolation.
Why aggressive tightening is the real risk, not the first hike
The mechanism behind large aggressive cuts coinciding with poor equity returns is straightforward: they are typically crisis responses. The cuts are a reaction to deteriorating conditions, not a cause of them, and the market is already weakening before the Fed acts.
The same logic applies in reverse. Aggressive hikes signal the Fed is behind the curve on inflation, forcing rapid compression of valuations and raising recession probability. A single modest adjustment does neither.
The current setup is meaningfully different from past disorderly tightening episodes. Rates sit at 3.50%-3.75% (effective rate approximately 3.62%), unemployment is at 4.3%, and growth remains positive. J.P. Morgan strategists expect the Fed to keep rates steady through year-end 2026 but note that “some policy firming” could become appropriate if inflation persists.
For aggressive tightening to become a genuine equity risk, a specific sequence of conditions would need to materialise:
- Inflation persistently overshooting across multiple prints, not just one or two elevated readings
- Second-round effects emerging in wages and services prices, broadening the inflation base beyond energy
- Warsh forced to respond with rapid, sizeable hikes rather than measured, conditional adjustments
That remains a risk scenario, not a base case. Investors who conflate “one possible modest hike” with “the beginning of a damaging tightening cycle” are responding to the wrong variable.
The one factor that changes the calculus: elevated valuations in AI-driven growth assets
The historical framework applies to the current setup, but it applies with a qualifier.
Growth assets with valuations dependent on discounting future cash flows are more sensitive to any rate increase than value-oriented or dividend-paying assets. Even a modest rise in the discount rate (the rate used to calculate what future earnings are worth in today’s terms) compresses present-value calculations meaningfully for companies whose valuations rest on earnings projected years into the future.
The AI-driven equity rally has elevated valuations in technology and growth-oriented sectors heading into Warsh’s first meeting, increasing rate sensitivity relative to prior cycles. This dynamic makes Warsh’s communication and tone at the press conference disproportionately important. The market may reprice growth assets based on language alone, before any actual policy action occurs.
The growth stock valuation discount entering Warsh’s first meeting sits at approximately 21% below fair value according to Morningstar data, a level recorded less than 5% of the time since 2011, meaning the rate-sensitivity risk the article describes is arriving at a point where growth assets are already pricing in a meaningful degree of compression.
The inflation trajectory is the decisive variable. Two scenarios frame the range of outcomes:
- Energy-driven inflation proves transitory: No further hikes needed beyond a potential modest adjustment; growth assets stabilise as inflation fears recede
- Second-round effects emerge in wages and services: Warsh forced to move further; growth valuations compress more substantially as the discount rate rises
What to watch beyond the June meeting
The forward-looking indicators that will resolve which scenario materialises are specific: the trajectory of PCE and core PCE in subsequent months, whether wages and services inflation accelerate, and the pace and magnitude of any hikes Warsh ultimately delivers.
The dot plot at this meeting, while potentially in its twilight, will still be the primary forward signal available this week. After that, Warsh’s preference for less communication means subsequent data releases will carry more interpretive weight than they did under prior chairs.
The question is not whether the Fed hikes, but how far it goes
The historical evidence and the current setup point toward a single coherent message: a single modest hike in a growing economy with contained unemployment is not the market-ending event the prevailing narrative often implies. RBC Capital Markets data showing an average ~13.7% S&P 500 return during modest hike windows reinforces that the magnitude and pace of tightening matter far more than the direction of any single move.
Magnitude and pace of tightening matter more than the direction of any single move. A modest adjustment in a growing economy and an aggressive catch-up campaign are fundamentally different events for equity returns.
The practical adjustments are calibrated, not panicked:
- Diversification across asset classes and sectors, consistent with current major wealth-management firm guidance
- Attention to real assets as a potential inflation hedge if price pressures persist
- Awareness of growth-stock concentration risk, given elevated valuations’ sensitivity to discount-rate changes
Three forward variables deserve ongoing monitoring:
- PCE trajectory across the next several prints
- Whether second-round inflation effects (wages, services) broaden the price-pressure base
- The pace of any hikes relative to the modest-versus-aggressive threshold
Given Warsh’s preference for less forward guidance, investors accustomed to the dot plot as a roadmap will need to recalibrate how they interpret Fed signals going forward. The question worth asking is not whether the Fed hikes, but whether this is a controlled adjustment or the start of something larger. The data, the starting conditions, and the institutional base case all suggest the former.
This article is for informational purposes only and should not be considered financial advice. Investors should conduct their own research and consult with financial professionals before making investment decisions. Past performance does not guarantee future results. Financial projections are subject to market conditions and various risk factors.