
A stock that falls 40% in price is not necessarily riskier than one that holds steady. Within a value investing framework, that price drop may represent an opportunity rather than a danger signal, a point where the gap between what a business is worth and what the market charges for it has widened in the investor’s favour. Most investors inherit their definition of risk from modern portfolio theory: volatility, beta, standard deviation. These metrics dominate financial education, brokerage platforms, and fund prospectuses. Yet a significant tradition of practitioners, from Benjamin Graham to Seth Klarman to Warren Buffett, has always operated with a different definition entirely. This article explains how value investors define and measure risk, walks through the six business dimensions they assess before committing capital, and shows how each dimension feeds into the margin of safety calculation that determines whether an investment is worth making.
Why volatility is the wrong measure of investment risk
Conventional finance defines risk through price behaviour. Volatility, beta coefficients, and Value-at-Risk (VaR) models emerged from modern portfolio theory and became embedded in academic curricula, institutional compliance frameworks, and the risk dashboards retail investors see on their brokerage accounts. Under this definition, a stock that swings widely in price is labelled high-risk regardless of what the underlying business is doing.
Value investors reject this framing. Their definition is narrower and more consequential: risk is the probability of permanent capital loss, or of earning an insufficient return on the capital committed.
The practical toolkit built on top of this risk philosophy includes specific value investing metrics, particularly P/E ratio, price-to-book, free cash flow yield, and debt-to-equity thresholds, that translate the qualitative six-dimension assessment into a quantitative screening process for identifying candidate investments.
The distinction is not semantic. Consider a fundamentally sound business whose share price drops 40% because of broad market panic rather than any deterioration in its operations or cash flows. A beta-based model flags the stock as higher risk precisely at the moment a value investor would consider it lower risk, because the same business can now be purchased at a significantly wider discount to its intrinsic worth. Meanwhile, a stock that holds steady at a price well above its intrinsic value registers as “low risk” on volatility screens while exposing its buyer to the very outcome value investors fear most: overpaying.
Warren Buffett has articulated that the real risk in investing is permanent capital loss, not price fluctuation. Seth Klarman formalised this further, positioning the margin of safety as the practical expression of risk management: the discipline of buying only when the price is meaningfully below estimated value.
Two competing definitions, then, sit at the centre of this debate:
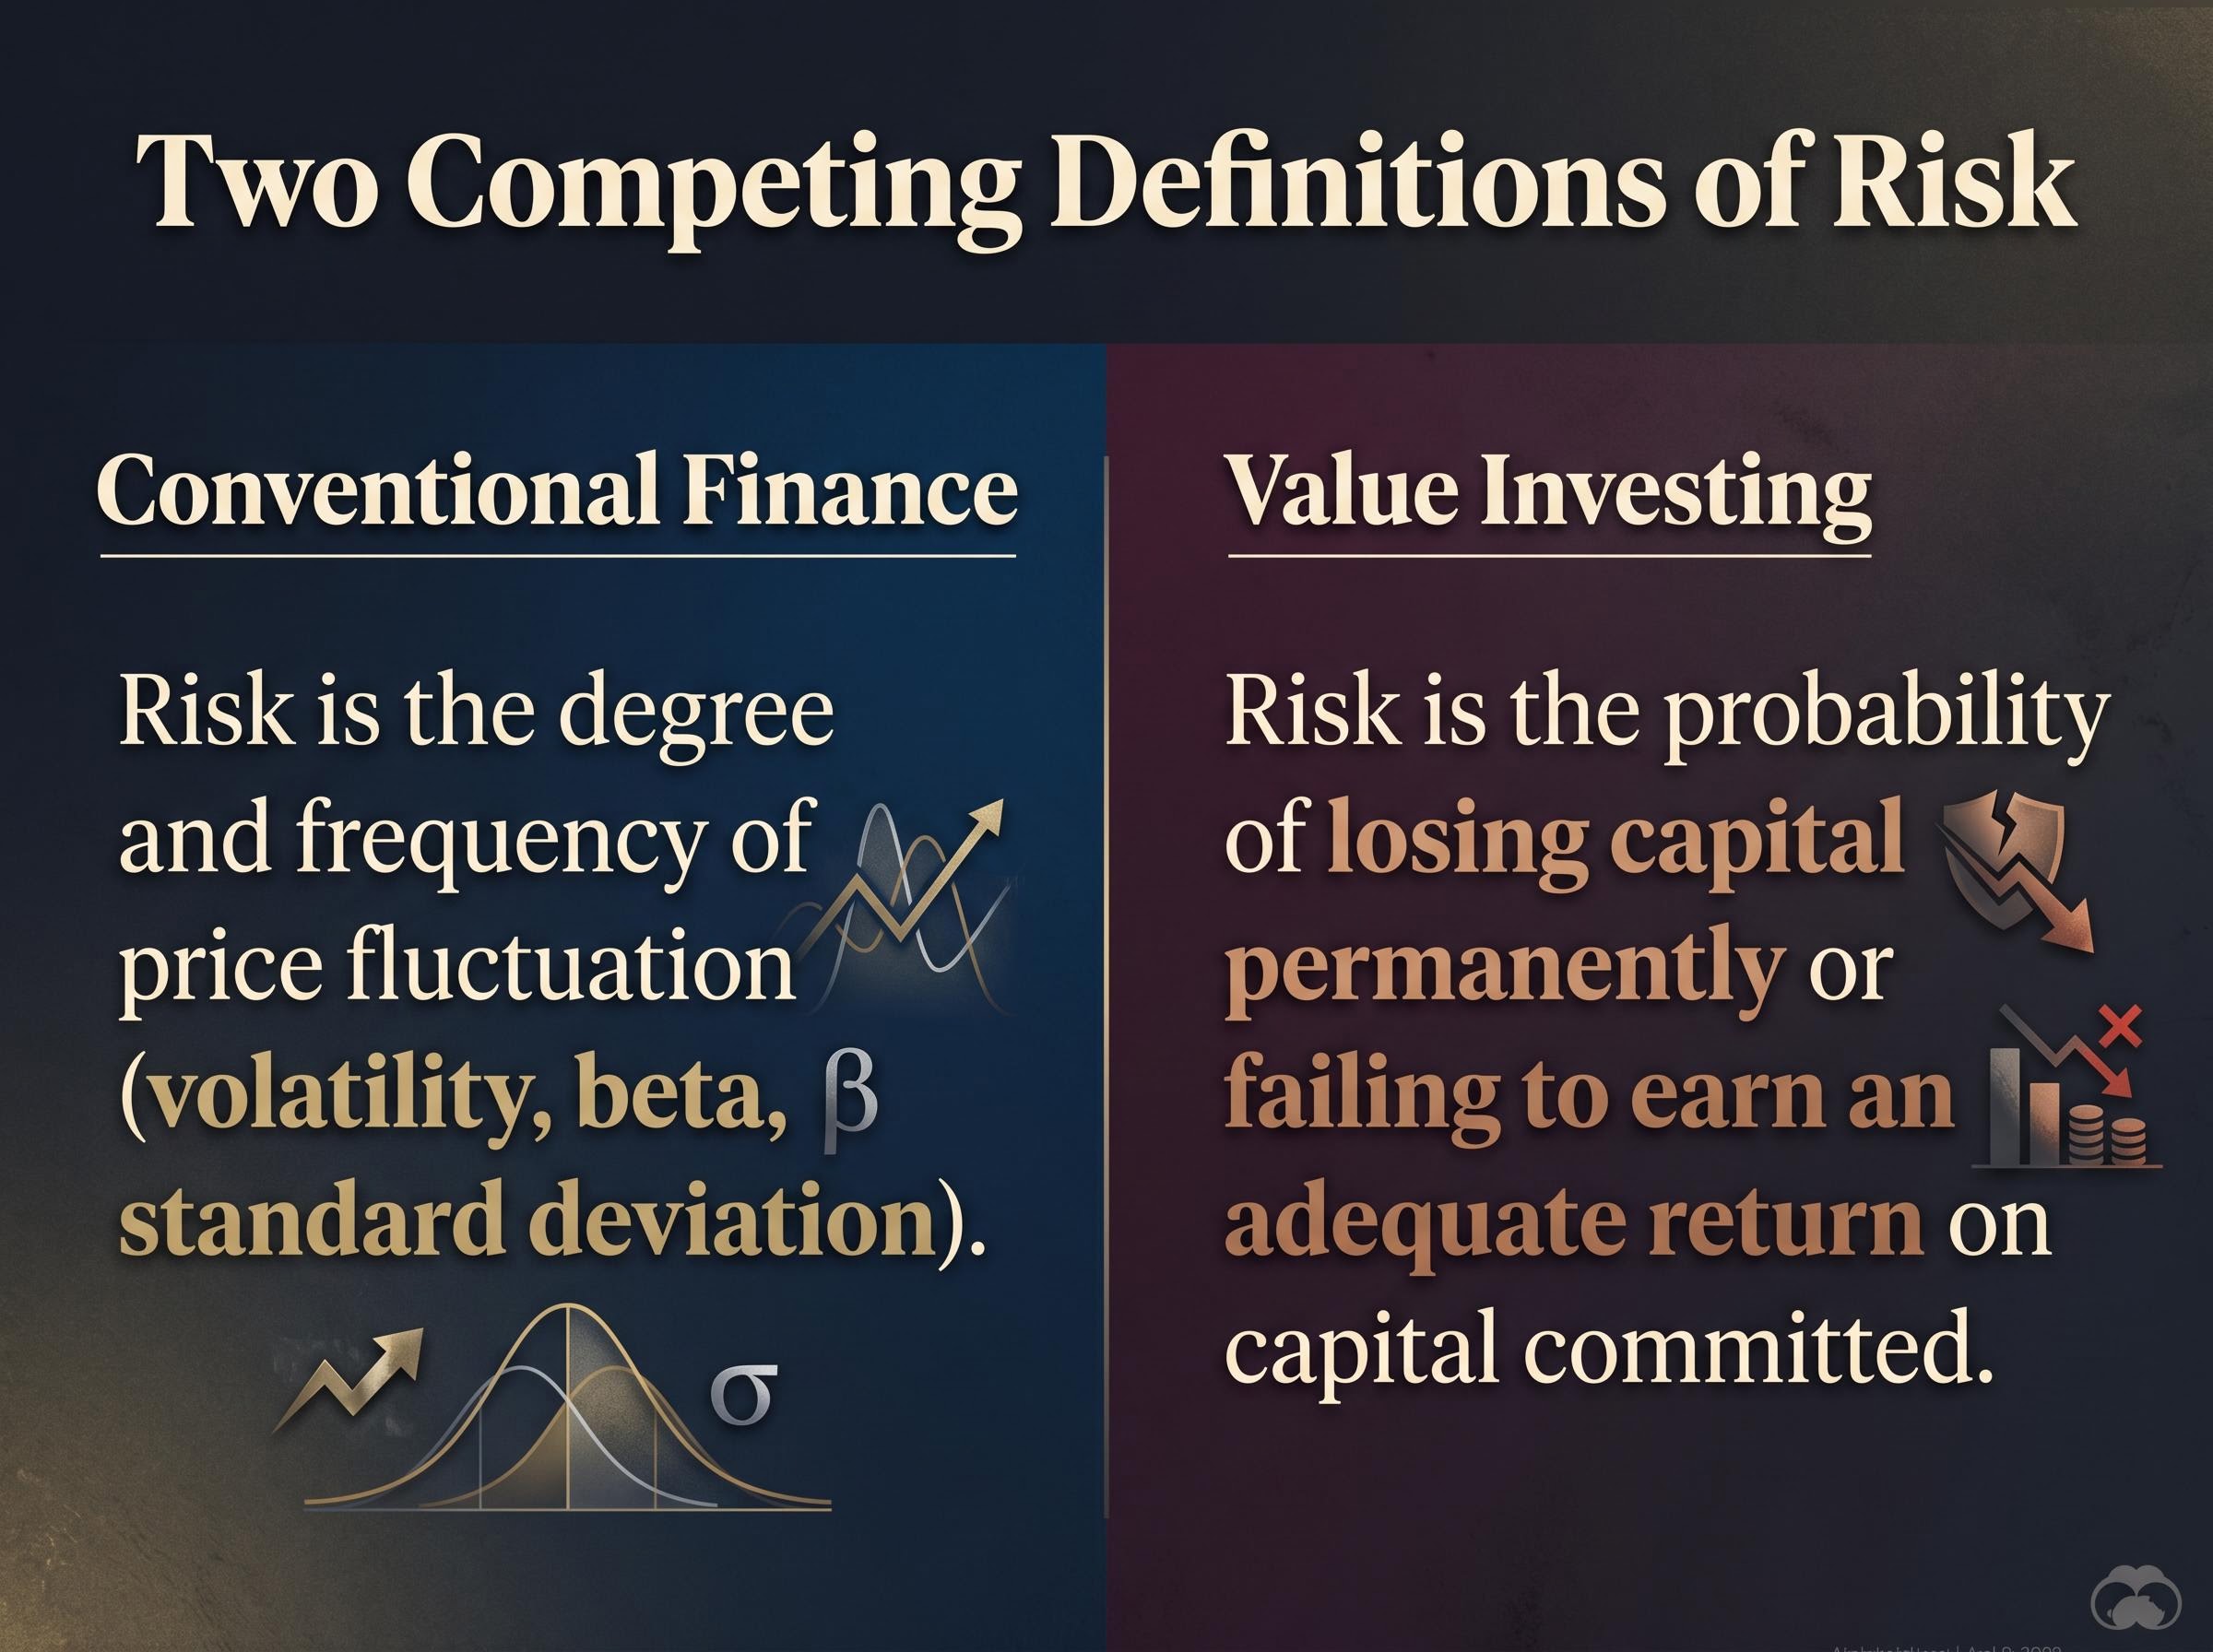
- Conventional finance: Risk is the degree and frequency of price fluctuation (volatility, beta, standard deviation).
- Value investing: Risk is the probability of losing capital permanently or failing to earn an adequate return on capital committed.
Getting this definition right is the single most consequential conceptual decision in value investing. Every practical choice that follows, including what price to pay, how much margin of safety to demand, and which businesses to avoid, flows from this starting point.
When big ASX news breaks, our subscribers know first
The foundation: permanent capital loss and what actually causes it
If permanent capital loss is the risk value investors are trying to avoid, the next question is what actually produces it. Two root causes account for nearly every case.
The first is paying too much relative to intrinsic value. When an investor buys a business at a price that already prices in optimistic future assumptions, there is no buffer if reality falls short. The second is making incorrect assumptions about the business’s future cash flows, whether by overestimating revenue growth, underestimating competitive threats, or misjudging the durability of a business model.
Both causes are qualitative and analytical. Neither is visible in a price chart or captured by a volatility calculation, which is precisely why conventional risk tools are structurally blind to them.
The defensive investing philosophy that underpins this framework rests on an asymmetric mathematical reality: a 50% loss requires a 100% subsequent gain to break even, making permanent capital loss arithmetically more damaging than an equivalent gain is beneficial, which is precisely why Howard Marks and Oaktree Capital built their entire approach around loss avoidance rather than return maximisation.
Why conventional tools miss the real risks
A discounted cash flow (DCF) model produces a precise intrinsic value figure from a set of mechanical assumptions. That precision can create false confidence. The margin of safety concept, by contrast, is a discipline and disposition rather than a formula. It begins from three acknowledged realities:
- Valuation is an imprecise discipline; no analyst can know a business’s true worth to the decimal.
- The future is inherently unpredictable; cash flow projections are estimates, not facts.
- Investors are fallible; cognitive biases, incomplete information, and emotional responses affect every assessment.
All three make a buffer between the price paid and the estimated value not merely useful but necessary. Understanding these root causes shifts the investor’s analytical attention from the screen to the business itself, which is where the real work in value investing takes place.
Beyond price: what value investors assess in a business
The six dimensions below form a structured checklist that translates the abstract concept of risk assessment into a concrete, repeatable process. Each dimension addresses a specific question about the underlying business. Together, they determine how much risk the investor is actually taking on, independent of share price behaviour.
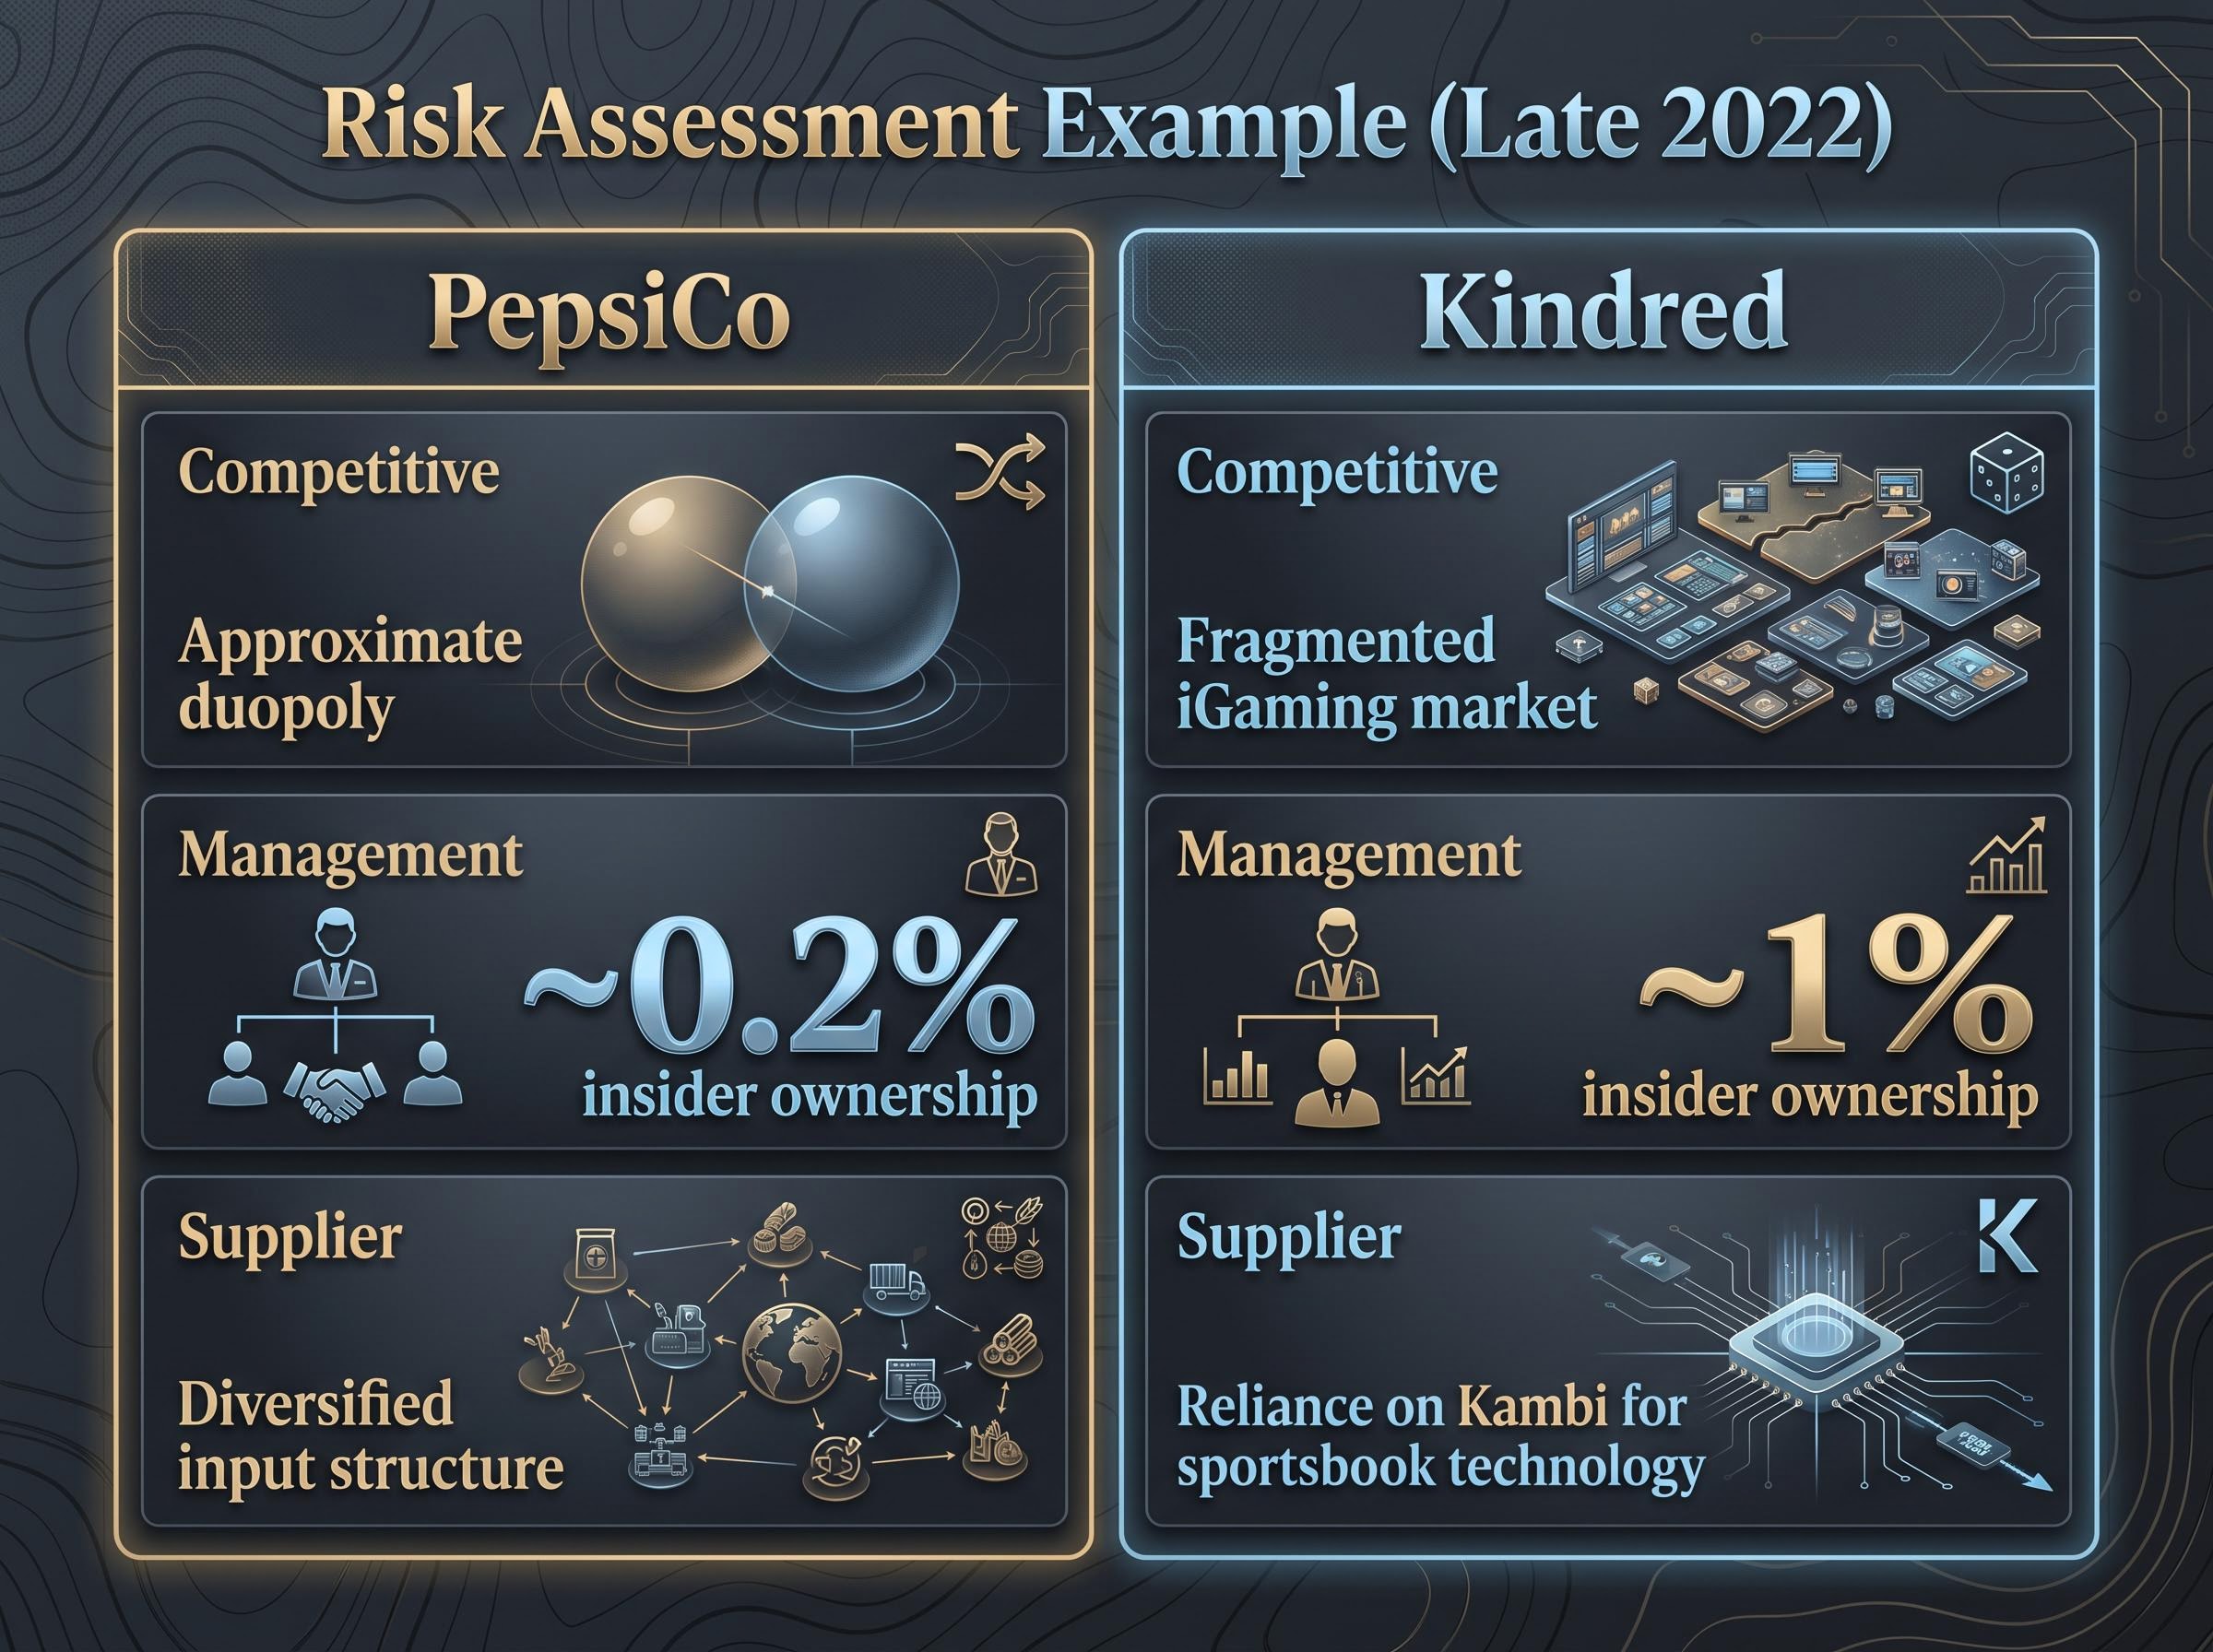
To illustrate how the dimensions work in practice, two companies are used as teaching examples throughout: PepsiCo and Kindred (the iGaming operator). All data reflects late 2022 conditions and is used purely to demonstrate the framework, not as current investment guidance.
| Dimension | Core Question | Lower Risk Signal | Higher Risk Signal |
|---|---|---|---|
| Regulatory Environment | Is the regulatory regime stable or shifting? | Mature, predictable regulatory framework with low political sensitivity | Frequently changing policy, high political sensitivity, or pending adverse regulation |
| Competitive Dynamics | Has market rivalry intensified? Are strong new entrants emerging? | Concentrated market with few dominant players (e.g., duopoly) | Fragmented market with low barriers and aggressive new entrants |
| Balance Sheet Strength | Does the business carry manageable debt? Is liquidity adequate? | Low leverage with substantial cash reserves relative to obligations | High debt load, thin liquidity, or significant near-term refinancing risk |
| Management Quality | Is leadership stable, trustworthy, and invested alongside shareholders? | Long-tenured leadership with meaningful insider ownership | Frequent turnover, misaligned incentives, or negligible insider stakes |
| Customer Concentration | Is revenue concentrated among few buyers? Does demand persist through downturns? | Broad consumer base with demand that persists across economic cycles | Revenue dependent on a small number of clients or highly cyclical demand |
| Supplier Dependencies | Are input costs rising? Does the business rely on a small number of suppliers? | Diversified supplier base with stable input costs | Heavy reliance on a single supplier or narrow supply chain |
Note: PepsiCo and Kindred examples reflect late 2022 conditions and are used as illustrative teaching cases only.
Regulatory environment was where Kindred’s risk profile diverged most sharply from PepsiCo’s. Online gambling regulation was shifting frequently across multiple jurisdictions, creating ongoing policy uncertainty. PepsiCo faced no comparable regulatory headwind.
Competitive dynamics separated the two businesses clearly. PepsiCo operated in an approximate duopoly within its core beverage segment, implying lower competitive risk. Kindred operated in the fragmented iGaming market, where new entrants and aggressive competitors were a persistent feature.
Balance sheet strength offered a useful supplementary lens: PepsiCo carried a well-established credit profile with predictable cash generation, while Kindred’s balance sheet merited closer scrutiny given its growth-stage characteristics and regulatory capital requirements across jurisdictions.
Management quality required more nuance. PepsiCo insiders held approximately 0.2% of shares; Kindred insiders held approximately 1%. Both levels were modest. Insider alignment is a qualitative input rather than a binary threshold, but the direction of the signal matters.
Customer concentration was one dimension where both companies scored similarly. Both operated business-to-consumer models with products that retained demand across economic cycles, mitigating this risk factor for each.
Supplier dependencies flagged a specific, material risk for Kindred: its reliance on Kambi for sportsbook technology created a single-supplier vulnerability that PepsiCo’s diversified input structure did not share.
The checklist does not produce a single number. It produces a structured picture of where a business is strong, where it is exposed, and where the investor’s assumptions are most likely to prove wrong.
Applying the framework: what a structured risk assessment looks like in practice
Understanding the six dimensions conceptually is one step. Applying them as a practical workflow requires a specific sequence.
- Assess the business across all six dimensions. Work through regulatory environment, competitive dynamics, balance sheet strength, management quality, customer concentration, and supplier dependencies before looking at price or valuation.
- Form an overall risk rating. Based on the assessment, categorise the business as low, moderate, or high risk. The PepsiCo assessment (late 2022) would produce a lower overall risk rating than Kindred’s, given Kindred’s elevated scores on regulatory, competitive, and supplier dimensions.
- Determine the required margin of safety. The risk rating dictates how large a discount to estimated intrinsic value the investor needs before committing capital. A higher-risk business demands a wider margin. This number is set before any valuation modelling begins, not after.
The order matters. Assessing the six dimensions before calculating intrinsic value prevents the investor from anchoring on a valuation figure that does not yet account for the business quality underneath it. Two businesses with similar headline earnings yields can require very different margins of safety once the qualitative dimensions are factored in.
The framework scales across sectors. It applies equally to large-cap consumer goods companies, mid-cap industrial businesses, and smaller growth-stage companies. What changes is the specific signals within each dimension:
- Technology and platform businesses may require particular attention to competitive dynamics, where network effects and switching costs can shift rapidly.
- AI and software companies often face evolving regulatory environments, particularly around data privacy and algorithmic governance.
- Asset-light platform models may present fewer supplier dependencies but higher concentration risk in a single technology stack or cloud infrastructure provider.
The six-dimension structure itself remains applicable. The signals within each dimension adapt to the sector.
How risk levels connect to the margin of safety you require
The six dimensions are not an academic exercise. They feed directly into the most consequential decision in value investing: how much of a discount to estimated intrinsic value must exist before an investment is worth making.
The rule is straightforward. Higher assessed risk across the six dimensions requires a larger margin of safety. Lower assessed risk allows a narrower one. A business that scores well on regulatory stability, competitive dynamics, balance sheet strength, management quality, customer breadth, and supplier diversification can be purchased at a smaller discount because the probability of being wrong about the business is lower. A business with elevated risk across several dimensions demands a wider buffer precisely because the assumptions are less certain.
The discipline of identifying undervalued stocks requires combining the qualitative business assessment described here with quantitative filters, specifically price-to-earnings ratio, free cash flow yield, and debt-to-equity ratio, applied as overlapping screens rather than standalone rules, to reduce the risk of acting on a single misleading signal.
Seth Klarman described the margin of safety as the defining characteristic that separates value investors from other market participants: the discipline of purchasing assets at a meaningful discount to their estimated intrinsic value, acknowledging that valuation is imprecise, the future is unpredictable, and the investor is fallible.
The CFA Institute analysis of margin of safety traces the concept directly to Benjamin Graham’s original formulation, noting that practitioners from Graham through Klarman have consistently treated the buffer between price and value as the primary mechanism for absorbing estimation errors and unforeseen business deterioration.
Four practical scenarios where margin of safety appears
The margin of safety does not always take the same form. Four practical scenarios illustrate how it manifests in real investment conditions:
- Yield plus growth as margin of safety. A company already delivering the investor’s required return while also compounding its earnings. The growth provides an additional buffer on top of an already-adequate yield. Kindred illustrated a version of this in late 2022, with an approximately 8% earnings yield combined with a historically strong growth record.
- Excess yield as margin of safety. A company yielding more than the required return. The surplus yield itself constitutes the buffer. If an investor requires 10% and the business delivers 14%, the 4% surplus absorbs estimation errors.
- Cash holdings as margin of safety. A company yielding approximately the required return while holding a substantial net cash position. The cash provides the buffer. Benjamin Graham was particularly associated with this approach, identifying companies whose balance sheets contained enough cash to protect against downside even if the business underperformed.
- Asset backing as margin of safety. A company trading below the liquidation value of its tangible assets, so that the investor is protected even in a scenario where the business fails to generate the anticipated cash flows. Graham’s net-net framework is the classic expression of this form.
Each scenario links directly back to the six-dimension assessment. A business rated low-risk might qualify under Scenario 1 or 2 with a modest yield premium. A business rated high-risk might require the additional protection of Scenario 3 or 4, or a combination of scenarios, before the investment clears the bar.
The margin of safety is not a formula to calculate. It is a discipline to apply, requiring the investor to hold back from investing until the price creates a genuine buffer against the specific risks the six dimensions have identified.
This article is for informational purposes only and should not be considered financial advice. Investors should conduct their own research and consult with financial professionals before making investment decisions.
The sharper lens: why redefining risk changes every investment decision
This article has built a two-part shift. The first part moves the definition of risk from volatility to permanent capital loss. The second replaces intuitive judgment with a structured six-dimension assessment that produces a specific, defensible view of business quality before price enters the conversation.
That reframe benefits all investors, not only those who identify as value investors. It forces attention onto business fundamentals before price. It introduces a discipline of holding back until the margin of safety is present. And it replaces the question most investors ask during a sell-off, “how much further might it fall,” with one that is far more productive: have any of the six business dimensions changed in a way that would justify revising my assessment of this company?
If the answer is no, a falling price is not a risk signal. It is a widening margin of safety.
For investors wanting to translate the six-dimension risk framework and margin of safety discipline into a structured, pre-committed portfolio approach, our comprehensive walkthrough of rules-based investing strategies covers dollar-cost averaging, rebalancing triggers, and quality stock selection criteria, with worked examples of how pre-commitment devices prevent the behavioural errors this framework is specifically designed to guard against.
The practitioner tradition behind this framework, from Graham to Klarman to Buffett, has consistently treated the margin of safety as a discipline against overconfidence rather than a formula against loss. The six dimensions give that discipline its structure. The redefinition of risk gives it its foundation.
“Past performance does not guarantee future results. Financial projections are subject to market conditions and various risk factors.”
—
—