VAS vs VHY: Why the Lower-Yield ETF Wins in Retirement
1 hr ago

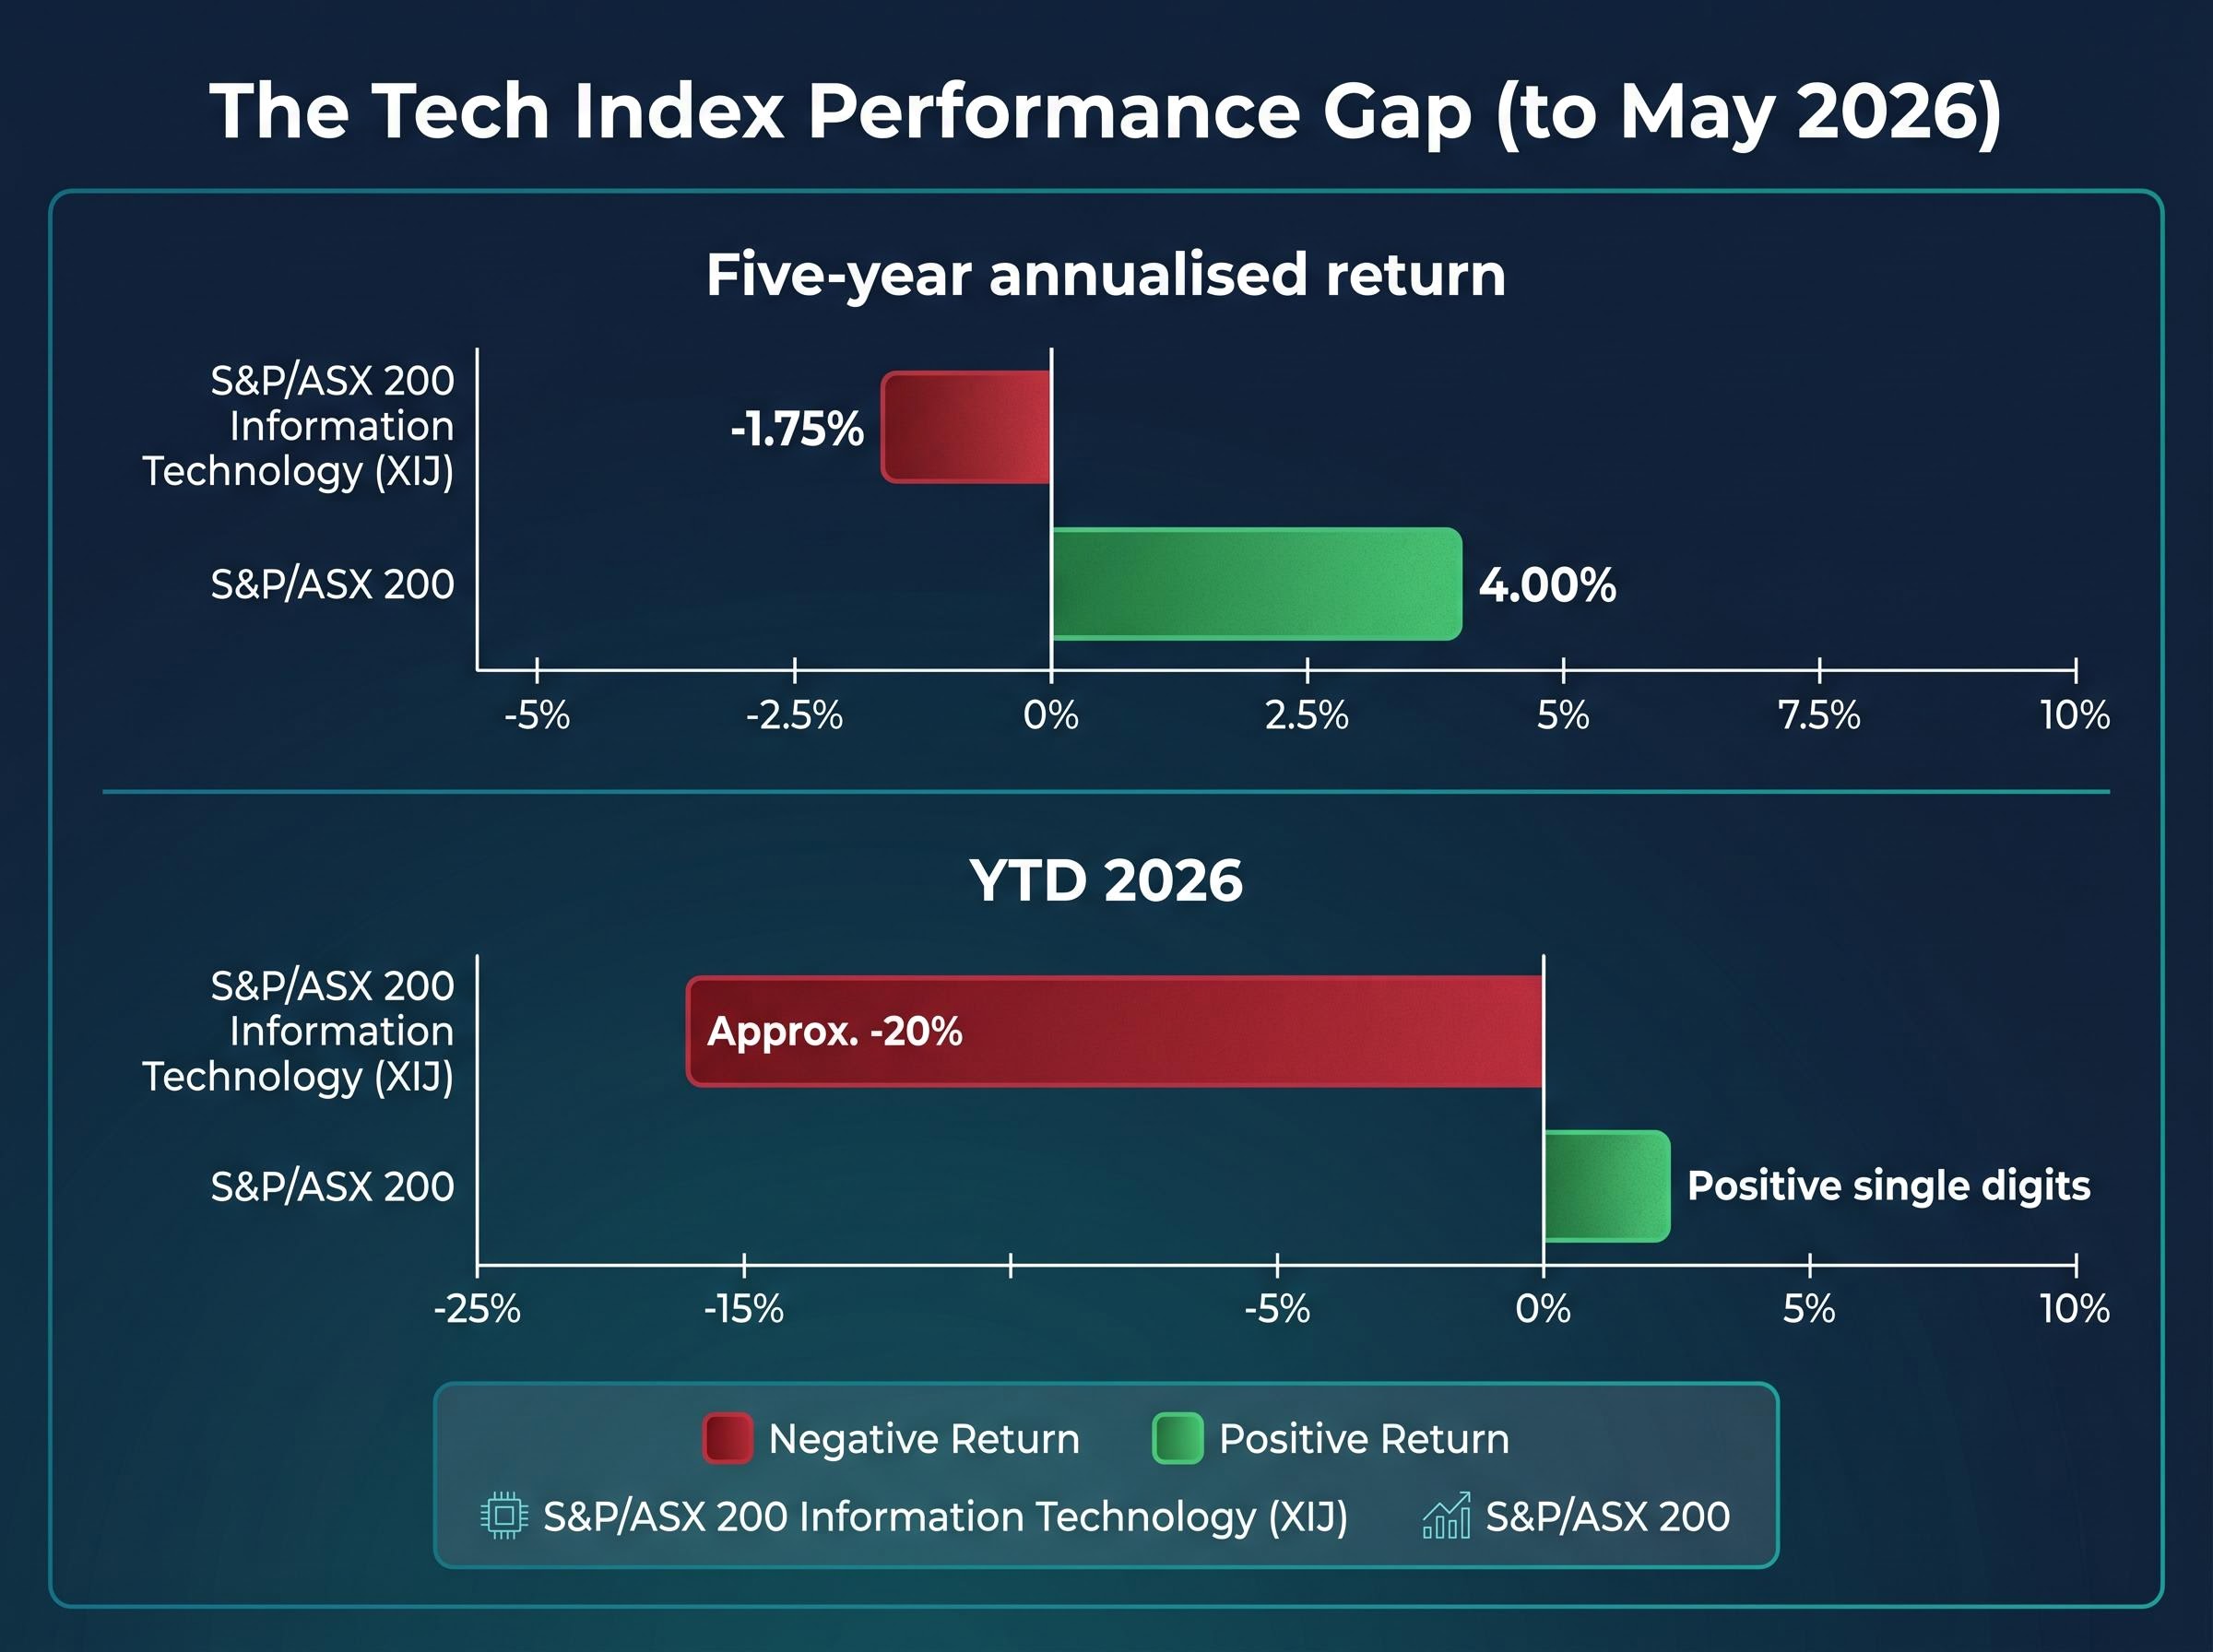
The S&P/ASX 200 Information Technology Index has delivered an average annualised return of -1.75% over five years. The broader ASX 200 returned 4.00% over the same period. Yet fund managers, SMSF trustees, and retail investors continue to buy ASX tech stocks, and in many cases, they are increasing their allocations.
The contradiction is not irrational. The index-level return and the investment case for individual software businesses are measuring different things. In early 2026, the XIJ is down approximately 20% year-to-date, making the question of why investors persist even more pointed. This article unpacks the structural economics that make high-quality software businesses compelling despite weak headline sector returns, covering gross margins, recurring revenue, and global scalability in plain language, with Australian examples.
Five-year annualised returns (to May 2026): The S&P/ASX 200 Information Technology Index returned -1.75% per year, while the ASX 200 returned 4.00% per year.
The gap is not subtle, and it has not narrowed in 2026. Through early May 2026, the XIJ has fallen approximately 20% year-to-date while the broader ASX 200 sits in positive single-digit territory.
| Index | Five-year annualised return | YTD 2026 (to early May) |
|---|---|---|
| S&P/ASX 200 Information Technology (XIJ) | -1.75% | Approx. -20% |
| S&P/ASX 200 | 4.00% | Positive single digits |
These are not abstract numbers. Xero, the sector’s most recognisable name, has declined approximately 32.4% since the start of 2025 as at May 2026. An investor who bought the XIJ five years ago would have underperformed a simple ASX 200 index fund by a cumulative margin that compounds into a meaningful opportunity cost.
And yet capital keeps flowing in. Understanding why requires looking past the index headline.
Software sector selectivity has intensified in 2026 to a degree that makes index-level analysis almost meaningless for individual stock decisions; Morningstar data shows the spread between the top and bottom deciles of US technology stocks reached a record 133 percentage points year-to-date, confirming that being right about the sector is not the same as being right about a specific company within it.
An index-level return blends every constituent into a single number. For the XIJ, that means profitable, cash-generative SaaS platforms sit alongside loss-making speculative tech names, and the two categories have almost nothing in common as investments.
The distinction matters because investor behaviour has shifted accordingly. Both institutional and retail participants have moved away from concept stocks toward established, profitable platforms. The names cited consistently in fund manager commentary from 2024 through 2026 are Xero, WiseTech, and TechnologyOne, not pre-revenue start-ups.
Nick Griffin of Munro Partners told Livewire Markets in February 2025 that investor interest had “come back strongly as rates stabilise and earnings visibility improves,” with the focus squarely on recurring revenue, global addressable markets, and high incremental margins. A WaveStone and First Sentier panel discussion reported by Livewire in August 2025 confirmed the same shift: institutional investors had moved from concept stocks to established platforms with strong free cash flow.
Retail trading volumes in large-cap ASX tech also rose through late 2025, according to the Australian Financial Review. The question investors are asking is not “how did the XIJ perform?” but “which specific business models within tech are worth owning, and why?”
The answer starts with what it actually costs to deliver software to one more customer.
When a traditional business sells a physical product, each unit carries material costs, manufacturing expenses, and shipping. A software company builds the product once and delivers it digitally. The direct cost of serving an additional subscriber (hosting, support infrastructure) is a fraction of the subscription fee. That gap between revenue and direct delivery cost is the gross margin, and for high-quality SaaS businesses, it is unusually wide.
“Once you’ve built the software, every incremental customer is almost pure margin.” — Ben Clark, TMS Capital (Livewire Markets, February 2026)
Three structural advantages separate the economics of software from traditional businesses:
The Rule of 40 benchmark formalises this relationship between growth and margin into a single score, where a company’s revenue growth rate and profit margin must together reach 40 to signal a healthy SaaS business; as of Q4 2025, only around 20% of tracked public SaaS companies cleared that threshold, confirming that the economics separating quality names from the broader sector are genuinely rare.
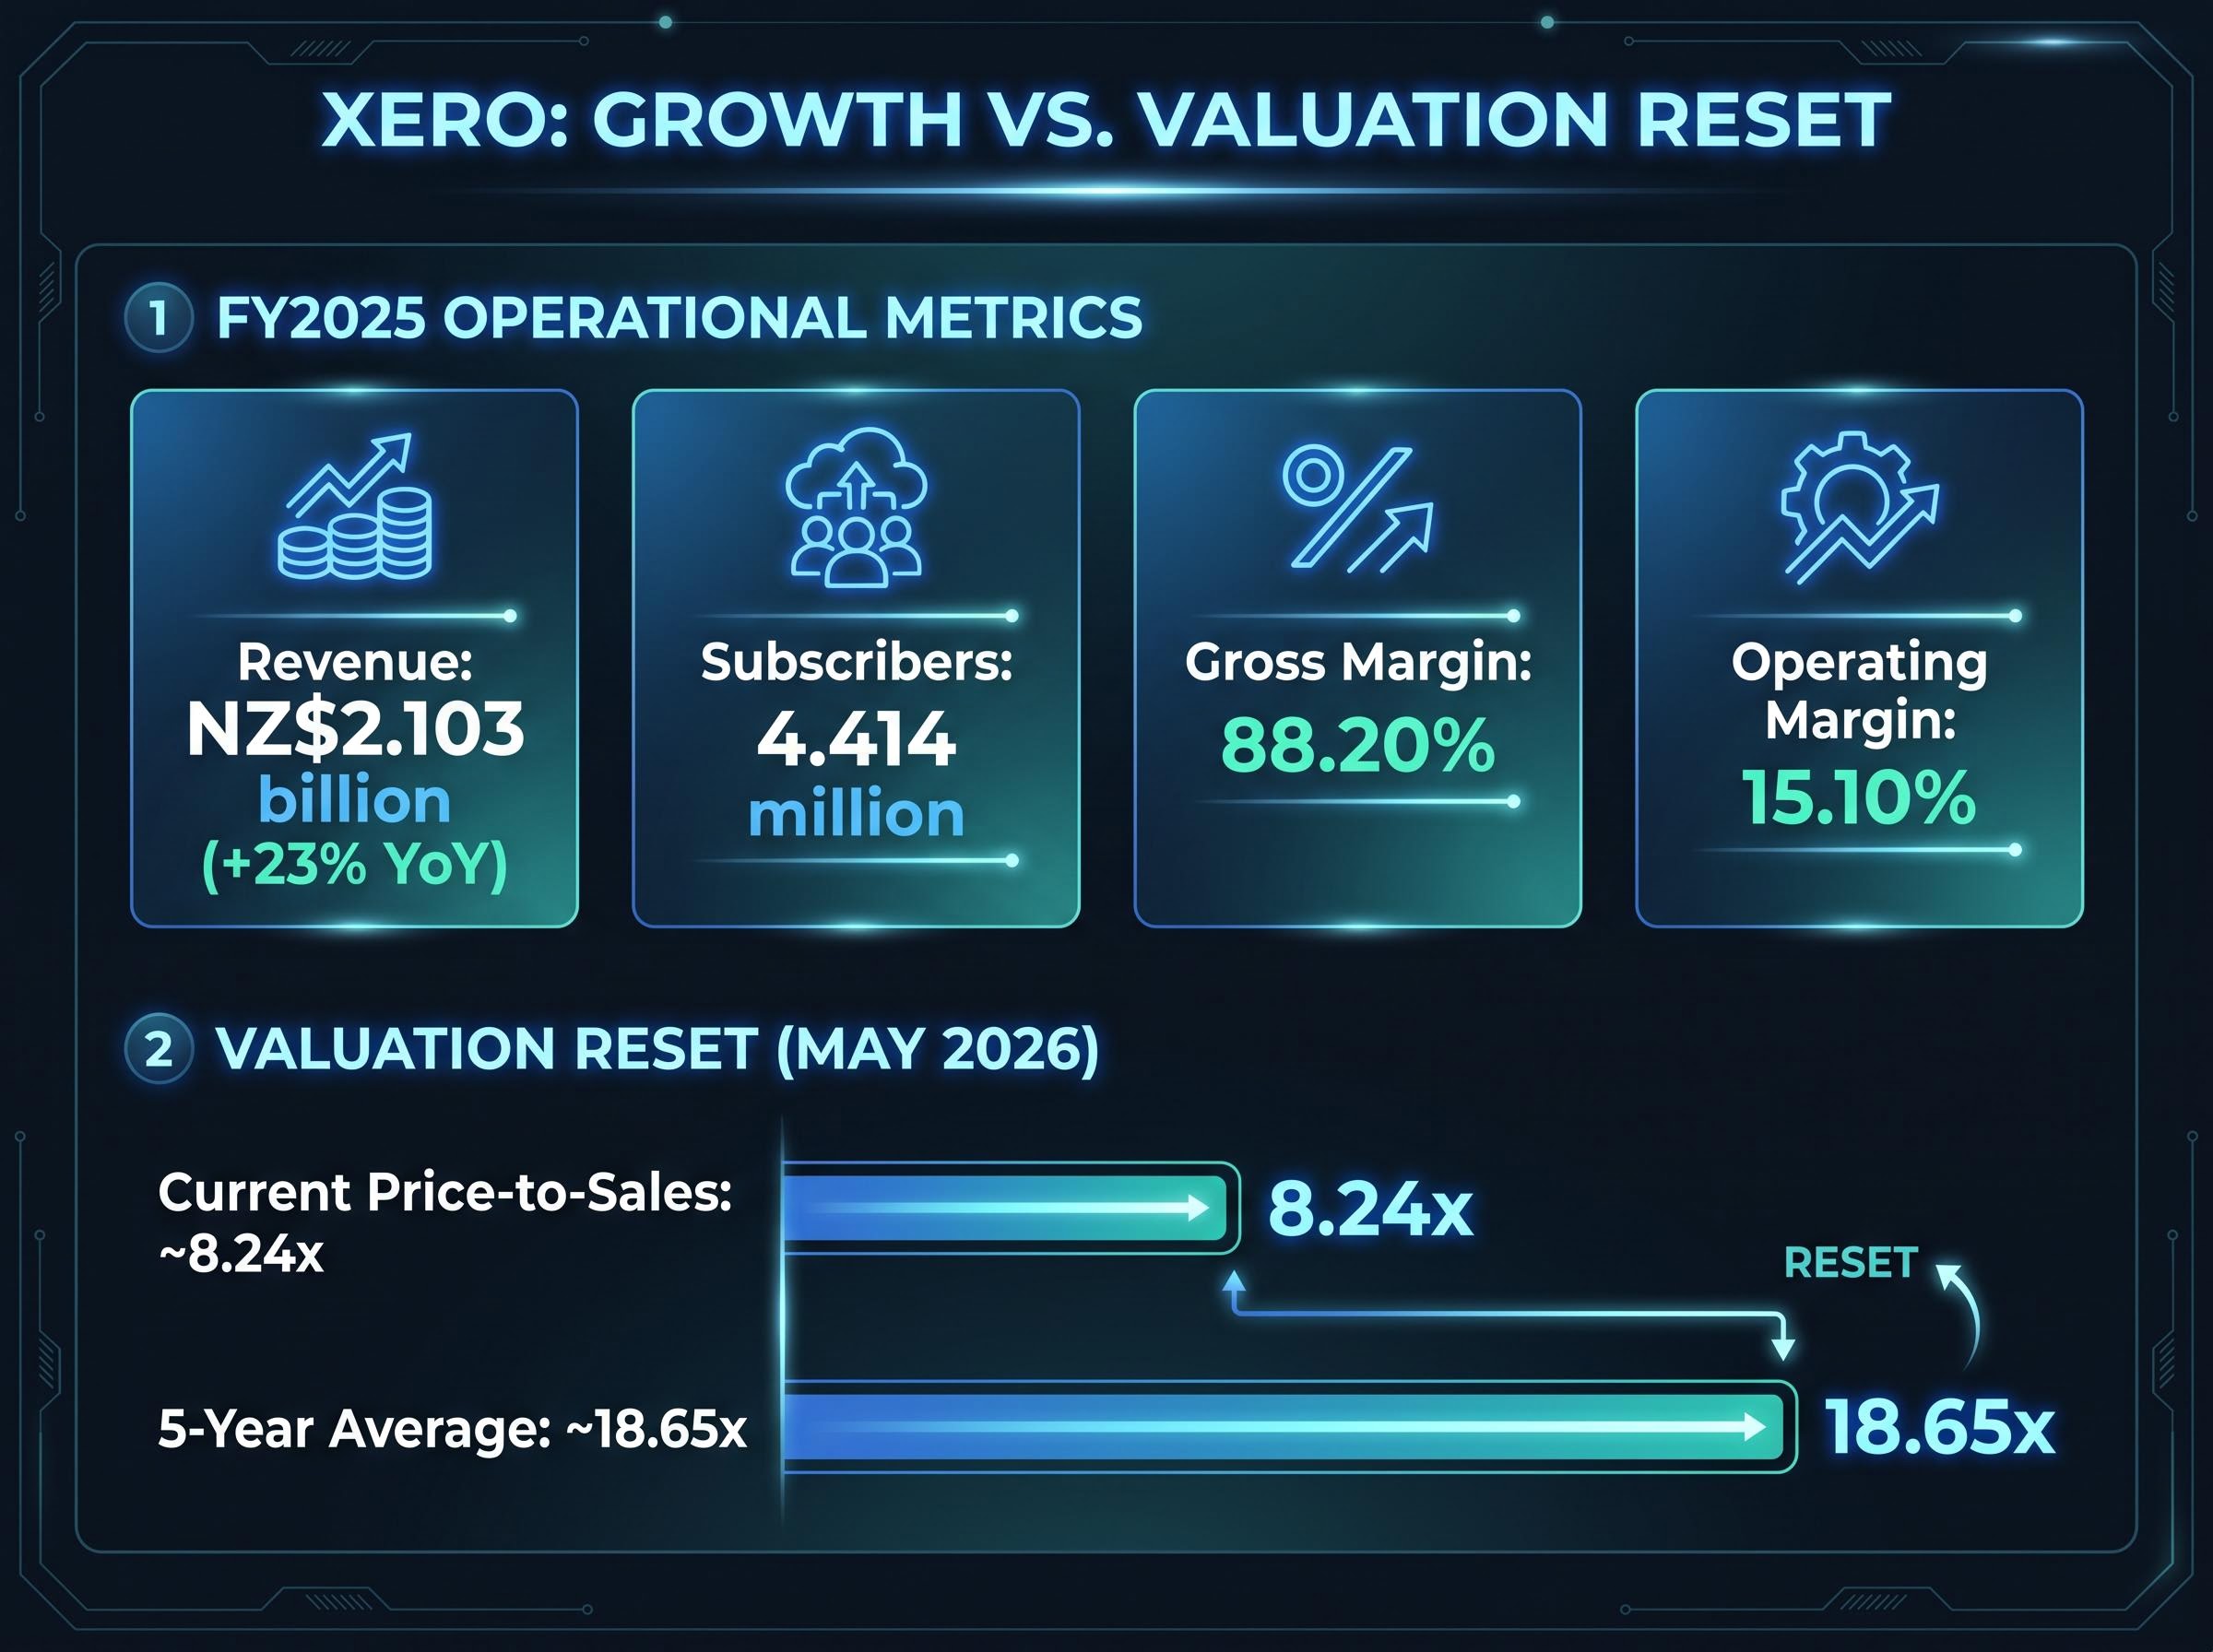
Xero’s operating margin stands at 15.10%, reflecting ongoing investment in product development and international expansion. The gap between the 88.20% gross margin and the 15.10% operating margin illustrates that these businesses are still investing heavily in growth, but the underlying unit economics are structurally favourable.
The economic logic extends geographically. Because software is delivered over the internet, ASX-listed tech companies face none of the traditional barriers to international expansion.
Consider the difference:
Software business expanding internationally:
Traditional physical business expanding internationally:
This distinction is why investors value global addressable market size differently for software companies. A domestic retailer doubling its store count faces proportional capital expenditure. A software company doubling its subscriber count across new geographies faces a fraction of that cost.
Xero’s FY2025 result (announced 15 May 2025) demonstrated this dynamic concretely. Operating revenue reached NZ$2.103 billion, up 23% year-on-year, with subscriber growth from the UK and North America cited as drivers. Total subscribers reached 4.414 million across multiple countries.
Emma Fisher of Airlie noted in a March 2025 Livewire Markets discussion that Australia offers “a handful of globally competitive software champions” that investors should distinguish from speculative tech. A Wellington-founded accounting software company generating over NZ$2 billion in annual revenue from subscribers in dozens of countries illustrates why the growth profile is structurally different from a domestic-only business.
Understanding the business model is one step. Understanding what the market is currently pricing in is another.
For growth-oriented software companies that may not yet report high earnings, a commonly used measure is the price-to-sales ratio: the share price relative to revenue per share. It provides a quick comparison of how much investors are paying for each dollar of revenue the business generates.
The valuation reset since the 2020-2021 peak has been substantial. Xero’s current price-to-sales ratio sits at approximately 8.24x, according to the Rask Invest Research Team (May 2026). Its five-year historical average is approximately 18.65x.
| Metric | Current (May 2026) | Five-year historical average |
|---|---|---|
| Xero price-to-sales ratio | ~8.24x | ~18.65x |
Jun Bei Liu of Tribeca told Livewire Markets in June 2025 that several quality tech names were trading at price-to-sales multiples “well below their 5-year averages.” Broker analysis cited by the AFR’s Chanticleer column in April 2025 noted that ASX software names generally trade at a discount to comparable US SaaS firms, despite similar growth and margin profiles.
The XRO valuation discount relative to historical norms sits at approximately 53%, with the current price-to-sales ratio of around 8.70x against a five-year average of 18.65x, a compression driven by macro rate sensitivity rather than any deterioration in the underlying business metrics that make Xero a frequently cited example of quality SaaS economics.
That relative discount is one reason Australian investors, including SMSF holders, maintain ASX tech allocations. As James Kirby reported in The Australian in June 2025, SMSF allocations to large-cap ASX tech are driven partly by a preference for Australian-listed growth over US currency and valuation risk.
Price-to-sales is a starting point, not a conclusion. It ignores profitability, capital structure, and cash conversion. A discounted cash flow (DCF) analysis, which estimates a company’s value based on projected future cash flows, provides a more complete picture. Multiple research providers including Motley Fool and Rask Invest recommend multi-metric approaches as superior to relying on any single ratio.
The structural characteristics that differentiate quality ASX software names from the sector index average are consistent across expert commentary from 2024 through 2026:
Matthew Kidman of Centennial Asset Management and Mary Manning of Alphinity argued in a May 2024 Livewire Markets discussion that recurring revenue, low churn, and high gross margins make SaaS businesses “compelling long-term investments.” Tristan Harrison of Motley Fool wrote in March 2026 that high-quality ASX software names were trading “on far lower price-to-sales and EV/revenue multiples than during the pandemic boom,” framing the reset as an opportunity for long-term investors.
The AFR reported in November 2025 that retail investors were attracted by “cleaner balance sheets, visible cash generation, and de-rated multiples compared with the 2020 peak.”
Performance periods matter. A five-year window that captured a speculative bubble and its subsequent crash is not necessarily the appropriate lens for evaluating a long-term investment thesis. Equally, not every ASX tech company has these characteristics; the index blends many that do not. Valuation discipline remains relevant regardless of how compelling the structural case appears.
The XIJ’s negative five-year average annualised return reflects the composition and timing of the index, not the investment merits of individual high-quality SaaS businesses within it. The sector carries real risks: 2026 year-to-date performance underscores sensitivity to market conditions, valuations remain exposed to interest rate movements, and competitive dynamics continue to evolve.
For investors who want to stress-test the structural case before committing capital, our deep-dive into AI disruption risks for SaaS business models examines how autonomous AI agents are dismantling traditional per-seat licensing economics, where the $2 trillion wealth destruction in US software markets in early 2026 concentrated, and which pricing model characteristics separated the casualties from the survivors.
The structural case, however, is specific. High gross margins, recurring revenue, low incremental delivery costs, and global scalability are measurable characteristics that separate a subset of ASX-listed software businesses from both speculative tech names and the broader index average. As earnings visibility improves and valuations sit below historical averages, that structural case persists for investors willing to conduct company-level analysis rather than relying on sector-wide generalisations.
Readers seeking further context may find value in exploring ASX technology sector performance data, frameworks for reading a SaaS company’s financial results, or individual company profiles for names such as Xero, WiseTech, and TechnologyOne.
This article is for informational purposes only and should not be considered financial advice. Investors should conduct their own research and consult with financial professionals before making investment decisions. Past performance does not guarantee future results.
A SaaS gross margin measures the percentage of revenue left after direct delivery costs like hosting and support infrastructure. For quality ASX software businesses, gross margins typically sit between 75% and 90%, meaning each additional subscriber generates revenue at very low incremental cost, which supports strong profitability as the customer base grows.
The S&P/ASX 200 Information Technology Index blends profitable, cash-generative SaaS platforms with loss-making speculative concept stocks, and its five-year return of -1.75% per year reflects a bubble valuation peak in 2020-2021 followed by a significant de-rating. The index-level return does not represent the investment merits of individual high-quality software businesses within it.
A price-to-sales ratio compares a company's share price to its revenue per share, giving investors a quick measure of how much they are paying for each dollar of revenue the business generates. It is commonly used for growth-oriented software companies that may not yet report high earnings, though analysts recommend combining it with profitability and cash flow measures for a more complete picture.
Software companies can expand internationally by delivering the same codebase digitally to customers in any country, avoiding the warehousing, import duties, local manufacturing, and distribution costs that compress margins for physical businesses. This means a company like Xero can grow subscribers in the UK and North America at a fraction of the capital cost required for a comparable physical expansion.
Fund managers and institutional investors cited in commentary from 2024 through 2026 consistently focus on Xero, WiseTech, and TechnologyOne as established, profitable platforms with recurring subscription revenue, high gross margins, and global addressable markets, distinguishing them from speculative pre-revenue concept stocks.