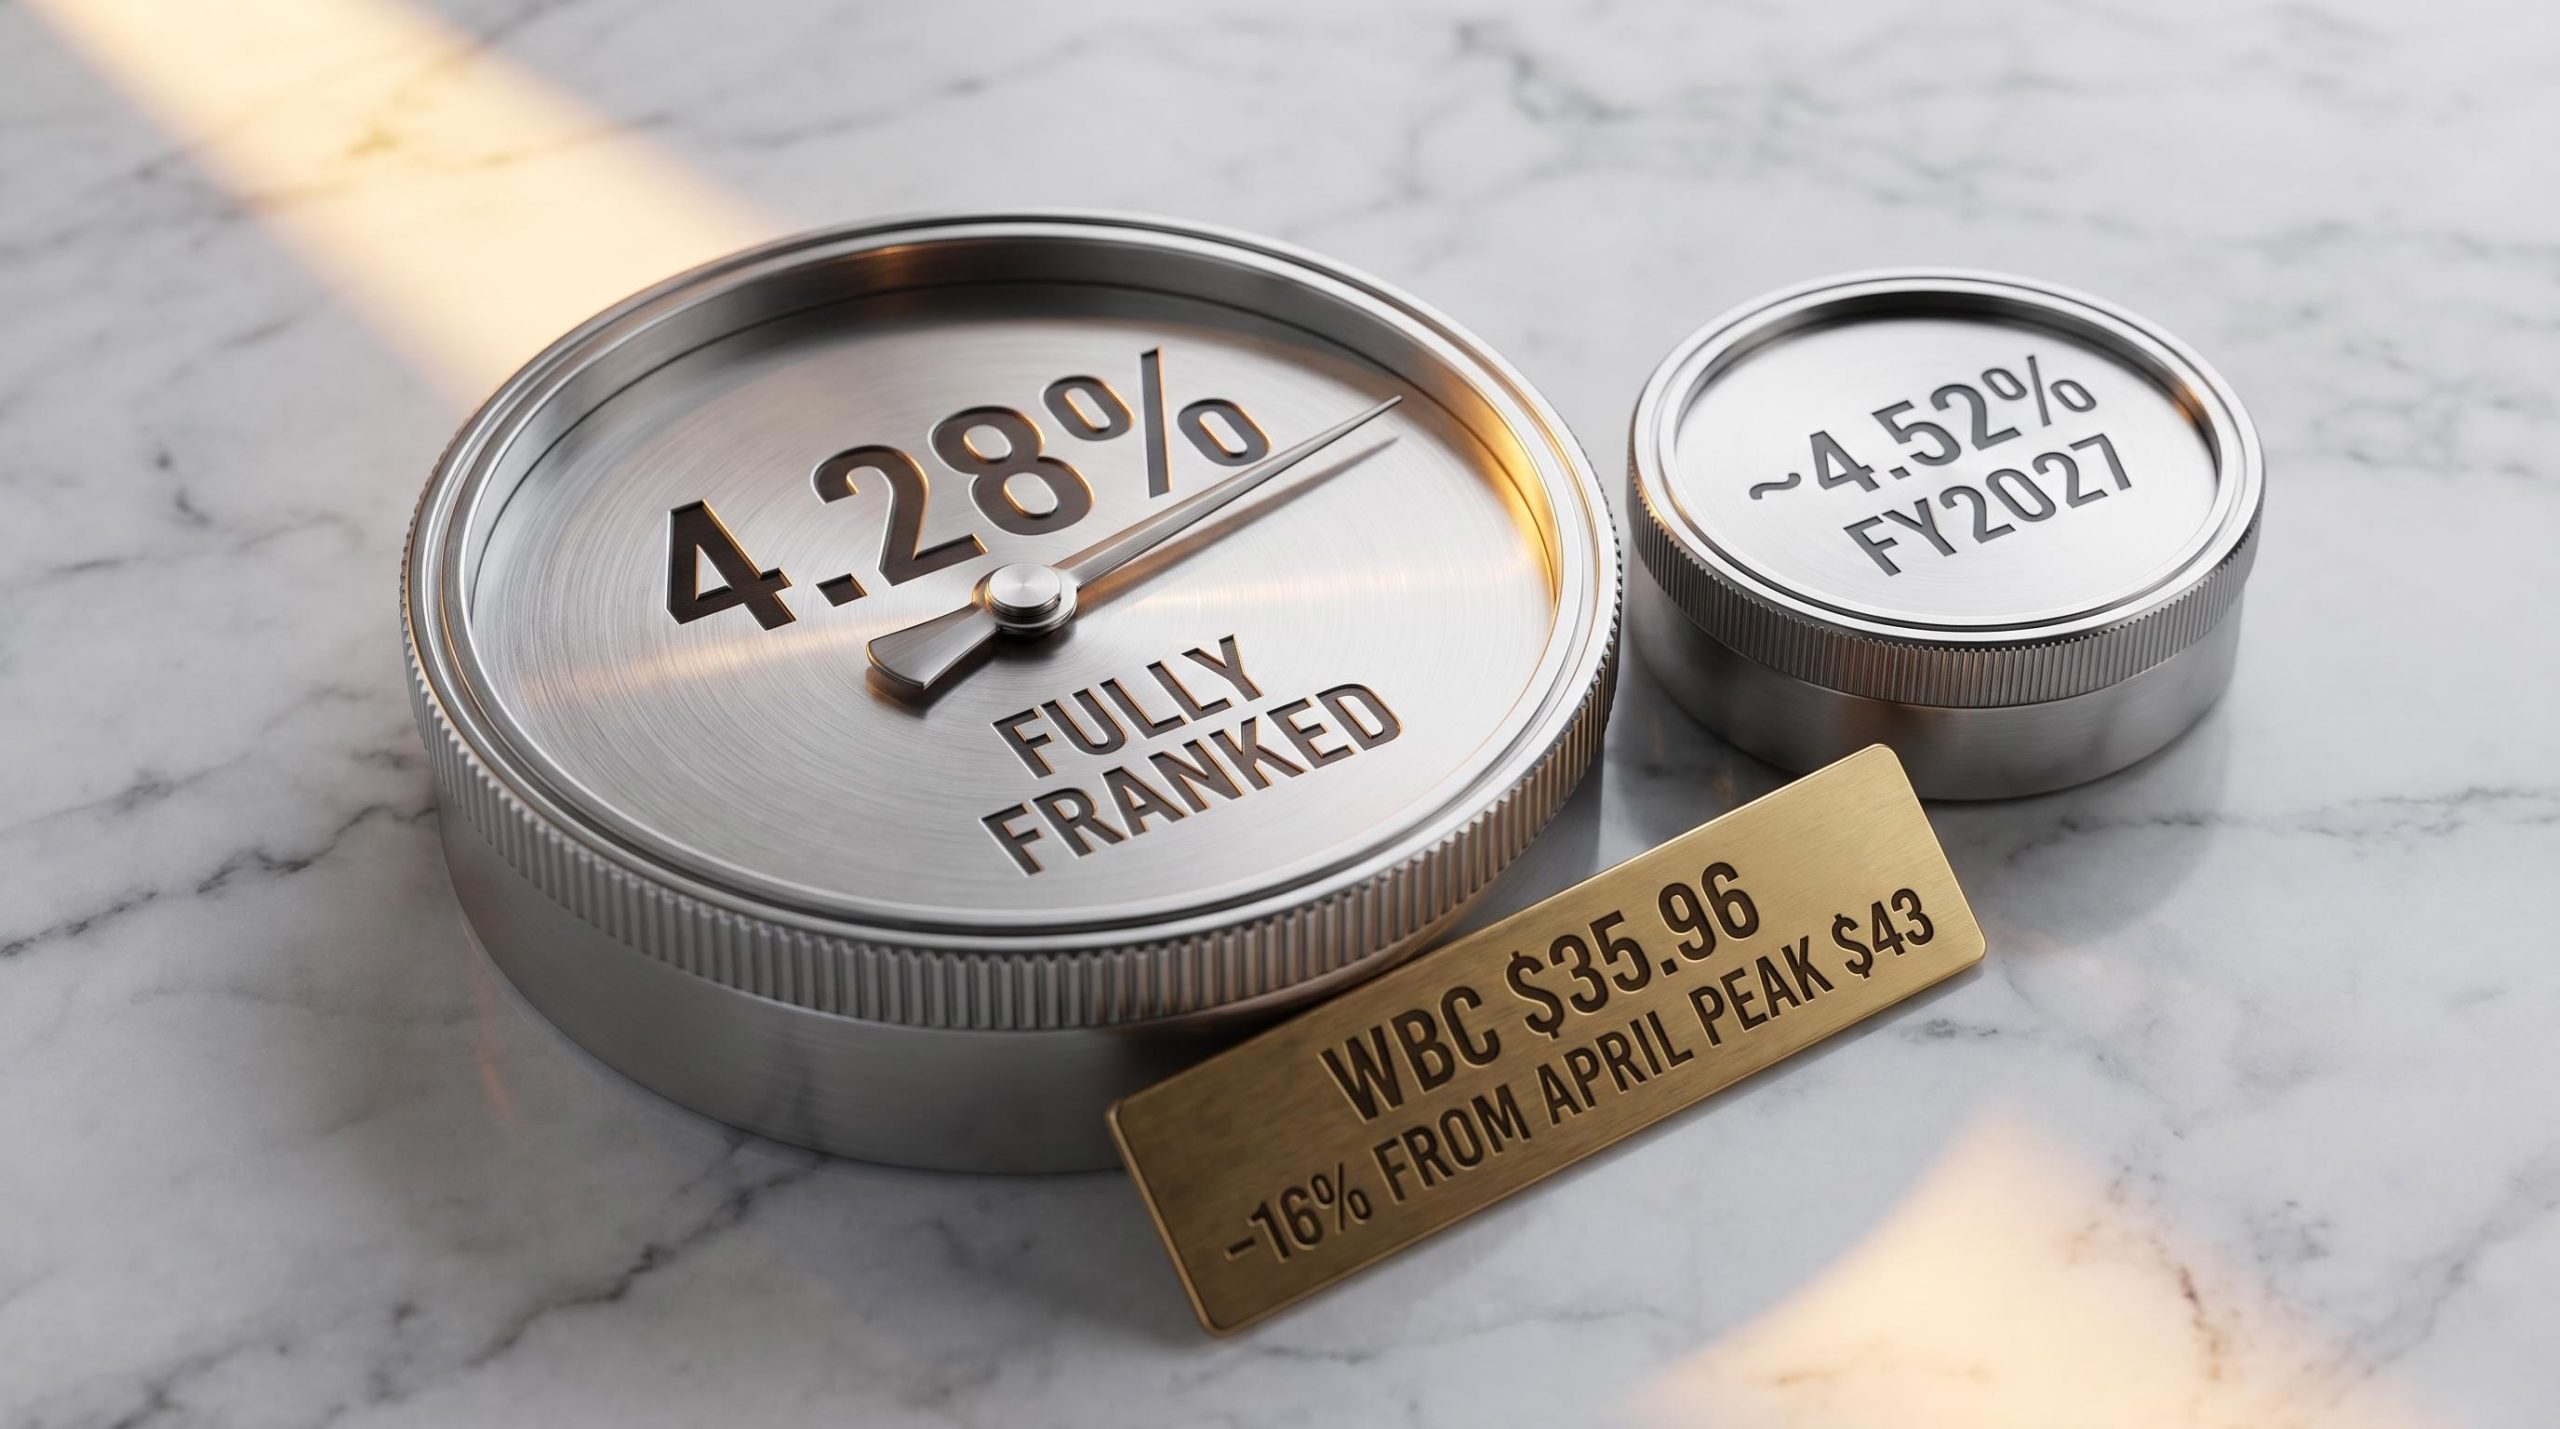
Westpac shares are sitting 16% below their April 2026 peak of approximately $43, and for income-focused investors that price pullback is doing something mathematically useful: it is pushing the trailing dividend yield higher. At $35.96 per share as of 18 May 2026, Westpac’s trailing yield has reached 4.28%, fully franked.
The broader ASX 200 has sold off sharply, down roughly 1.4% on the day and sitting just above 8,500 points. Westpac’s year-to-date return stands at negative 7.8%, and the June 2026 interim dividend payment is approaching. Income investors weighing whether the yield is genuinely attractive or a value trap need a clear-eyed framework. This analysis unpacks what Westpac’s current yield figures actually represent, how the franking credit mechanism enhances the real income case for different investor types, what analysts project through FY2027, and what risks attach to those forward projections.
What the 4.28% trailing yield actually tells you (and what it does not)
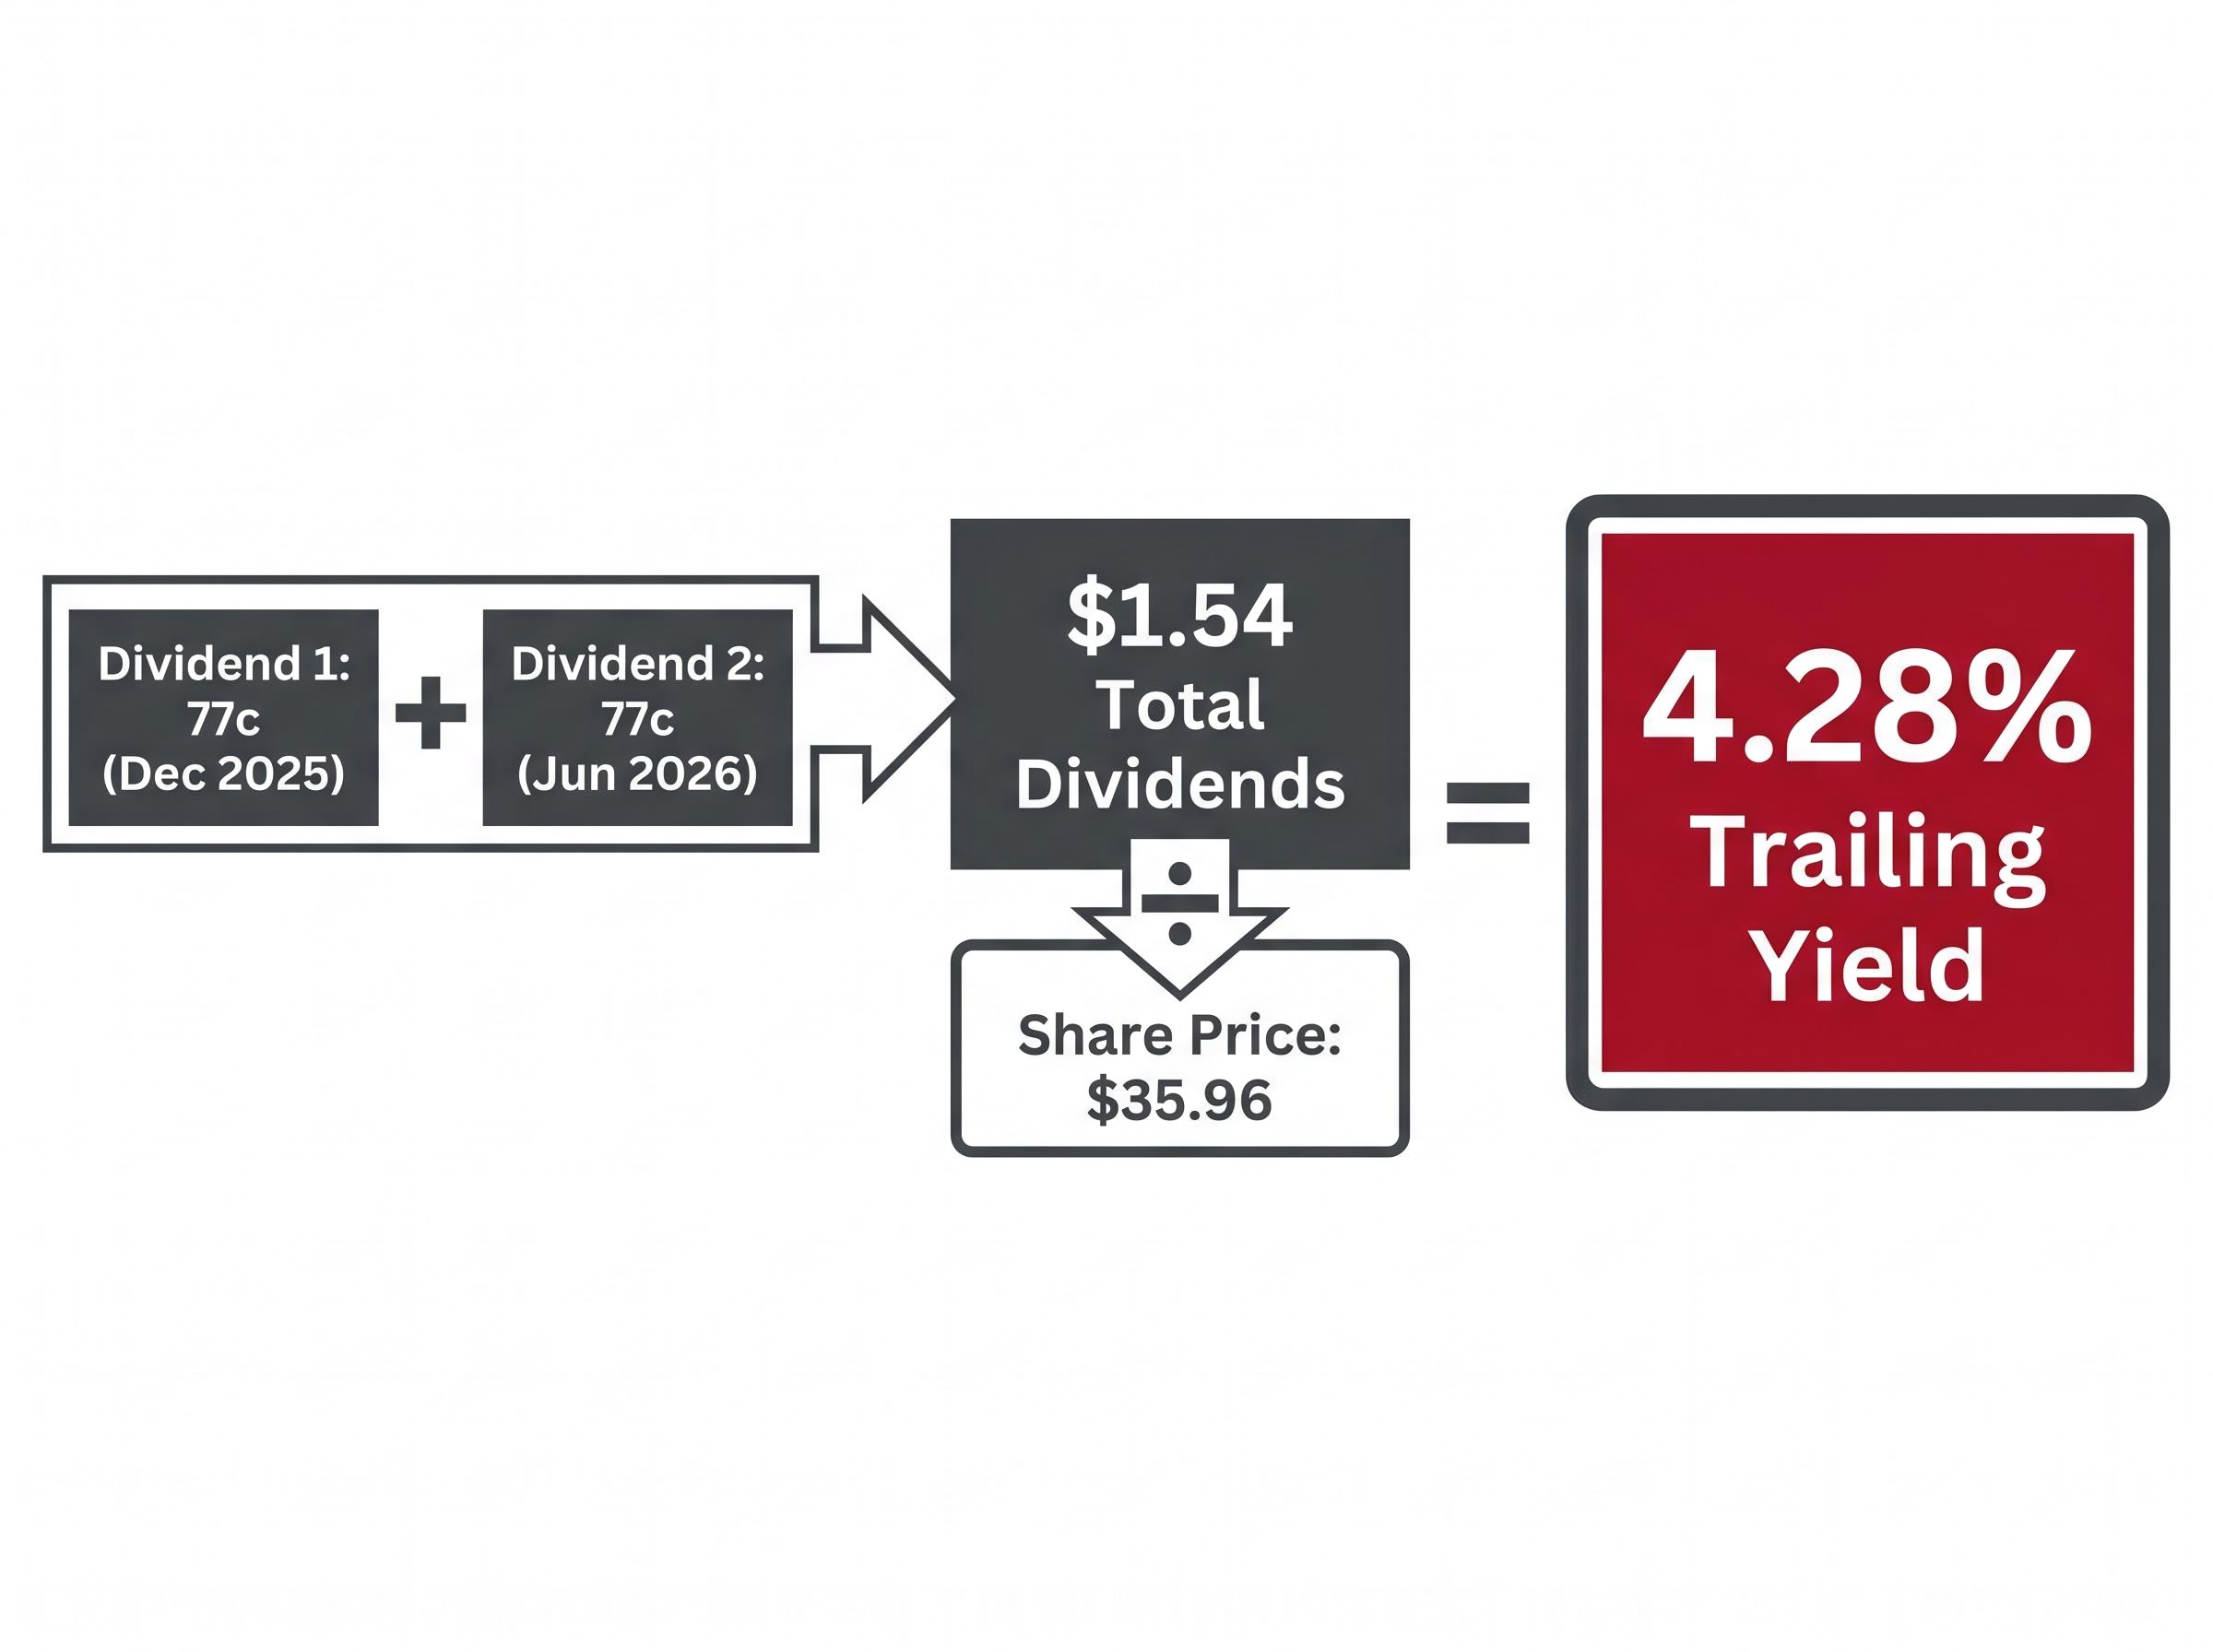
Westpac’s 4.28% trailing yield is an arithmetic result, not a dividend promise. It is calculated by taking the two most recent fully franked dividends and dividing them by the current share price. The three components are straightforward:
- Dividend 1: 77 cents per share (final dividend, December 2025)
- Dividend 2: 77 cents per share (interim dividend, due 26 June 2026, already ex-dividend at time of writing)
- Denominator: Current share price of $35.96
That gives $1.54 in total dividends divided by $35.96, producing the 4.28% figure. The distinction between trailing and forward yield matters here. Trailing yield measures what has already been declared. Forward yield measures what analysts expect the next twelve months of payments to deliver. The two figures can diverge meaningfully if dividend growth stalls, accelerates, or reverses.
A falling share price inflates the trailing yield figure without any change in the underlying dividend. The 16% decline from the $43 April peak has mechanically pushed the yield higher, but the dividend itself has not increased.
Investors who read a rising trailing yield as confirmation of a strengthening income stream risk misjudging the entry point. The 4.28% is context, not conviction.
The gap between trailing yield and total return is where many income-focused investors lose ground: a rising yield driven by a falling share price is a mathematical artifact, not an income improvement, and research across more than 500 large-cap stocks confirms that ex-dividend price drops average approximately 99.8% of the payout amount.
When big ASX news breaks, our subscribers know first
How franking credits change the real income equation for Australian investors
Westpac’s dividends are fully franked, which means the 30% corporate tax rate has already been paid by the bank before the cash reaches shareholders. That pre-payment is passed along as a franking credit, and for many Australian investors it materially changes the effective income yield.
What fully franked means in practice
The grossed-up dividend is calculated by adding the franking credit back to the cash payment. For Westpac’s 77-cent interim dividend, the franking credit equals approximately 33 cents (calculated as 77 ÷ 0.70 × 0.30), producing a grossed-up dividend of roughly $1.10 per share. The grossed-up amount is included in assessable income, with the franking credit then applied as a tax offset.
The franking credit calculation follows a fixed formula: the cash dividend is multiplied by 30 and divided by 70, reflecting the 30% corporate tax rate already paid at the company level before the dividend reaches shareholders, and for pension-phase investors this produces a refundable credit rather than a tax offset against other income.
The interim dividend is already ex-dividend at the time of writing, meaning investors purchasing shares now will not receive the 26 June 2026 payment. The next opportunity to capture a Westpac dividend will be the FY26 final dividend, expected to be declared with the full-year result later in 2026.
After-tax yield by investor type
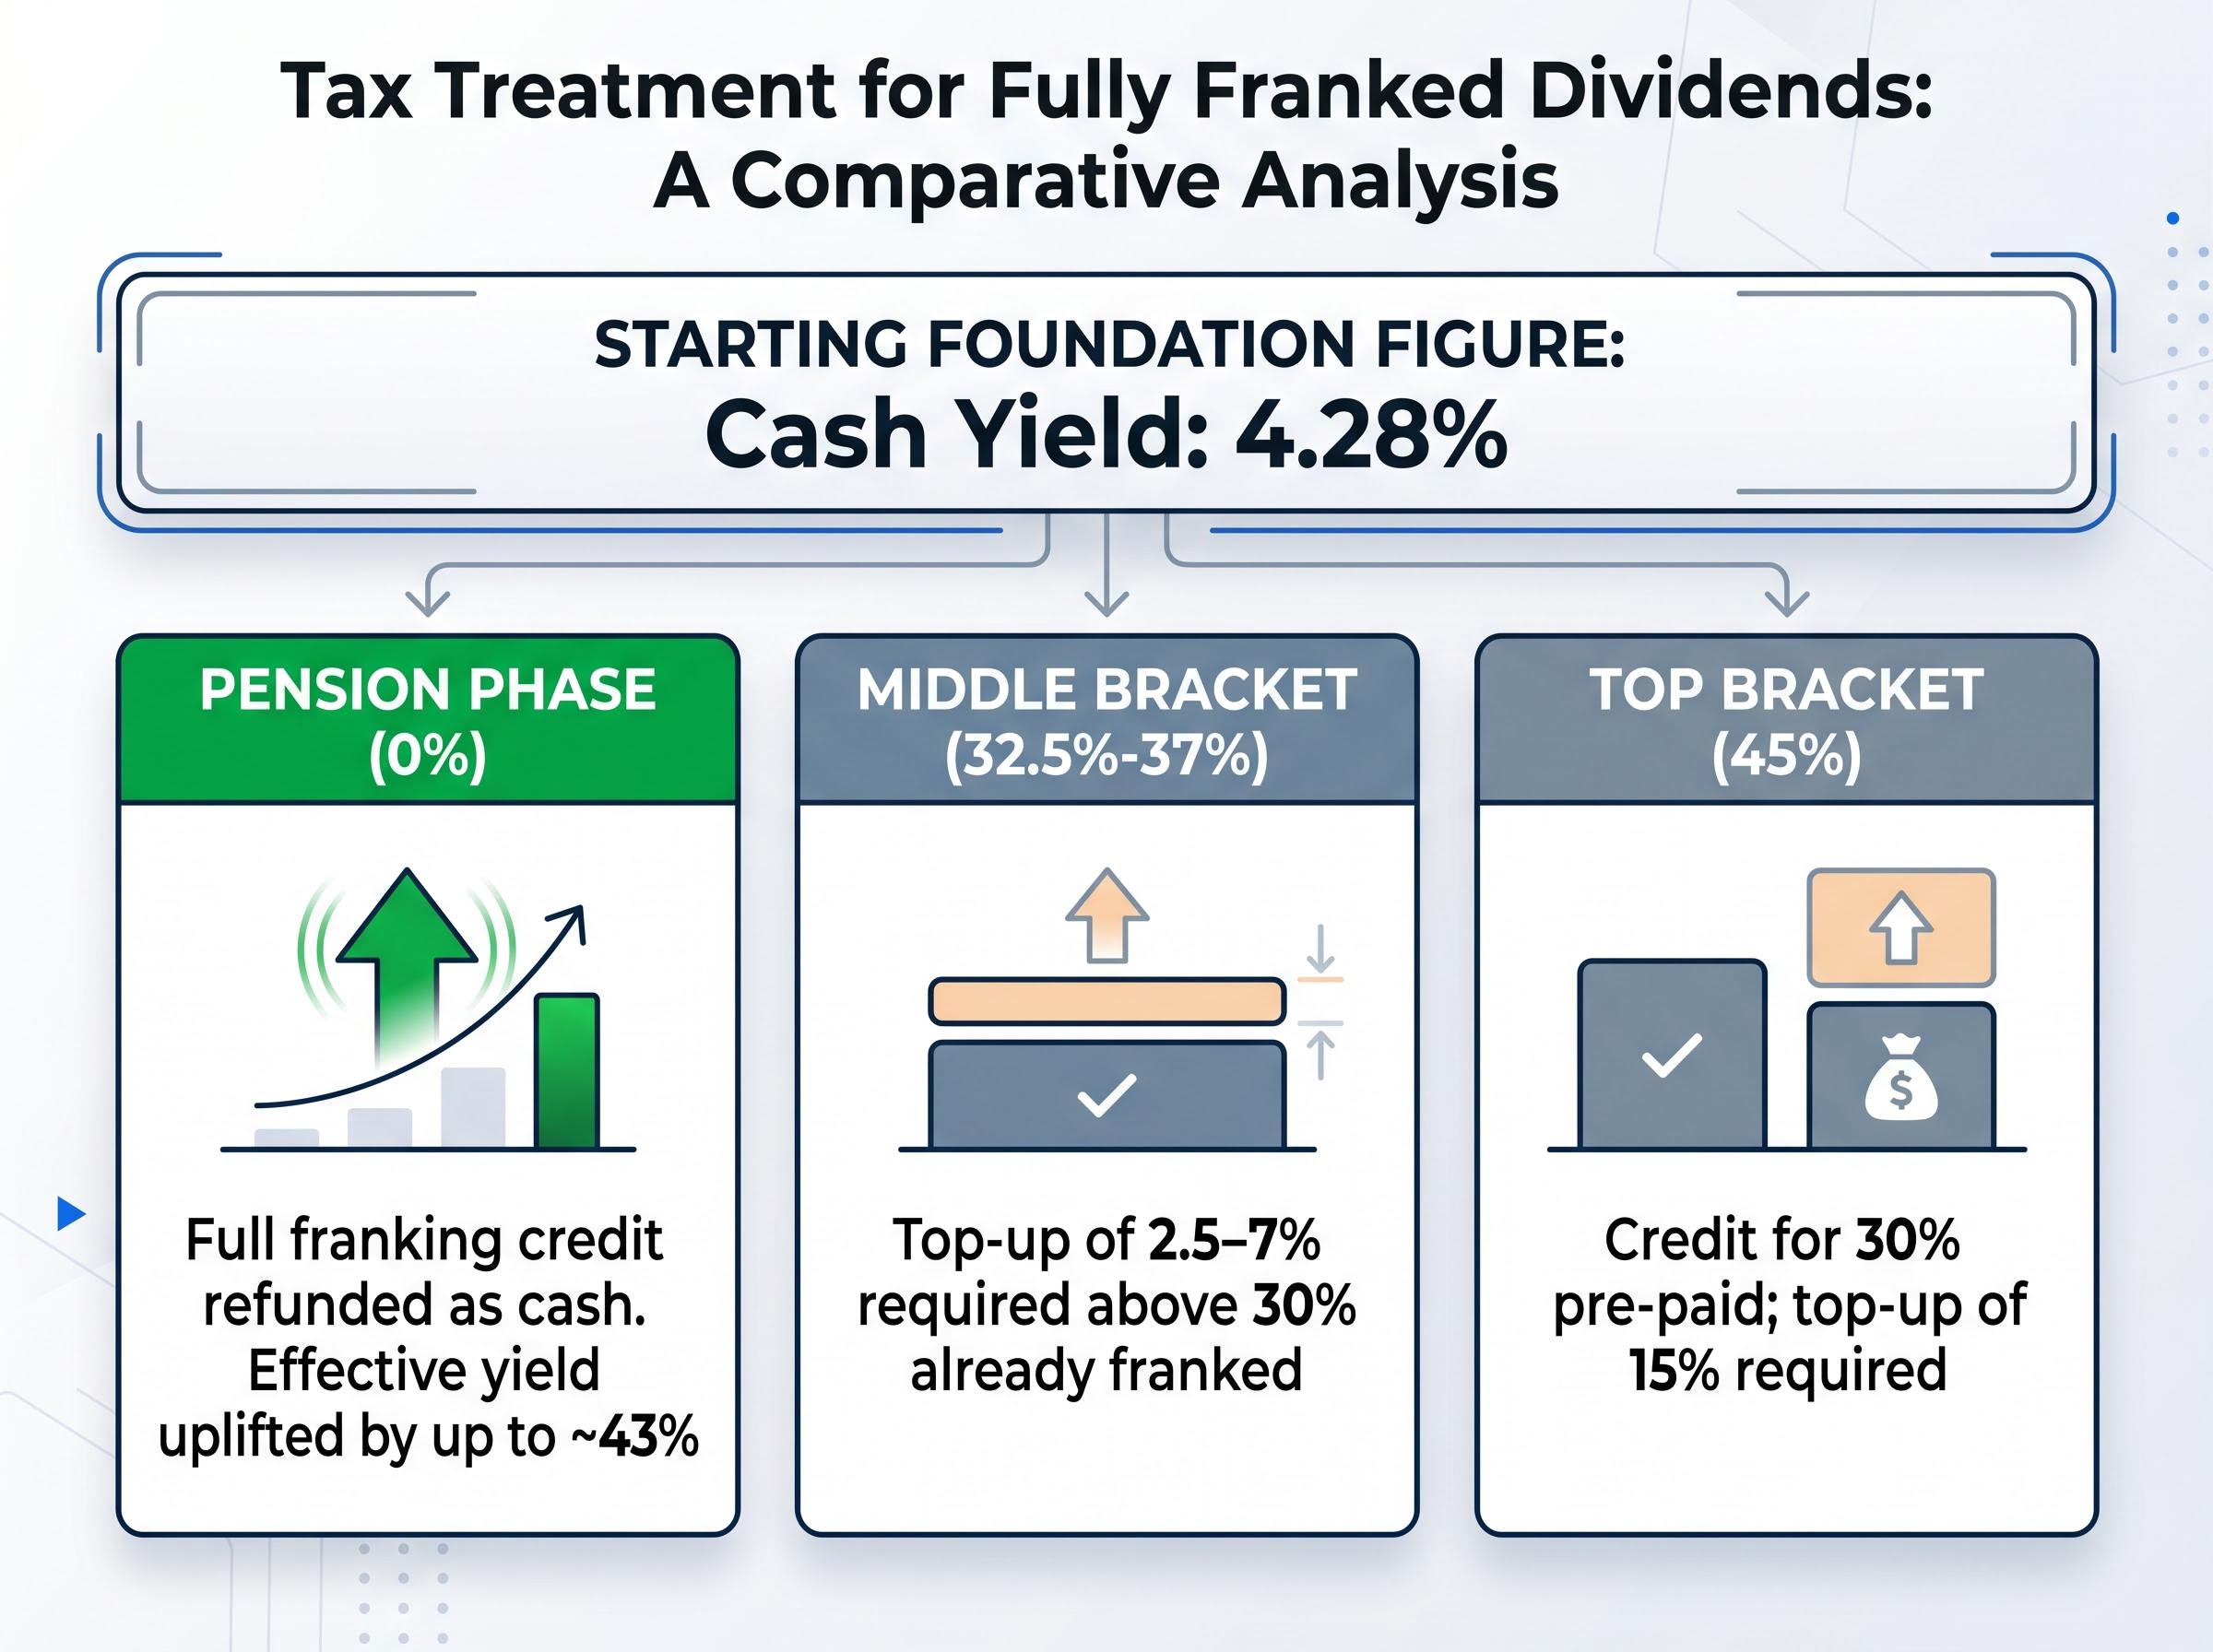
The same 4.28% cash yield translates into materially different after-tax outcomes depending on the investor’s marginal tax rate. For pension-phase retirees paying an effective rate of 0%, the full franking credit is refunded in cash, boosting the effective yield by up to approximately 43% above the headline figure. Middle-bracket investors (at 32.5%-37%) pay only a small top-up above the 30% already franked. Even top-bracket investors at 45% receive the benefit of the pre-paid 30%, with only the remaining 15% payable.
The ATO rules on refunding excess franking credits confirm that individuals and superannuation funds in pension phase are eligible to receive cash refunds when their franking credits exceed their total tax liability, which is the mechanism that produces the effective yield uplift of up to approximately 43% for pension-phase investors holding Westpac shares.
| Investor Tax Bracket | Cash Yield | After-Tax Treatment | Key Implication |
|---|---|---|---|
| Pension phase (0%) | 4.28% | Full franking credit refunded as cash | Effective yield uplifted by up to ~43% |
| Middle bracket (32.5%-37%) | 4.28% | Top-up of 2.5-7% above 30% already franked | Attractive versus unfranked alternatives |
| Top bracket (45%) | 4.28% | Credit for 30% pre-paid; top-up of 15% required | Reduced but still meaningful benefit |
For self-funded retirees and lower-tax investors, this franking mechanism is the most underappreciated dimension of the Westpac income case.
The income foundation: how Westpac’s payout ratio and capital position support the current dividend
Three structural pillars underpin Westpac’s capacity to maintain the current dividend:
- Capital adequacy: CET1 ratios remain above APRA’s “unquestionably strong” benchmark, providing a buffer that supports payment continuity
- Earnings cover: The 1H26 payout ratio of 75.6% (excluding notable items) indicates the dividend is funded by current earnings, though with limited headroom
- Management policy commitment: Westpac has stated a “sustainable and progressive” dividend policy, reiterated in the FY25 annual report and the 1H26 results
The payout ratio warrants attention. At 75.6% excluding notable items (and 77.1% on a statutory basis), it sits slightly above Westpac’s own stated target range of 65-75% of cash earnings. That is not an alarm signal, but it does mean the bank is already distributing at the upper boundary of what it considers sustainable.
Westpac’s 1H26 result delivered a 3% statutory profit rise alongside a CET1 ratio of 12.4%, providing approximately $2.7 billion in surplus capital above the bank’s internal 11.25% target, yet the share price fell 2.2% on results day as the combination of ex-dividend adjustment, half-on-half earnings softness, and sector-wide pressure weighed on the stock.
“Consistent with our capital position and earnings.” Westpac 1H26 results release, 5 May 2026
Morningstar has characterised Westpac as “well-capitalised” with “sound asset quality,” supporting a reliable dividend stream. The capital position provides genuine comfort; the payout ratio at the top of its range provides a reason to watch earnings closely.
What analysts project for FY2027 and why the forward yield is not guaranteed
Analyst estimates point to total dividends of approximately $1.625 per share for FY2027, which at the current share price of $35.96 would produce a forward yield of approximately 4.52%.
| Metric | Current (Trailing) | Projected FY2027 (Analyst Estimate) |
|---|---|---|
| Total DPS | $1.54 | $1.625 |
| Yield at $35.96 | 4.28% | ~4.52% |
| Franking status | Fully franked | Expected fully franked |
The implied dividend growth from the current two-payment run rate of $1.54 to $1.625 is approximately 5.5%, consistent with the “low-single-digit dividend growth” direction described in Motley Fool Australia and Livewire Markets commentary throughout 2026.
That growth is modest, not transformational. It reflects a bank that is expected to maintain and incrementally increase its payout rather than deliver a step change. The $1.625 figure is an analyst estimate reported by Motley Fool Australia on 10 May 2026; it is not a published Westpac commitment. Explicit broker consensus tables for WBC dividends remain behind subscription paywalls.
Forward projections depend on benign credit conditions, stable net interest margins, and no material deterioration in asset quality. They represent a scenario, not a schedule.
The risks that could derail Westpac’s dividend growth from here
The dividend is not fragile. But the conditions that would allow it to grow toward the FY2027 projection are not assured. Four risk categories deserve attention, ranked by near-term relevance:
- Net interest margin compression
- Credit quality deterioration
- Regulatory and capital requirements
- Cost inflation and technology spend
Earnings-side risks: margins and credit quality
Net interest margin is the primary near-term earnings risk. Westpac’s 1H26 results presentation described the NIM outlook as “broadly stable to slightly lower,” with the tailwind from earlier RBA rate hikes “largely realised.” Deposit competition is intensifying and mortgage discounting continues.
NIM compression and credit quality are the two earnings-side variables that professional analysts weigh most heavily when stress-testing bank dividends, and even a 15-20 basis point margin decline can materially reduce a major bank’s net profit and payout capacity, particularly when deposit competition intensifies and mortgage discounting is running simultaneously.
Credit quality remains sound today, with arrears and impairment charges at low levels. The conditional risk lies ahead. According to Livewire Markets, the household sector remains “sensitive to cumulative effect of past rate rises,” and commercial property and SME exposures are under watch. As Motley Fool Australia noted on 6 May 2026, “any spike in bad debts could pressure the payout.”
Structural constraints: capital, costs and payout headroom
APRA’s capital framework continues to set high CET1 requirements, and additional regulatory reform could add to capital needs. Westpac’s ongoing investment in technology, cyber security, risk, and compliance imposes a structural cost floor. With the payout ratio already at 75.6% (above the 65-75% target band), there is limited room to increase dividends without corresponding earnings growth.
Livewire Markets assessed dividend sustainability as “solid but not spectacular,” a characterisation that captures the position accurately. The dividend should be maintained. The question is how much growth it can deliver.
Westpac as an income stock in May 2026: yield, context and what comes next
Westpac’s income case rests on three figures, each serving a different analytical purpose: a trailing cash yield of 4.28%, a franking credit enhancement of up to approximately 43% for pension-phase investors, and an analyst forward projection of approximately 4.52% for FY2027.
– Cash yield (trailing): 4.28%, fully franked – Franking credit uplift (pension phase): up to ~43% above cash yield – Forward yield (FY2027 analyst estimate): ~4.52%
Against the broader ASX 200, which yields approximately 4% in general market commentary, Westpac sits at the higher end of the big four bank range. CBA consistently trades on the lowest yield and highest price-to-earnings ratio of the four majors; Westpac remains among the highest-yielding.
The confirmed 77-cent payment on 26 June 2026 provides near-term certainty. Beyond that, investors should monitor three forward-looking signals:
- FY26 full-year NIM outcome from the results expected later in 2026
- Credit quality indicators, including arrears trends and impairment charges
- APRA capital guidance updates that could affect payout headroom
For income-focused investors, particularly those in lower tax brackets or pension phase, the current yield is genuinely competitive on both a cash and grossed-up basis. The open question is whether conditions exist for it to grow toward the FY2027 projection.
The income case for Westpac is real, but it rewards patience over speculation
The combination of a fully franked 4.28% trailing yield, a confirmed 77-cent payment on 26 June 2026, and an analyst FY2027 projection of $1.625 per share (approximately 4.52% forward yield) makes a credible income case for Westpac, particularly for long-term, tax-advantaged investors.
The 16% pullback from the April highs has improved the entry-level yield mechanically. Investors entering purely on yield momentum should recognise that further price weakness remains possible if macroeconomic conditions deteriorate. Westpac is down 7.8% year-to-date at $35.96.
Westpac’s dividend is well-supported for maintenance and incremental growth. Livewire Markets described the sustainability outlook as “solid but not spectacular,” and that framing holds. The era of rapid payout expansion is not imminent.
Westpac has stated its commitment to a “sustainable and progressive” dividend policy. Westpac FY25 Annual Report
This article is for informational purposes only and should not be considered financial advice. Investors should conduct their own research and consult with financial professionals before making investment decisions. Past performance does not guarantee future results. Financial projections are subject to market conditions and various risk factors.