
A 5-point S&P 500 futures Renko strategy outperformed its time-based equivalent over 23 years, delivering a compound annual growth rate (CAGR) of 8.1% versus 7.2%, with a shallower maximum drawdown of 24% compared to 27%. The edge did not come from a proprietary indicator or exotic entry logic. It came from filtering the noise that causes traders to act on signals that were never really there. Renko charts have existed since Japan’s Edo-period rice markets, but their practical deployment in modern trading hinges on three decisions most guides skip entirely: how to size the brick, which construction method to use, and which indicators actually produce cleaner signals on a noise-filtered chart versus those that simply look cleaner without adding analytical value. This guide walks through the full decision framework for deploying a Renko chart strategy in live trading, covering brick-sizing trade-offs across asset classes, the five construction methods and when each applies, and specific indicator pairings with documented parameter settings and entry/exit logic.
Choosing your brick size is the most consequential decision in Renko trading
Brick size is the single variable that determines how much of the market’s noise reaches the trader’s decision layer. Set it too small and the chart overtraces, producing as many false signals as a standard candlestick chart. Set it too large and signals arrive so late that most of the move is already priced in. The correct calibration is not universal; it is asset-class-specific.
ATR-based bricks adapt to shifting volatility regimes. On GBPUSD using ATR(14) on the H1 timeframe, the ATR reading of approximately 18 pips translates directly to an 18-pip brick for swing trading, or roughly 9 pips (0.5x ATR) for scalping. Practitioners across FX forums consistently favour ATR bricks when volatility regimes shift, because fixed bricks either go dead in quiet conditions or become noisy in volatile ones.
Fixed bricks occupy a different niche. On index futures such as the ES and NQ, and on high-liquidity large-cap equities, volatility is relatively stable and, as practitioners note, “institutional algos key off absolute tick levels,” making fixed bricks easier to align with stop distances. For FX intraday work, 10-20 pip fixed bricks are common; position traders stretch to 30-50 pips.
High-frequency trading activity is the primary source of the intrabar volatility that Renko’s brick threshold is designed to filter; HFT firms operating co-located servers execute thousands of round-trip orders within a single time-based candle, generating the microstructure noise that causes candlestick charts to produce signals Renko’s double-brick reversal rule would simply never show.
Percentage bricks serve a third purpose: cross-asset comparison. Allocators running diversified equity baskets or sector ETFs use 0.5-1.0% bricks to normalise signals across instruments with different absolute price levels. In crypto, 0.3-0.7% bricks suit BTC/ETH pairs, but they “over-trigger” on low-cap altcoins where percentage moves are routinely outsized. Fixed $250 BTC bricks on daily close produced cleaner mid-cycle swings in practitioner testing, while ATR bricks gave earlier but more frequent signals.
| Asset Class | Recommended Method | Typical Setting | Best For | Key Limitation |
|---|---|---|---|---|
| FX Majors | ATR-based | 1-2x ATR(14) on H1 | Swing and scalping | Repainting risk if ATR recalculates intraday |
| Equities | Fixed dollar | $1-$2 mid-price; $5+ high-price | Swing trading individual names | Gap risk around earnings |
| Crypto (BTC/ETH) | ATR-based or fixed | 0.8-1.2x ATR(14) on H1/H4; $250 fixed | Mid-cycle swing trades | Flash moves skip multiple brick levels |
| Index Futures | Fixed point | 5-point bricks (ES) | Trend following | 2-point bricks increase whipsaw; 10-point bricks lag |
The three sizing methods and their primary use case:
- ATR-based: Adapts to volatility regime shifts; preferred for FX and crypto where conditions change across cycles
- Fixed: Produces consistent, backtestable signal spacing; preferred for liquid instruments with stable volatility
- Percentage: Normalises signals across instruments with different price levels; suited to diversified baskets and macro-level comparison
When big ASX news breaks, our subscribers know first
How Renko bricks are built determines what the chart actually shows you
Most traders assume all Renko charts with the same brick size show the same thing. They do not. The construction method is a second, independent variable, and choosing the wrong one for the trading objective quietly degrades every signal produced downstream.
Five methods exist, ordered from smoothest to highest filter:
- Closing price method: Uses only the period close to build bricks, producing the smoothest output but discarding intra-period price extremes entirely.
- High-low range method: Incorporates period highs and lows, reducing lag but reintroducing some noise that the closing method eliminates.
- Median/Mean Renko: Opens each new brick at the midpoint of the prior brick, further smoothing pullbacks and improving visual identification of reversals.
- Geometric Renko: Applies a fixed 12.5% extension or inversion to maintain a precise 45-degree slope across all bricks.
- Turbo Renko: A high-filter variant engineered to discard minor pullbacks and display only higher-probability reversal signals.
A reversal brick in any method requires price to travel double the brick size from the prior brick’s boundary. This is the built-in low-pass noise filter that gives Renko its structural advantage over time-based charts, and it applies regardless of construction method.
Practitioners recommend using Renko for identifying the overarching market trend while maintaining candlestick charts as a secondary tool for monitoring intra-brick volatility and identifying exit points.
Geometric and Turbo Renko: when standard construction is not enough
Geometric Renko enforces a precise 45-degree visual slope by applying a 12.5% extension to each new brick. The constraint matters because it standardises the visual pattern across different instruments and timeframes, making pattern recognition more consistent. Traders who rely on visual chart patterns rather than indicator-only signals find the uniform geometry reduces interpretation errors.
Turbo Renko takes filtering further. Its logic aggressively discards minor pullbacks, displaying only moves that meet a higher probability threshold for genuine reversal. In fast-moving markets and high-frequency noise environments, such as crypto during liquidation cascades or news-driven FX spikes, Turbo Renko produces fewer but more committed signals. The trade-off is later entry on valid moves, which makes it better suited to trend management than to entry timing.
What Renko charts actually are, and why time does not appear on the horizontal axis
The name originates from the Japanese term “renga,” meaning brick. Renko charts were developed in Japan’s Edo-period rice markets (1603-1868) as a method for tracking price changes without distraction from extraneous market activity. Unlike bar or candlestick charts, which advance the horizontal axis at fixed time intervals, Renko charts advance only when a qualifying price event occurs. This compresses quiet periods and expands volatile ones, meaning the chart’s horizontal axis represents price events rather than elapsed time.
Price discovery mechanics, specifically the role of passive limit orders sitting in the order book, explain in structural terms why time-based charts generate so much noise: roughly 45% of price discovery occurs through resting orders rather than completed trades, meaning each time-based candle captures a mix of genuine directional intent and transient order-book friction that Renko’s brick threshold is designed to discard.
Using a 10-point brick size as an example: a price move of 9.9 points is insufficient to generate a new brick, leaving the chart completely stationary. Only when price penetrates the boundary by the full defined size does a new brick appear.
Each brick is placed diagonally from the prior one, never adjacently side-by-side. The three rules that govern every Renko chart are:
- Minimum brick size threshold: Price must move by the full brick size beyond the existing brick’s boundary to generate a new brick in the same direction
- Directional movement criteria: New bricks form only in the direction of sufficient price movement; insufficient moves in either direction produce no chart update
- Double-brick reversal requirement: A colour-change reversal requires price to travel twice the brick size beyond the boundary of the last brick, functioning as a structural filter against false reversal signals
The double-brick reversal threshold is not arbitrary. It means that every reversal signal on a Renko chart has already absorbed twice the noise threshold before it appears. This is why indicator pairings tend to produce cleaner outputs on Renko than on time-based charts: the underlying data has already been structurally filtered before any indicator calculation begins.
Pairing Renko with moving averages, RSI, and Bollinger Bands: specific setups that work
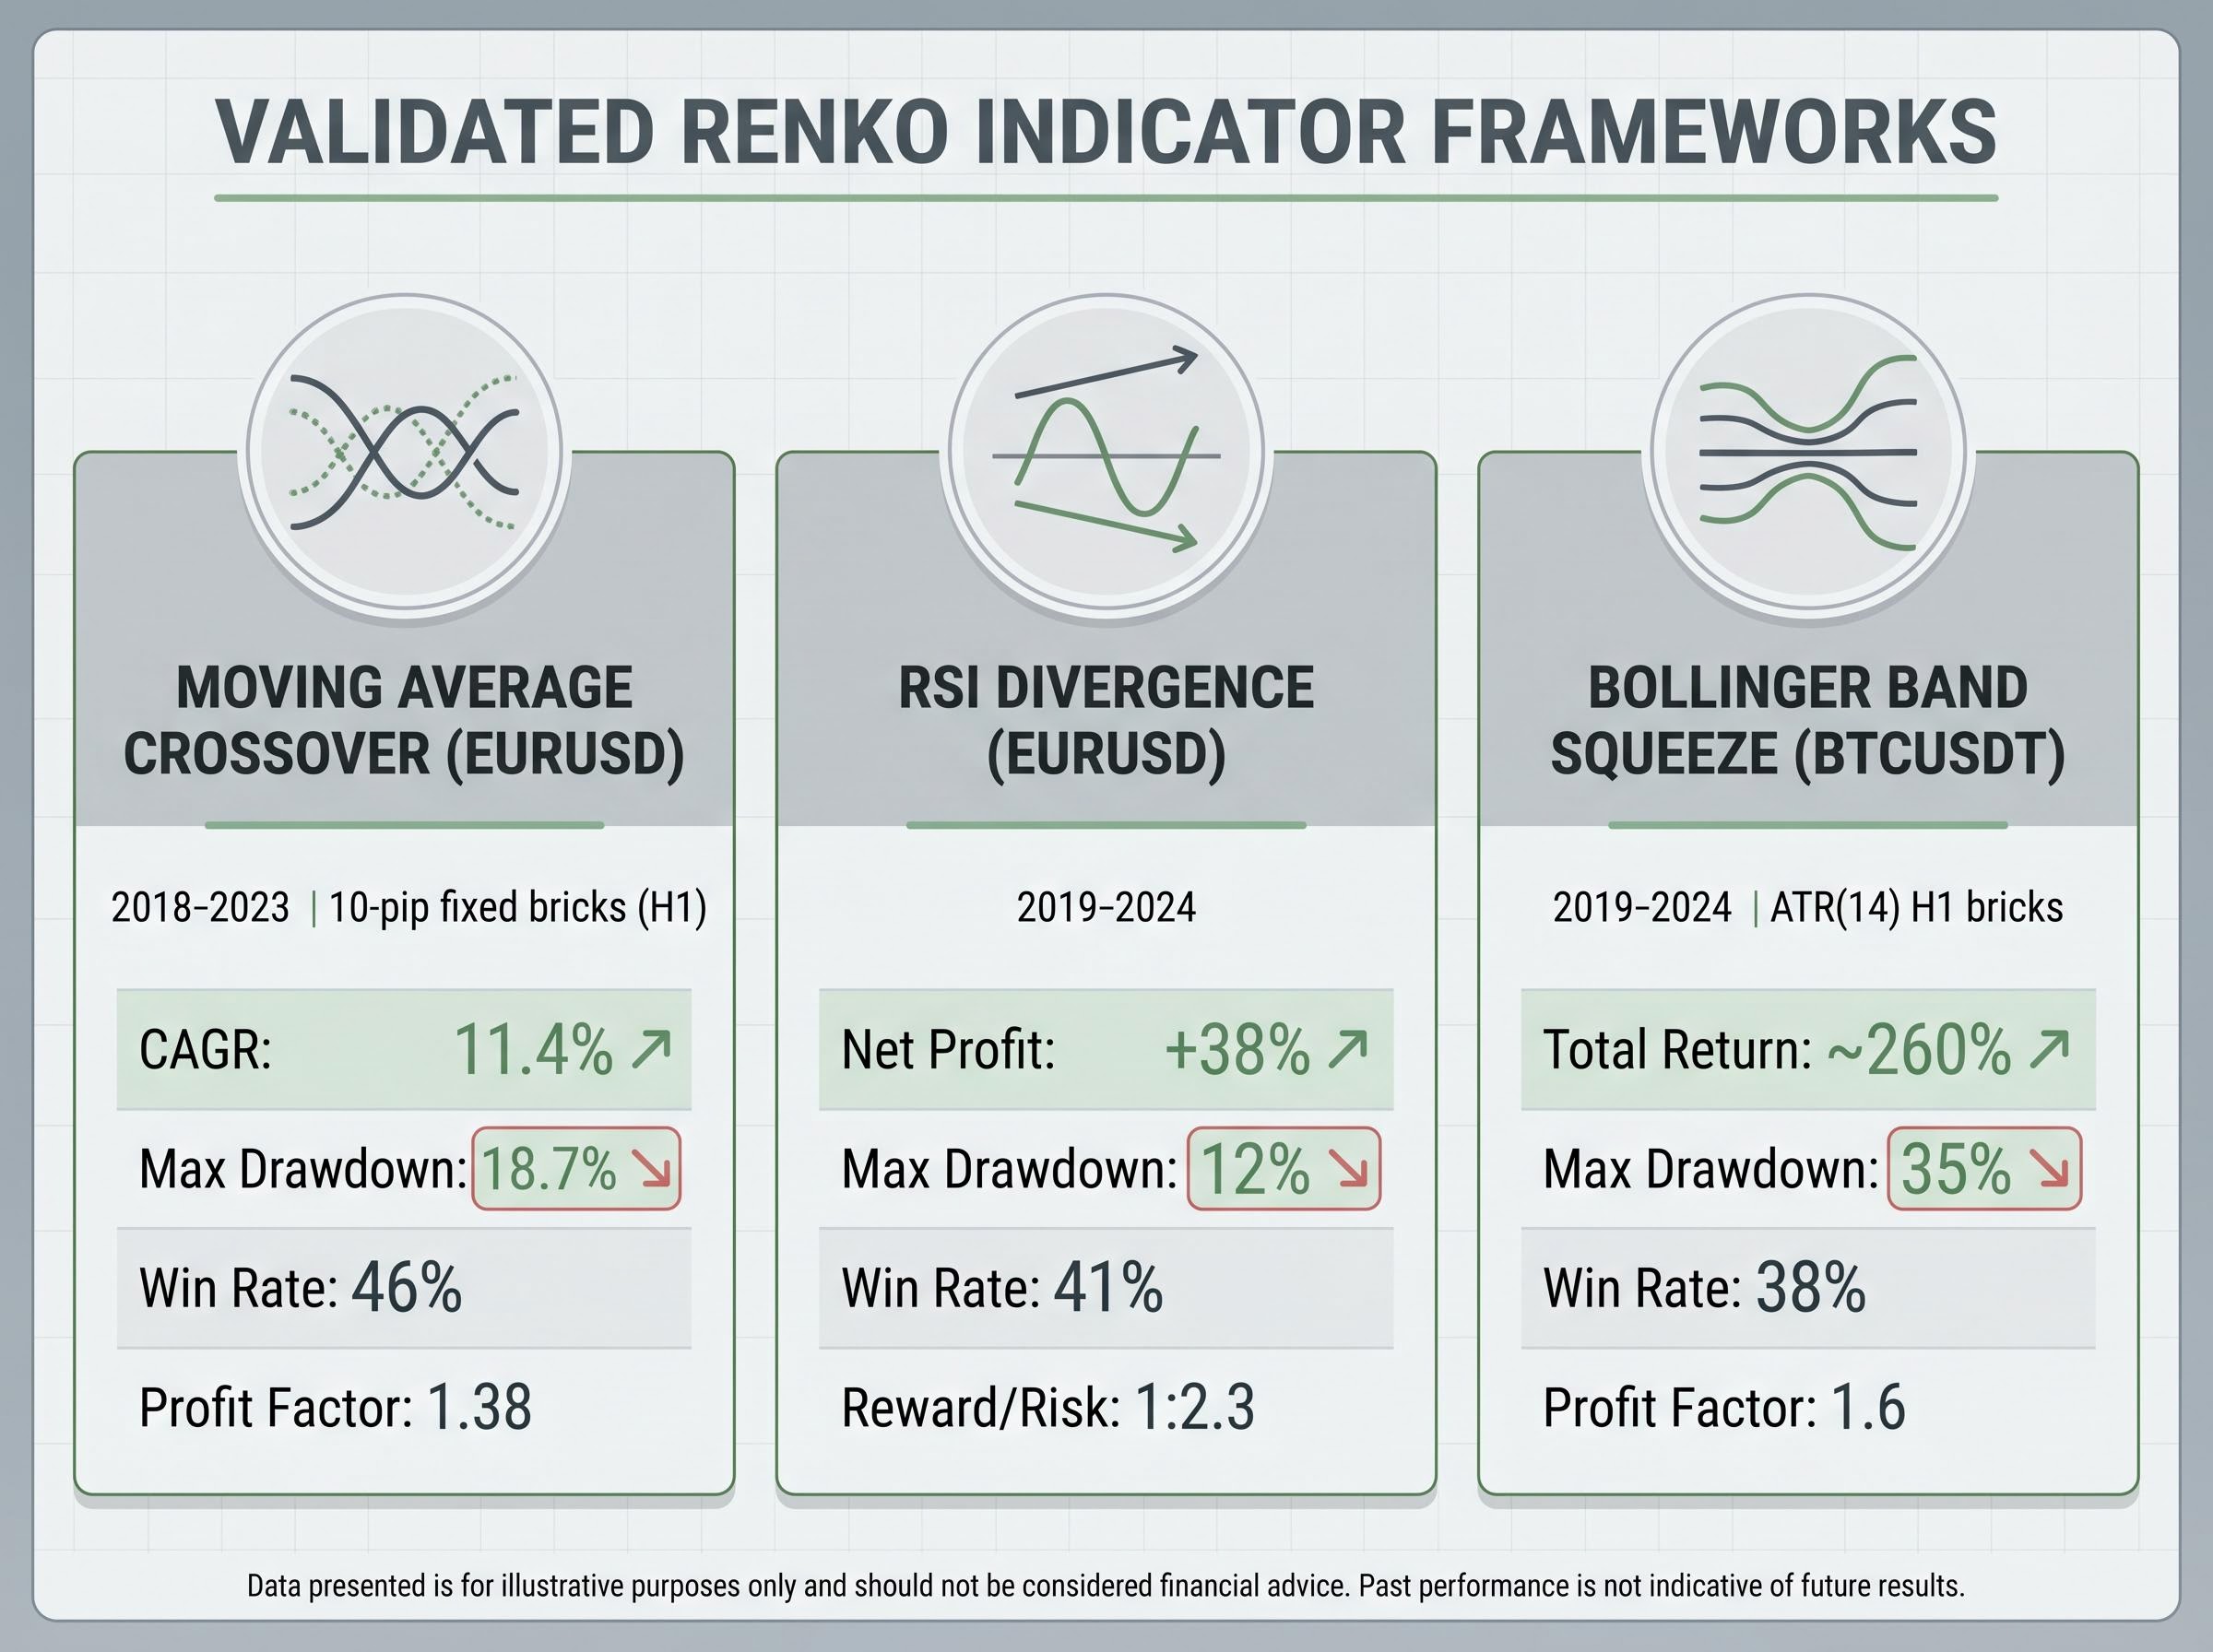
Each of the three indicator pairings below has been validated in backtested frameworks with documented parameters. They serve as starting points for instrument-specific testing rather than ready-to-deploy systems.
| Indicator | Key Parameters | Entry Trigger | Stop Placement | Exit Signal |
|---|---|---|---|---|
| Moving Average Crossover | 50/200 EMA on Renko bricks | 50 EMA crosses above/below 200 EMA | 3 bricks beyond crossover | 6-brick target or opposing crossover |
| RSI Divergence | RSI(14), 70/30 levels, 20-brick EMA | Divergence + first reversal brick + close above/below 20 EMA | 1-2 bricks beyond last swing | 3-4 bricks or RSI crosses back below 60 |
| Bollinger Band Squeeze | BB(20, 2.0), 50-brick EMA | First brick closing outside band after squeeze | Opposite side of squeeze range | Opposite-colour brick inside bands or BB width beyond 3x average |
Moving average crossovers on Renko
The 20-brick EMA serves as a dynamic support and resistance reference on Renko, where the smoothing already applied by the brick structure makes the moving average signal noticeably cleaner than on time-based charts. For trend confirmation, the 50/200 EMA crossover offers a longer-term directional filter.
A backtested EURUSD framework using 10-pip fixed bricks with H1 source data over 2018-2023 reported a CAGR of 11.4%, a maximum drawdown of 18.7%, a win rate of 46%, and a profit factor of 1.38. The win rate below 50% is typical for trend-following systems; profitability depends on the average winning trade being substantially larger than the average loss.
RSI divergence entries
The full RSI divergence framework follows a specific sequence:
- Brick size selection: Align to approximately 1x H1 ATR for FX majors
- RSI configuration: RSI(14) applied to Renko closes; standard levels 70/30; 60/40 used as a trend filter (long trades only when RSI is above 60)
- Divergence identification: For a long setup, price makes lower lows while RSI makes higher lows (bullish divergence)
- Entry trigger: First bullish Renko brick (colour change) with a close above the 20-brick EMA
- Stop placement: 1-2 bricks beyond the last swing low
- Exit: 3-4 bricks profit, or when RSI crosses back below 60
An expert adviser (EA) backtest on EURUSD over 2019-2024 reported net profit of +38%, maximum drawdown of 12%, a win rate of 41%, and an average reward-to-risk ratio of approximately 1:2.3, according to MQL5 blog research.
Bollinger Band squeeze breakouts
The Bollinger Band squeeze framework follows a parallel structure:
- Squeeze definition: Bollinger Bands set to period 20, standard deviation 2.0; a squeeze is identified when band width falls below 1.2x the average band width of the last 100 bricks
- Entry trigger: First brick closing outside the upper or lower band after the squeeze, in the direction of the break
- EMA confirmation: The 50-brick EMA must be sloping in the same direction as the breakout
- Exit conditions: An opposite-colour Renko brick closing inside the bands, or BB width expanding beyond 3x the average (signalling exhaustion)
A BTCUSDT ATR trend-following backtest using a 34/89 EMA crossover with ATR(14) H1 bricks, a 2-brick stop, and a trailing stop at +3 bricks reported a total return of approximately 260%, a maximum equity drawdown of 35%, a win rate of 38%, and a profit factor of 1.6 over 2019-2024 on Binance spot with 0.1% fee per side.
Three limitations that Renko traders systematically underestimate
Understanding these failure modes before deployment prevents the most common way Renko strategies that look compelling in backtests fail to perform in live conditions.
- Repainting with ATR-based bricks. When ATR brick size is recalculated on each bar, historical bricks can change as the volatility regime shifts. Implementations that rebuild historical bricks every tick have been described as “visually attractive but deceptive for backtests.” The problem is not with ATR bricks conceptually but with implementations that allow completed bricks to change after the fact.
ATR Persistence solutions by platform:
- TradingView: “ATR Persistent Renko” Pine script locks the ATR value per session, preventing intraday recalculation
- MT4/MT5: Renko Builder v3.2 EA calculates ATR once at the start of each H1 candle (default) and keeps brick size constant until the next calculation
- thinkorswim: Community ThinkScript workaround updates brick size only once per hour using ATR(14) from H1
- NinjaTrader: Fixed brick only natively; “volatility renko” bar types sample ATR once per bar to limit repainting
- Over-smoothing and late entries. Large bricks transform Renko into a lagging swing filter. When brick size exceeds 1.5-2% of price, the chart misses early legs of moves in volatile momentum stocks. Mitigations include multi-brick scaling (smaller bricks for entries, larger bricks for trend management) and combining Renko entries with time-based confirmation, such as a 15-minute candle close in the direction of the Renko signal.
- Gap and flash-move risk. Renko can under-represent overnight gaps in equities; large gap opens create sequences of bricks that do not reflect the intraday path. In crypto, flash moves can skip multiple brick levels, understating intraday risk. Counter-measures include using wider bricks or cross-checking with daily candlesticks around earnings or macro releases, calibrating minimum brick size so the average move per trade is several times the fee, and applying volatility filters that suspend trading when ATR exceeds a defined threshold or during known event windows.
CFD leverage mechanics compound the consequences of every calibration error discussed above: a brick size that generates premature entries on a time-based chart becomes a position-sizing problem on a leveraged CFD account, where a 10:1 leverage ratio turns a 5% adverse move into a 50% drawdown on the margin deposit before any stop is triggered.
According to Quantified Strategies research comparing S&P 500 Renko and time-based systems over 2000-2023, the Renko approach delivered CAGR of 8.1% versus 7.2%, maximum drawdown of 24% versus 27%, and profit factor of 1.31 versus 1.25. The conclusion: “differences are not statistically overwhelming.”
Overfitting brick size and indicator parameters to past data remains a frequent problem. Some strategies perform worse out-of-sample than simple moving-average systems on time bars. Renko does not create an edge by itself; it repackages price. The behavioural benefit, reducing noise and improving trader discipline, is real but must be validated over long periods and multiple instruments.
Renko chart strategy works when the calibration decisions are made deliberately, not by default
The three brick-sizing methodologies, the five construction methods, and the indicator pairings covered in this guide are not interchangeable defaults. Each is a deliberate choice tied to asset class, trading objective, and volatility environment.
The hierarchy of decisions runs in sequence: brick sizing method first (ATR, fixed, or percentage, matched to the instrument and its volatility characteristics), construction method second (matched to the specific trading objective and the tolerance for lag versus noise), indicator pairing third (with documented parameters as a starting point, not a destination), and repainting mitigation last (platform-specific ATR Persistence implementation to ensure backtests reflect what would have been visible in real time).
The practical starting point is straightforward. Begin with ATR-calibrated brick sizing on the primary instrument. Validate the construction method against the specific objective. Treat the backtested frameworks documented here as starting points for instrument-specific refinement rather than ready-to-deploy systems. The S&P 500 comparison data offers an honest benchmark: Renko can modestly improve trend-following efficiency, but the improvement compounds only when the calibration decisions are made deliberately, tested rigorously, and adapted to the specific instrument in play.
This article is for informational purposes only and should not be considered financial advice. Investors should conduct their own research and consult with financial professionals before making investment decisions. Past performance does not guarantee future results. Backtested performance figures are subject to overfitting risk and may not reflect live trading outcomes.