
At $37.44 per share following Westpac Banking Corporation’s (WBC) 1H26 results, the stock is trading approximately 7% above one widely cited intrinsic value model and a notch above the Big 4 sector average price-to-earnings (PE) ratio of roughly 18x. Whether that premium is justified or a warning sign depends on how the numbers are read. With the RBA hiking to 4.35% on 5 May 2026, the same day Westpac released half-year results showing net interest margin (NIM) compression and flat non-interest income, the bank’s near-term earnings trajectory faces genuine headwinds. Investors researching the WBC share price are typically trying to answer one question: is now a good time to buy, hold, or reassess? This analysis walks through a PE ratio assessment of WBC benchmarked against its Big 4 peers, explains what that comparison does and does not reveal about fair value, and introduces the Dividend Discount Model (DDM) as a complementary lens. By the end, readers will have a practical, replicable methodology for assessing ASX bank stock valuations, not just a verdict on WBC.
How WBC’s current share price stacks up against the Big 4
The starting point for any valuation exercise is knowing where the stock sits relative to its closest peers. As of 8 May 2026, WBC closed at $37.44, a price that carries the full weight of the market’s reaction to the 1H26 results released three days earlier.
The Big 4 peer group at the same date:
- CBA: $175.91
- NAB: $38.36
- ANZ: $36.79
- WBC: $37.44
WBC sits between NAB and ANZ in absolute price terms, though absolute share price tells investors little on its own. What matters more is the trajectory into this snapshot. WBC fell from approximately $40.35 to $37.44 in the week following results, a decline of roughly 7%.
“WBC fell from approximately $40.35 to $37.44 in the week following its 1H26 results, a decline of roughly 7% that sets the valuation baseline for this analysis.”
That sell-off is the market digesting 1H26 cash profit (excluding notables) of $3.5 billion, down 1% on 2H25 and up just 1% on 1H25. The numbers were not disastrous, but they were not a catalyst for re-rating either. Every multiple and model discussed below is anchored to a post-results price, not a pre-announcement one.
Investors wanting to understand the mechanics behind the 7% sell-off in detail will find our full explainer on WBC’s post-results share price decline examines the ex-dividend adjustment, the sector-wide financials selloff, and the half-on-half earnings softness that combined to move the stock from $40.35 to $37.44, along with broker consensus targets and the NIM trajectory heading into the second half of 2026.
When big ASX news breaks, our subscribers know first
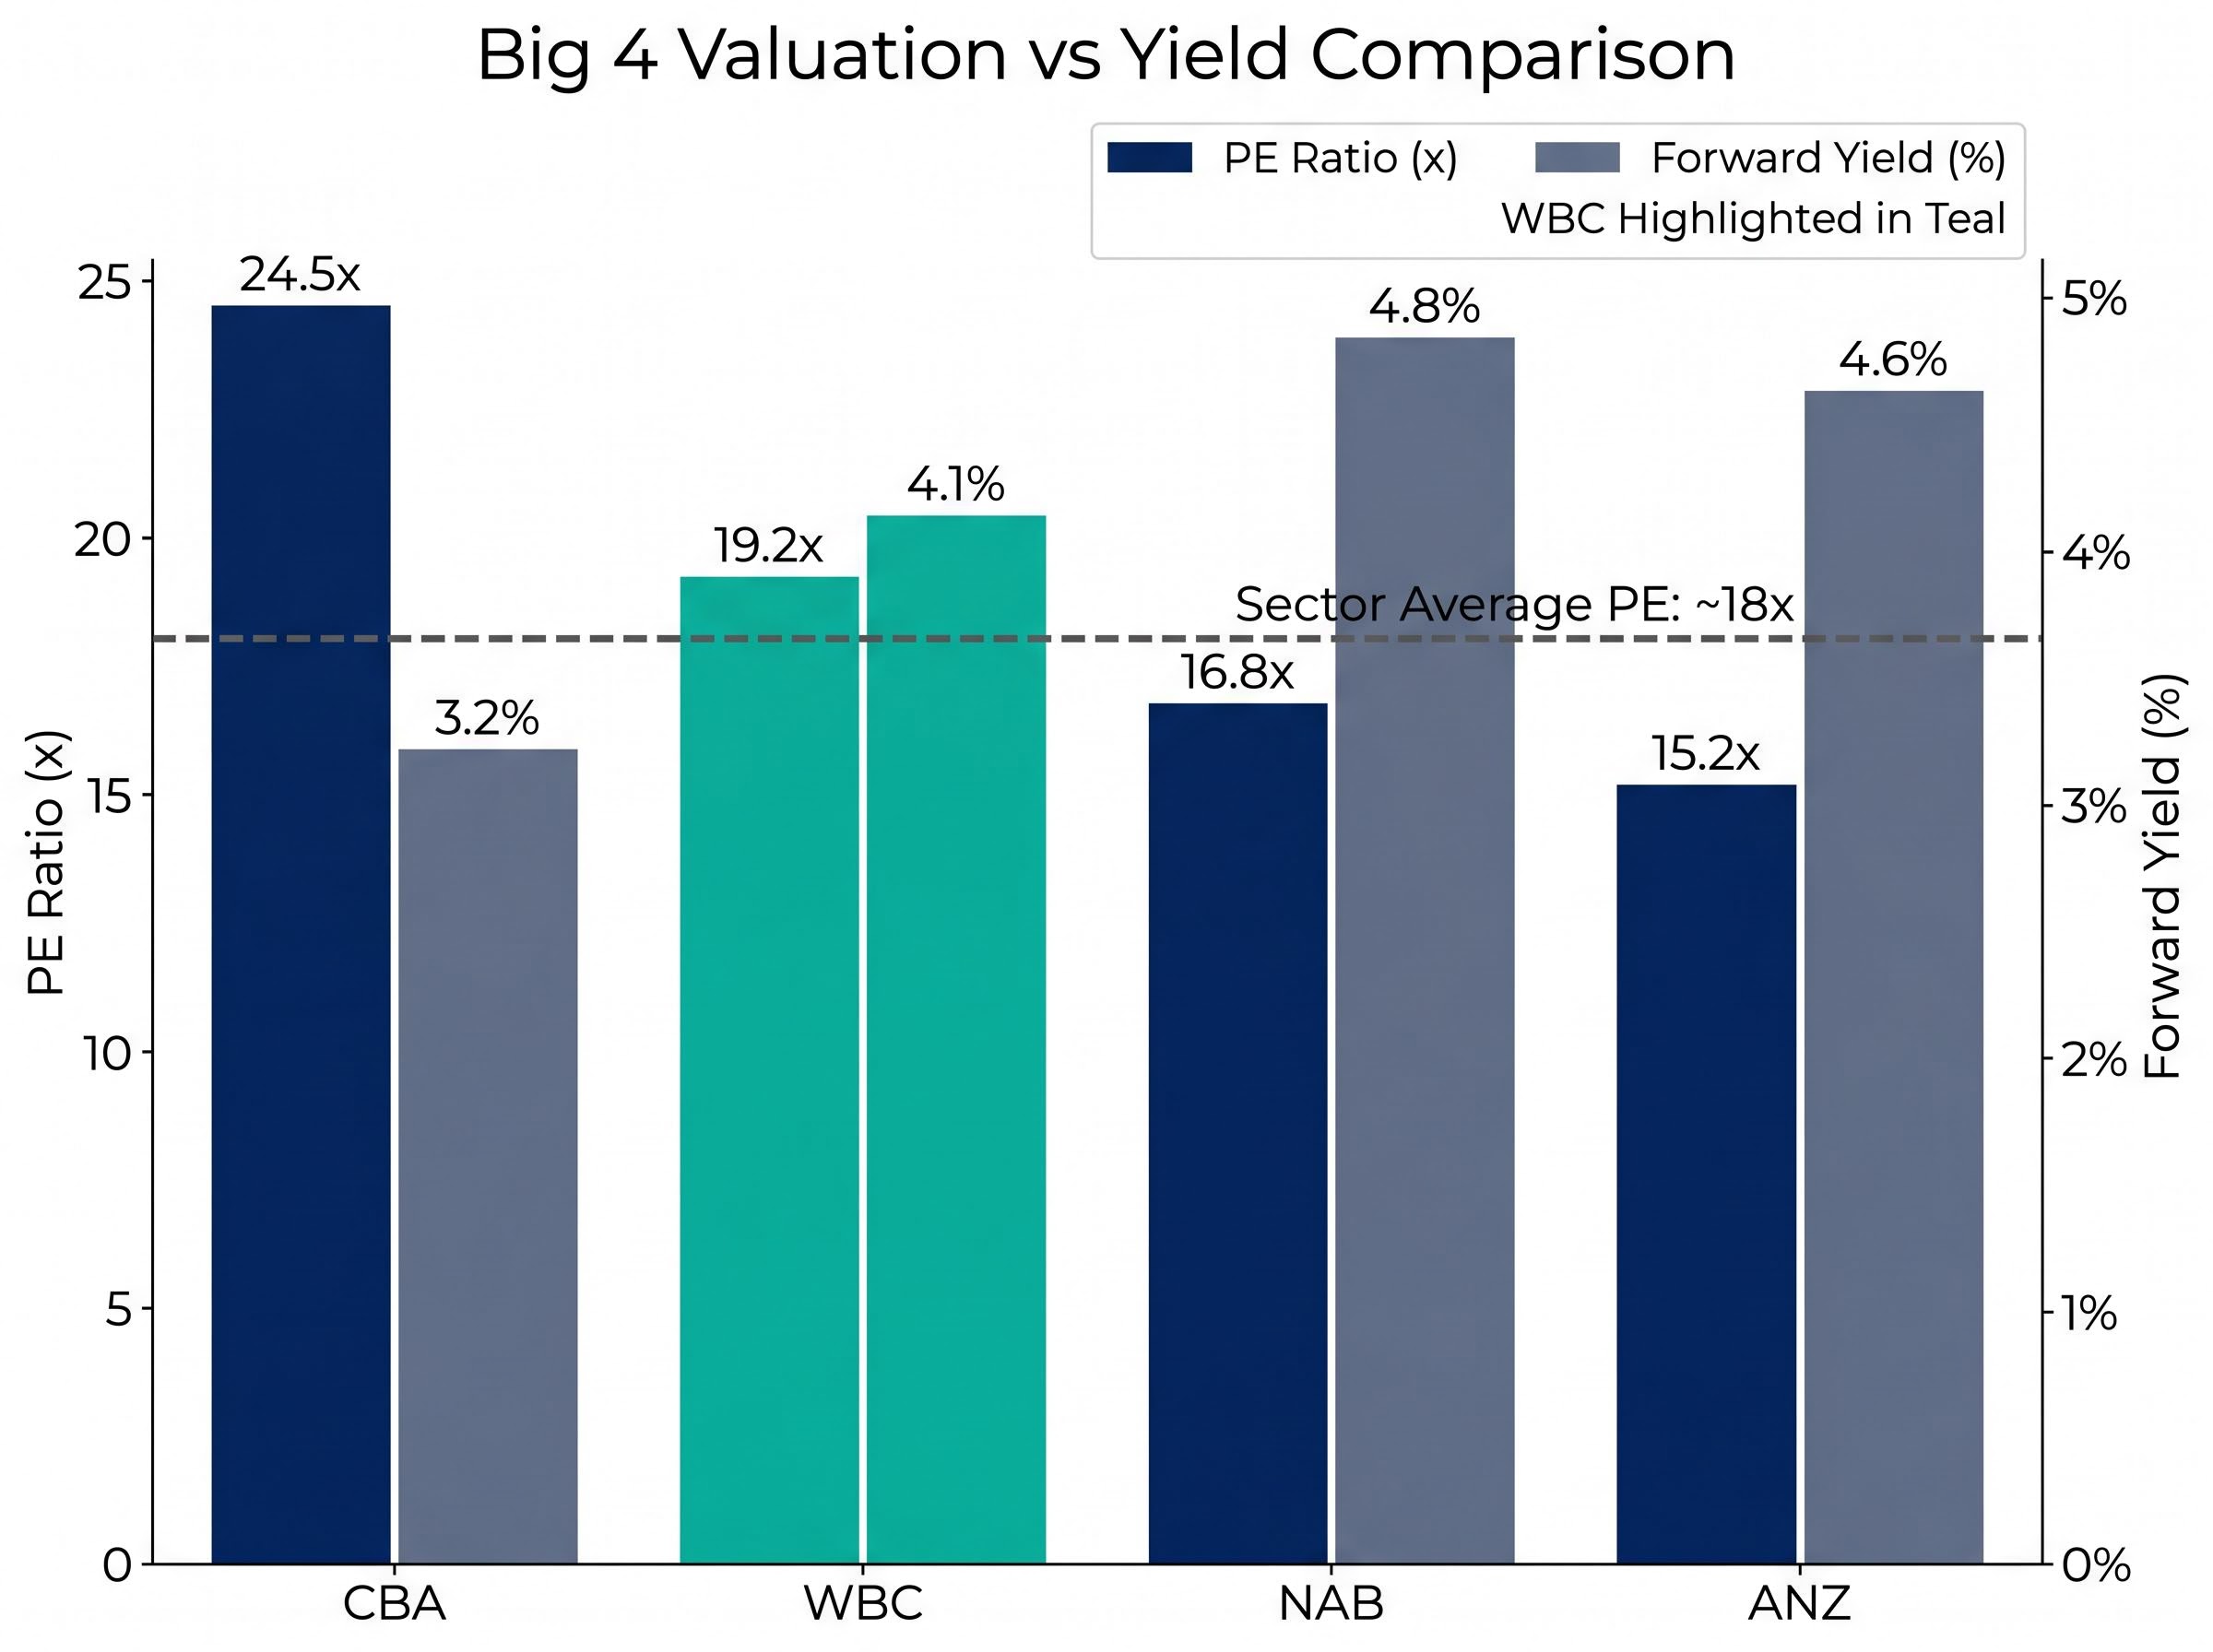
What the PE ratio reveals: WBC at 19.2x versus a sector average of 18x
The trailing PE ratio divides the current share price by the most recent annual earnings per share (EPS). For WBC, that calculation runs: $37.44 divided by FY24 EPS of approximately $1.92, producing a trailing PE of roughly 19.2x.
That figure only becomes meaningful when placed alongside the rest of the Big 4.
| Bank | Share Price | Trailing PE | vs Sector Avg (~18x) |
|---|---|---|---|
| CBA | $175.91 | ~24.5x | Premium |
| WBC | $37.44 | ~19.2x | Slight premium |
| NAB | $38.36 | ~16.8x | Below average |
| ANZ | $36.79 | ~15.2x | Below average |
The sector average PE of approximately 18x positions WBC as the second most expensive of the four on a trailing earnings basis, well behind CBA’s 24.5x but meaningfully above NAB at 16.8x and ANZ at 15.2x.
“Applying the sector average PE of approximately 18x to WBC’s FY24 EPS of $1.92 implies a fair-value reference price of around $34.56, roughly 8% below the current trading price.”
That 8% gap between the implied sector-average price and the actual trading price is the question the rest of this analysis attempts to answer. Is there a reason WBC deserves to trade above the sector average, or is the premium unsupported by fundamentals?
Understanding PE ratios for bank stocks: what the multiple actually measures
The PE ratio expresses the price an investor pays today for each dollar of annual earnings, stated as a multiple. A PE of 19.2x means buyers are paying $19.20 for every $1 of WBC’s trailing earnings.
As a standalone figure, that number is largely meaningless. PE ratios only become useful when compared against a relevant peer set, and for mature industries such as banking, sector-relative comparisons are more informative than any absolute threshold.
Three specific distortions make PE analysis imperfect for bank stocks:
- Regulatory capital requirements constrain earnings growth. Banks must hold minimum capital buffers (CET1 ratios), limiting how aggressively they can deploy capital to grow earnings.
- NIM cycles compress reported earnings in ways that inflate PE optically. When margins fall (as WBC’s did in 1H26), trailing earnings drop and the PE rises even if the share price is flat.
- Notable items (one-off charges or gains) can skew trailing EPS figures, making the denominator unreliable in any single period.
Why Australian bank PEs trade at a premium to global peers
Australian Big 4 banks carry a PE premium of approximately 10-15% above US banks, which trade at roughly 15-17x trailing earnings. This premium reflects several structural characteristics: superior dividend yields in the 4-5% range (fully franked), regulatory stability, high-quality deposit bases, and concentrated exposure to the Australian housing market.
The premium is not a sign of overvaluation in isolation. It is the market pricing in a set of defensive income characteristics that global peers do not share.
Beyond the PE: what a Dividend Discount Model adds to the WBC picture
The DDM offers a complementary valuation lens precisely because dividends tend to be more stable and predictable than earnings for mature financial institutions. Where the PE ratio uses trailing profits as its anchor, the DDM values a stock based on the present value of its expected future dividends.
The dividend discount model was developed by John Burr Williams in 1938 as a direct response to the speculative excesses of the 1920s, with the core formula treating a stock’s intrinsic value as the present value of its future income stream rather than any expectation of resale price appreciation.
The model requires three inputs:
- Annual dividend: the expected yearly payout per share. WBC’s 1H26 interim dividend of 77 cents (fully franked, payable 26 June 2026) annualises to approximately $1.54.
- Dividend growth rate: the expected annual rate at which dividends will increase over time.
- Required rate of return: the minimum annual return an investor demands for holding the stock, reflecting its risk.
Adjusting those latter two assumptions produces a wide valuation range. Research estimates place WBC’s DDM fair value between approximately $34.05 and $48.64, depending on inputs. Simply Wall St’s model, which applies a specific set of growth and discount rate assumptions, arrives at $34.87.
“At $37.44, WBC trades approximately 7.4% above Simply Wall St’s fair value estimate of $34.87, a premium that sits at the upper end of the Big 4 range when NAB and ANZ are trading below their respective sector-average implied values.”
WBC’s 77.1% payout ratio in 1H26 sits comfortably within the bank’s stated 70-80% policy, and CET1 capital of 12.4% (above the 11.25% target) leaves approximately $2.7 billion in excess capital supporting dividend sustainability.
The yield comparison across the Big 4 adds a further dimension.
| Bank | Annualised Dividend | Price | Forward Yield |
|---|---|---|---|
| WBC | ~$1.54 | $37.44 | ~4.1% |
| CBA | — | $175.91 | ~3.2% |
| NAB | — | $38.36 | ~4.8% |
| ANZ | — | $36.79 | ~4.6% |
WBC’s forward yield of approximately 4.1% sits in the middle of the Big 4 range. Both NAB and ANZ offer higher yields, consistent with their lower PE multiples, while CBA’s lower yield reflects its premium valuation.
Why the PE premium may or may not be justified: analyst views and key risks
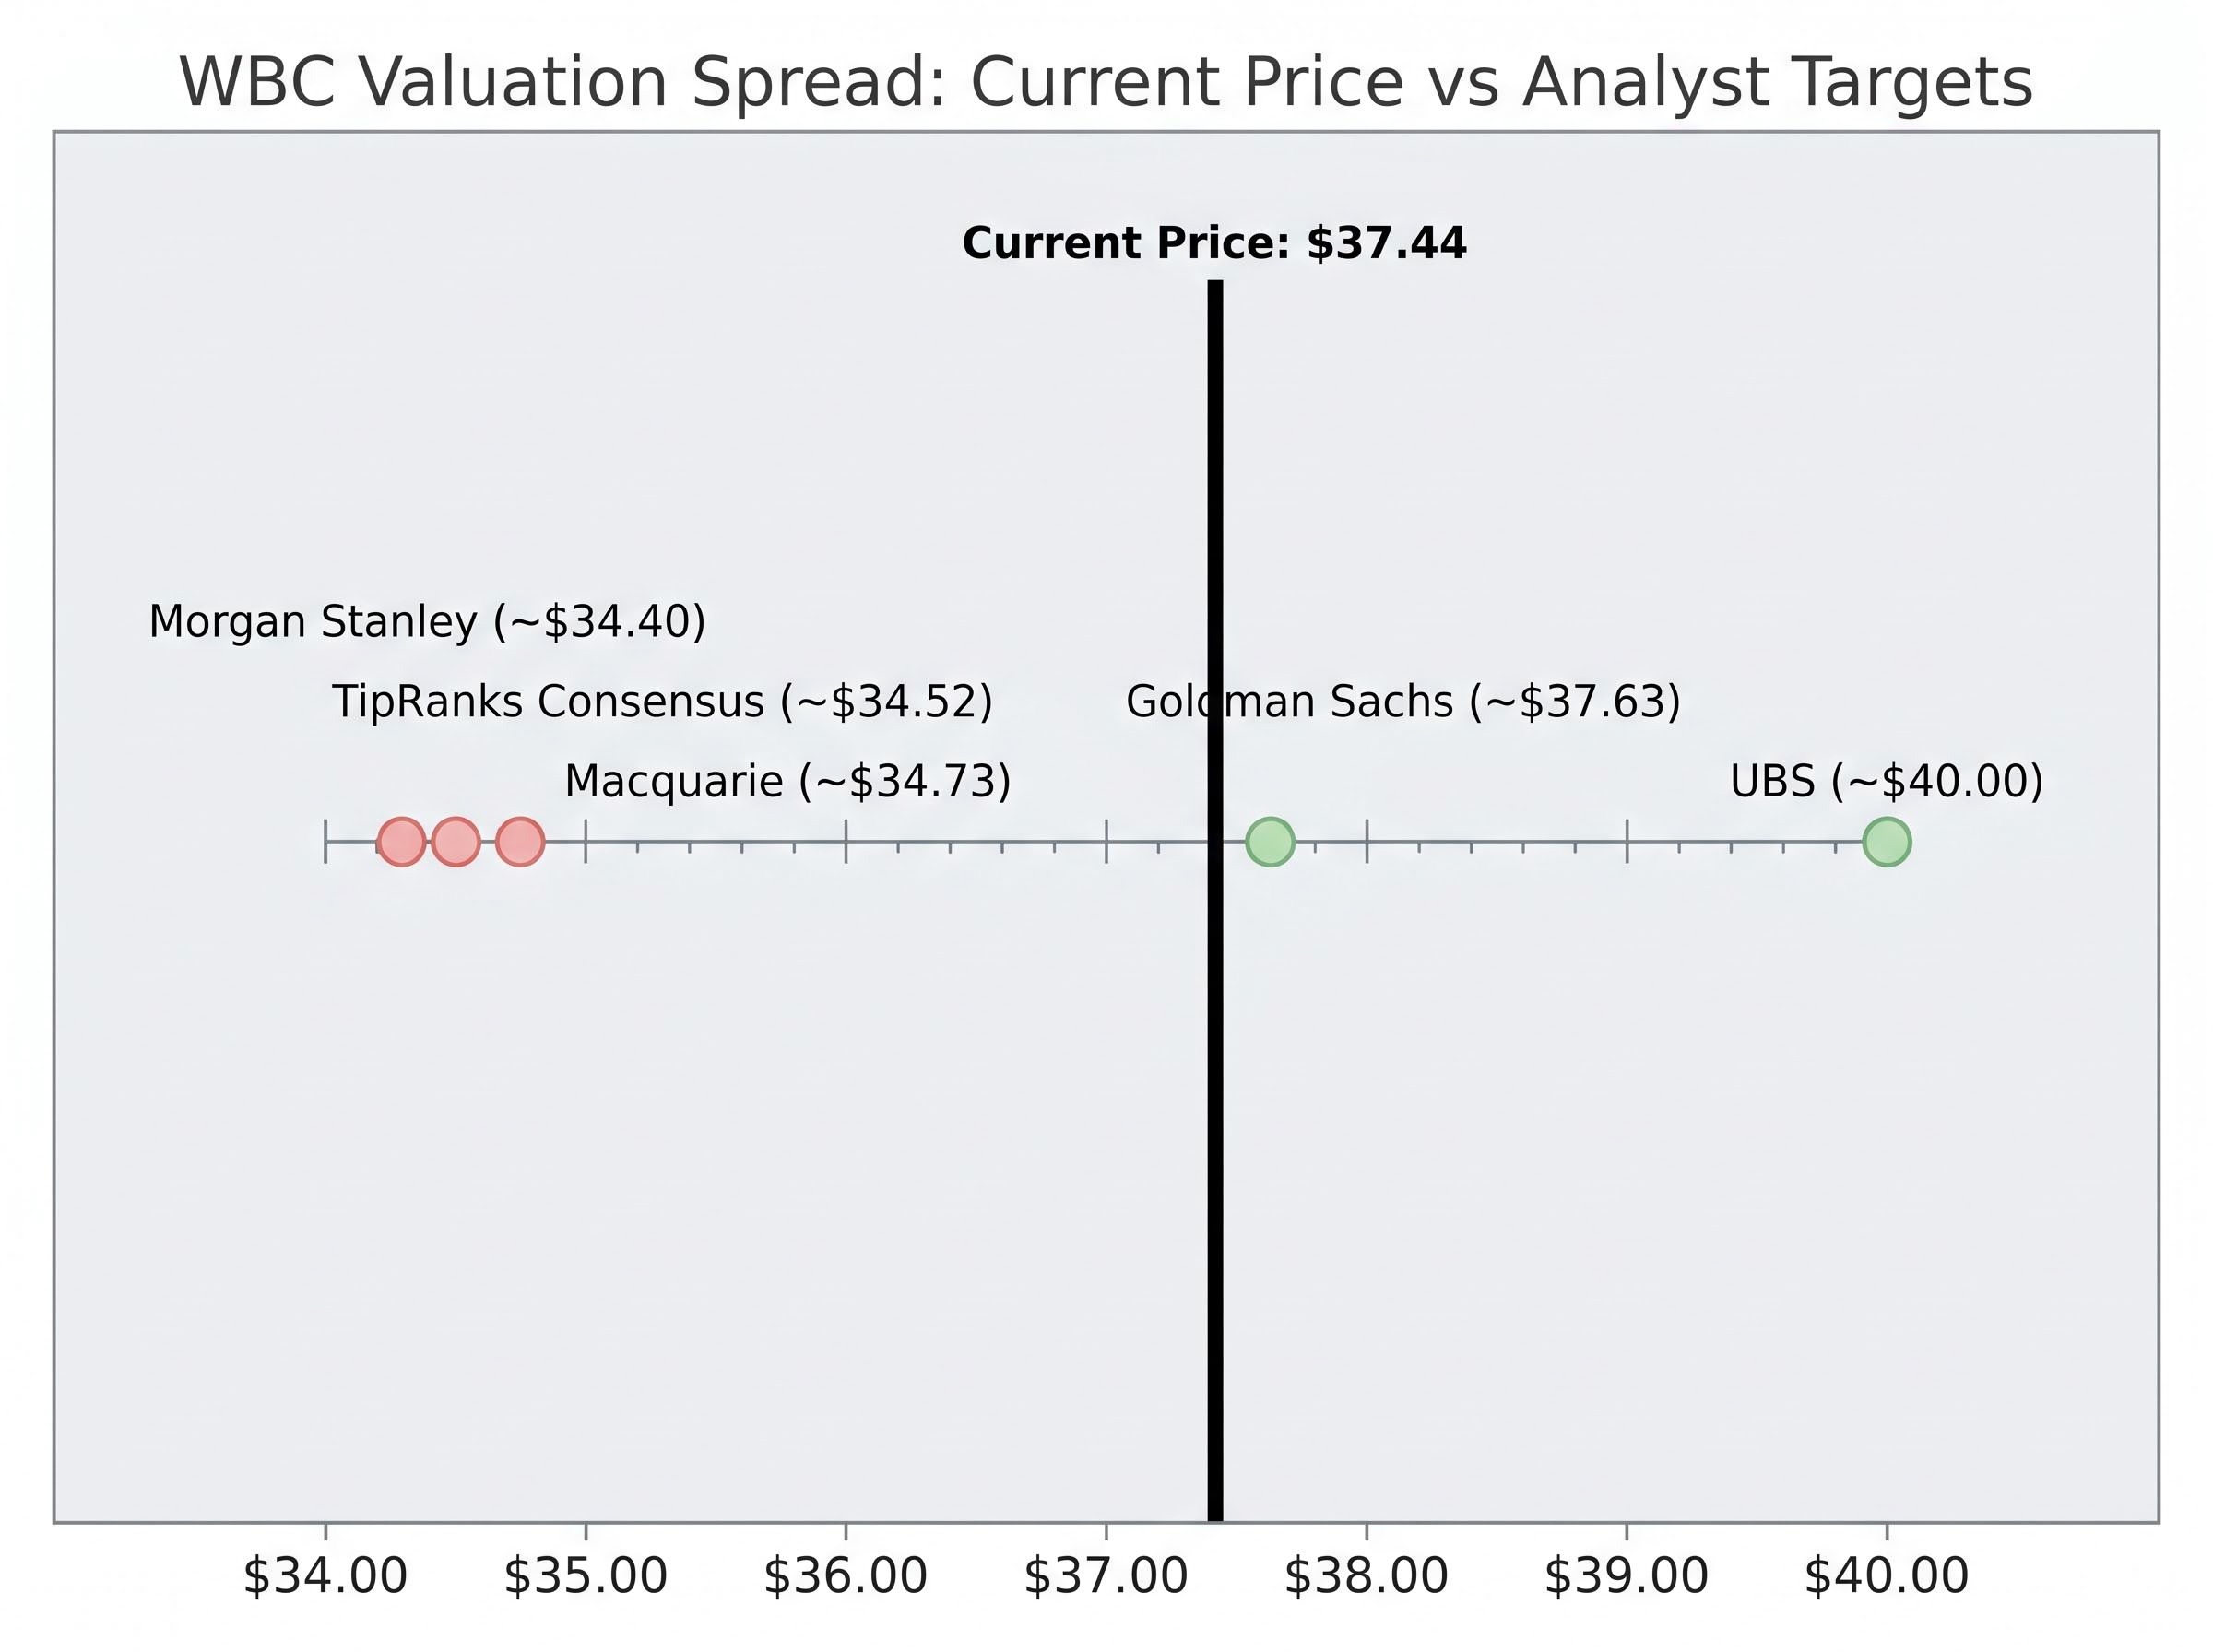
Post-1H26 analyst consensus leans neutral to mildly negative, with the spread of verified price targets telling the story of a genuinely contested valuation.
The Big Four analyst consensus entering results season already tilted bearish on three of the four banks, with CET1 capital adequacy confirmed as a non-issue across the sector and stretched valuations relative to earnings growth expectations cited as the primary driver of sell ratings.
| Broker | Rating | Price Target | Rationale |
|---|---|---|---|
| Morgan Stanley | Sell | ~$34.40 | NIM and revenue headwinds |
| Macquarie | Sell | ~$34.73 | Valuation stretched |
| Goldman Sachs | Neutral | ~$37.63 | Balanced risk-reward |
| UBS | Hold | ~$40.00 | Lending growth upside |
The TipRanks blended consensus target sits at approximately $34.52 (hold/neutral), implying downside from the current price.
The bull case for holding WBC at current prices
- Above-system lending growth: Business lending rose 13% to $120 billion in 1H26, with Australian mortgages also growing above system.
- Capital strength: CET1 at 12.4% and approximately $2.7 billion in excess capital provide a buffer for continued distributions.
- Cost discipline: Operating expenses were cut 6% to $5.8 billion, partially offsetting revenue pressure.
- Labour market support: Australian unemployment at 4.3% (March 2026, per ABS) underpins credit quality across the mortgage book.
The bear case: where the premium looks hard to justify
- NIM compression: NIM declined approximately 6 basis points to roughly 1.9% in 1H26, and the RBA’s hike to 4.35% on 5 May 2026 adds further pressure as mortgage competition remains intense.
- Revenue contraction: Total revenue fell 2% half-on-half to $11.3 billion, with non-interest income down 3%.
- Technology investment drag: Elevated expenditure on the UNITE programme continues to weigh on the cost base, and the payoff timeline remains uncertain.
- Analyst positioning: Two of the four major brokers carry sell ratings, and the blended consensus target of $34.52 sits approximately 8% below the current price.
The RBA’s May 2026 rate decision, which lifted the cash rate target by 25 basis points to 4.35%, cited persistent inflationary pressures as the primary rationale, a move that directly tightens the funding cost environment for Australian mortgage lenders competing aggressively on variable rate pricing.
The tension between these two cases is real. The lending growth and capital position point to a bank executing well operationally. The NIM trajectory and the RBA’s latest move point to an earnings environment that may not support the current multiple.
WBC’s valuation premium: a conclusion built on methodology, not a buy signal
Three independent valuation signals point in a similar direction. The PE ratio of 19.2x exceeds the sector average of 18x. Simply Wall St’s fair value estimate of $34.87 sits 7.4% below the current price. The blended sell-side consensus target of approximately $34.52 implies comparable downside. On each measure, WBC at $37.44 appears modestly overvalued relative to the available benchmarks.
The PE-to-sector-average comparison and DDM cross-check applied here are not WBC-specific tools. The same methodology can be applied to any ASX bank stock, using trailing EPS, peer multiples, and dividend inputs to construct a valuation reference range.
Quantitative models, however, are starting points. A complete assessment of WBC requires qualitative judgement on management execution, the UNITE programme’s cost trajectory, and the RBA’s rate path through the second half of 2026. The numbers presented here frame the question; they do not settle it.
The same WBC valuation model can produce a dramatically different fair value range depending on macro assumptions about RBA rate trajectory, housing price direction, and employment trends, with NAB sensitivity analysis illustrating how a single percentage point change in the discount rate shifts the implied intrinsic value by more than 20%.
“On a PE basis, on a DDM basis, and against the majority of sell-side price targets, WBC at $37.44 appears modestly overvalued. Whether that premium is worth paying depends on confidence in the bank’s medium-term earnings recovery.”
This article is for informational purposes only and should not be considered financial advice. Investors should conduct their own research and consult with financial professionals before making investment decisions. Past performance does not guarantee future results. Financial projections are subject to market conditions and various risk factors.