American Airlines Posts Record Revenue, $382M Loss on Fuel Spike
40 mins ago

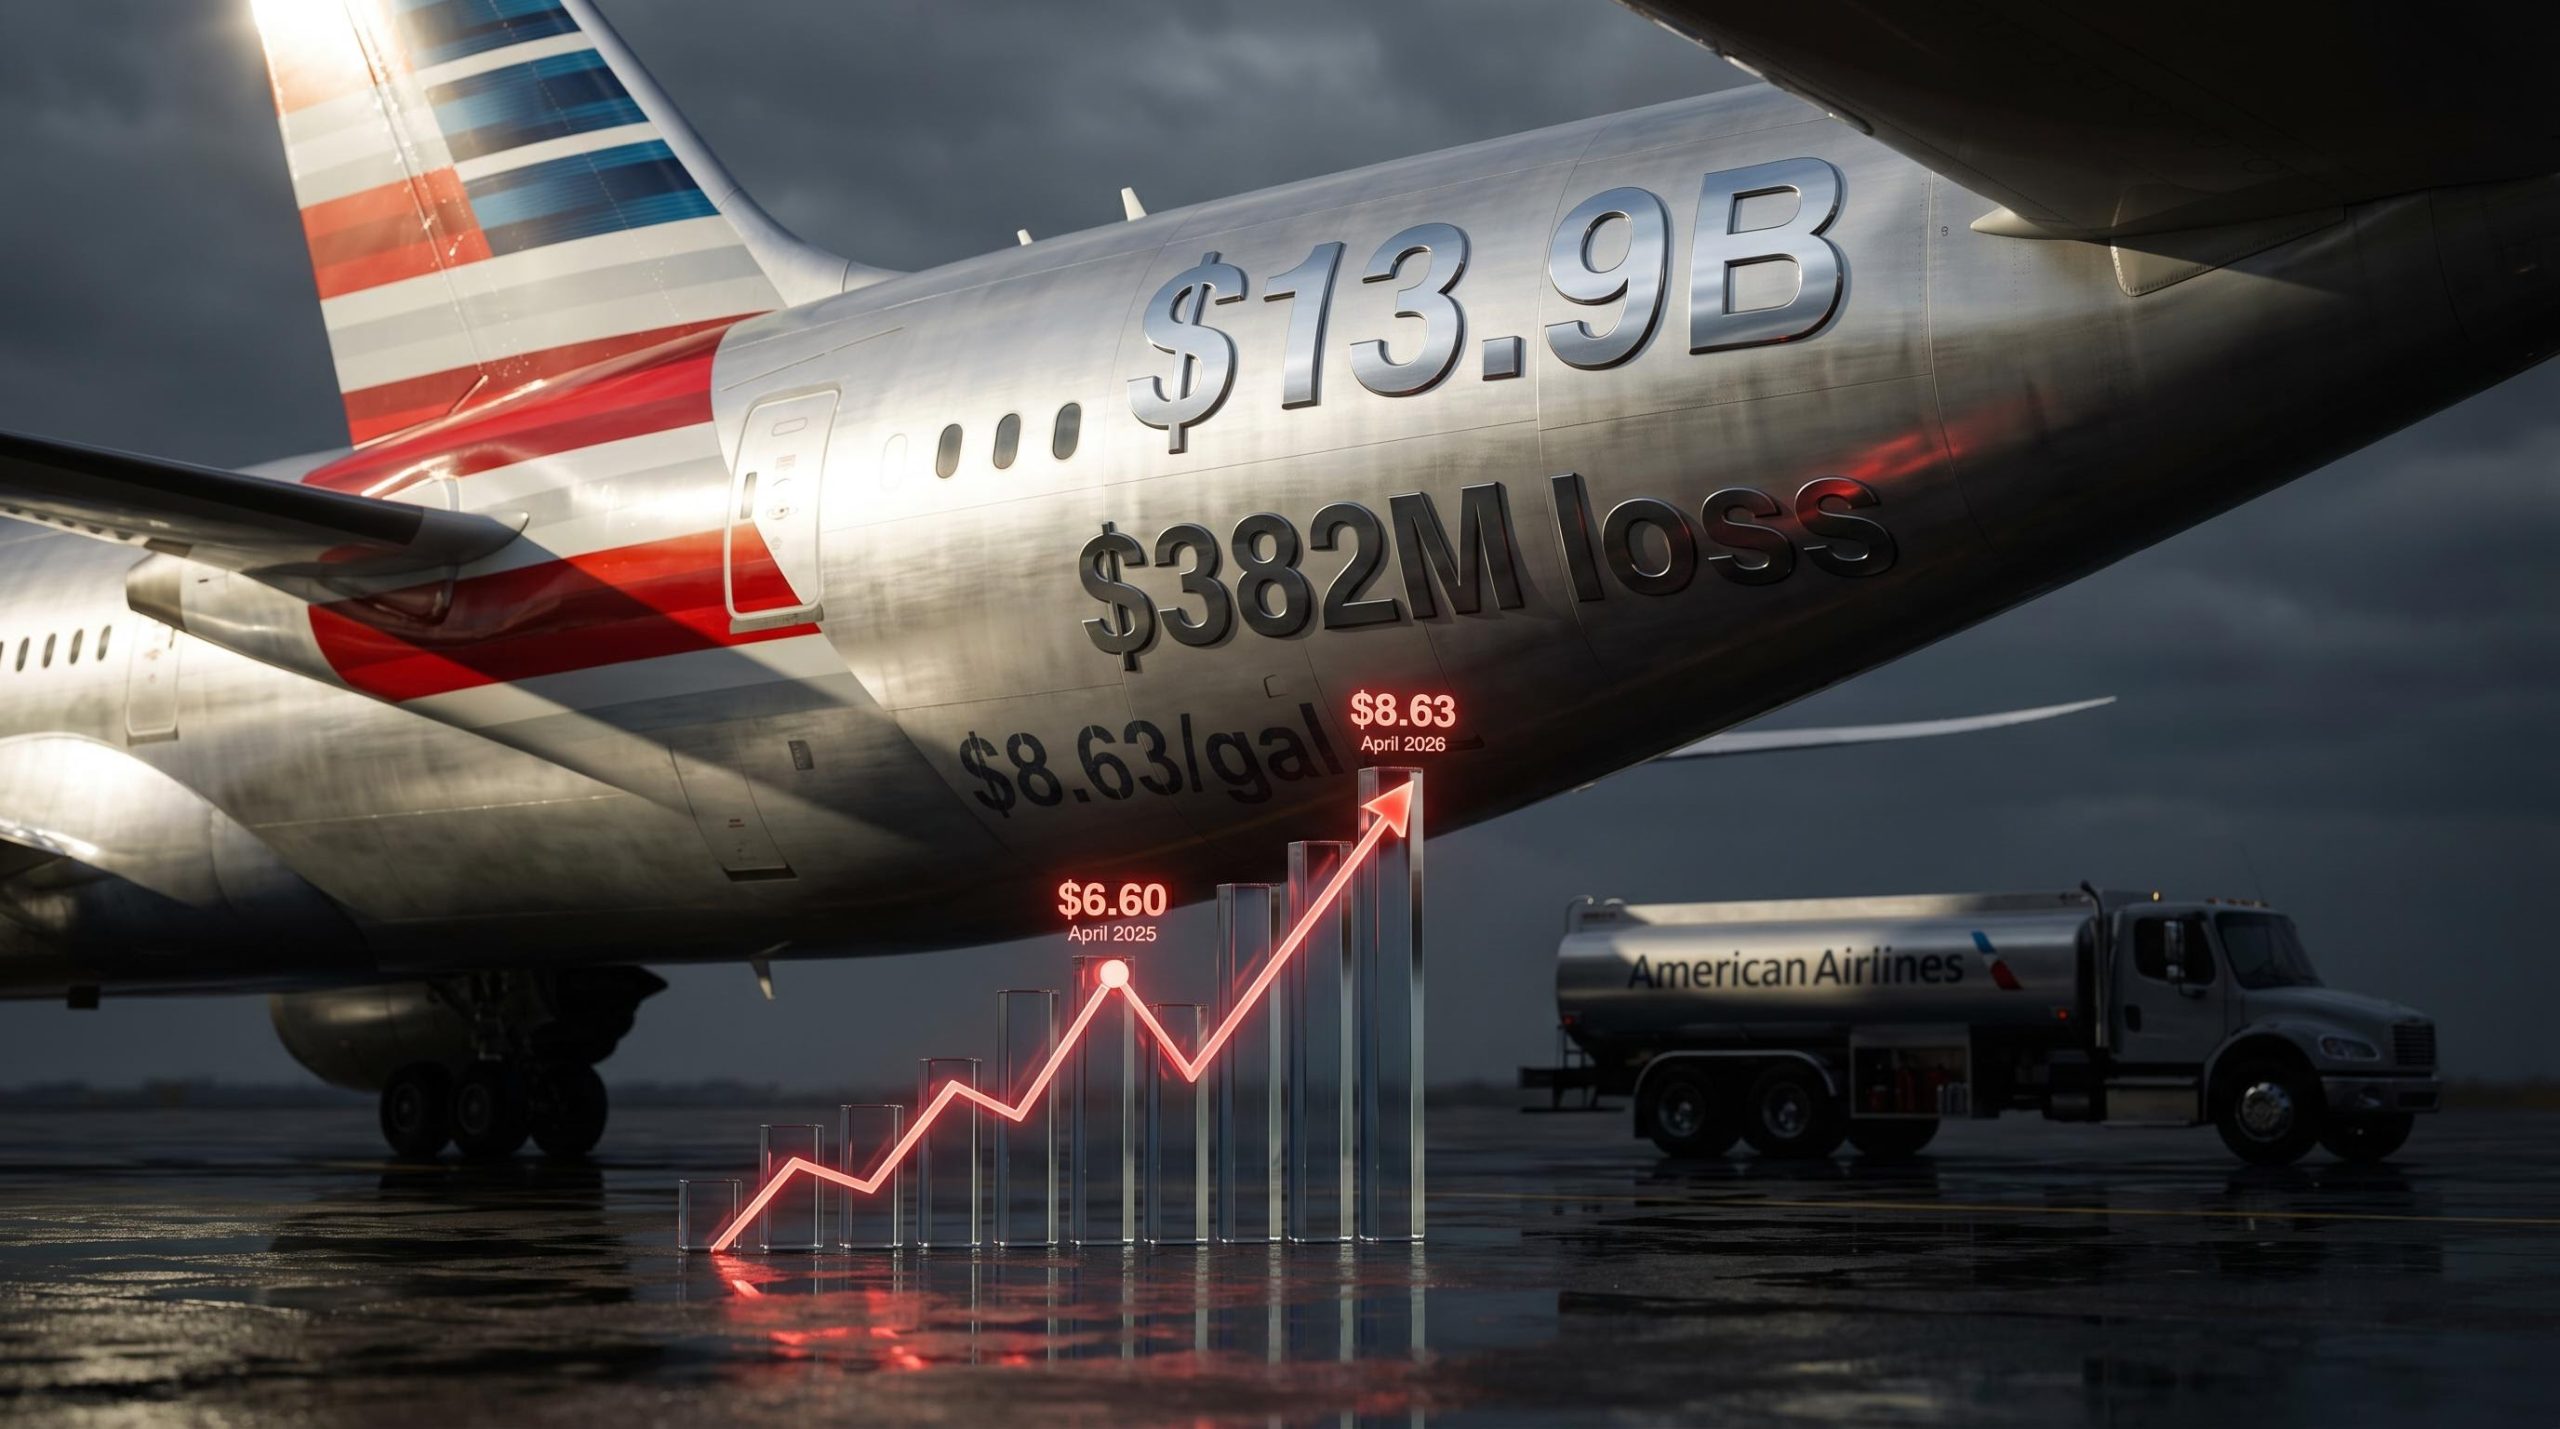
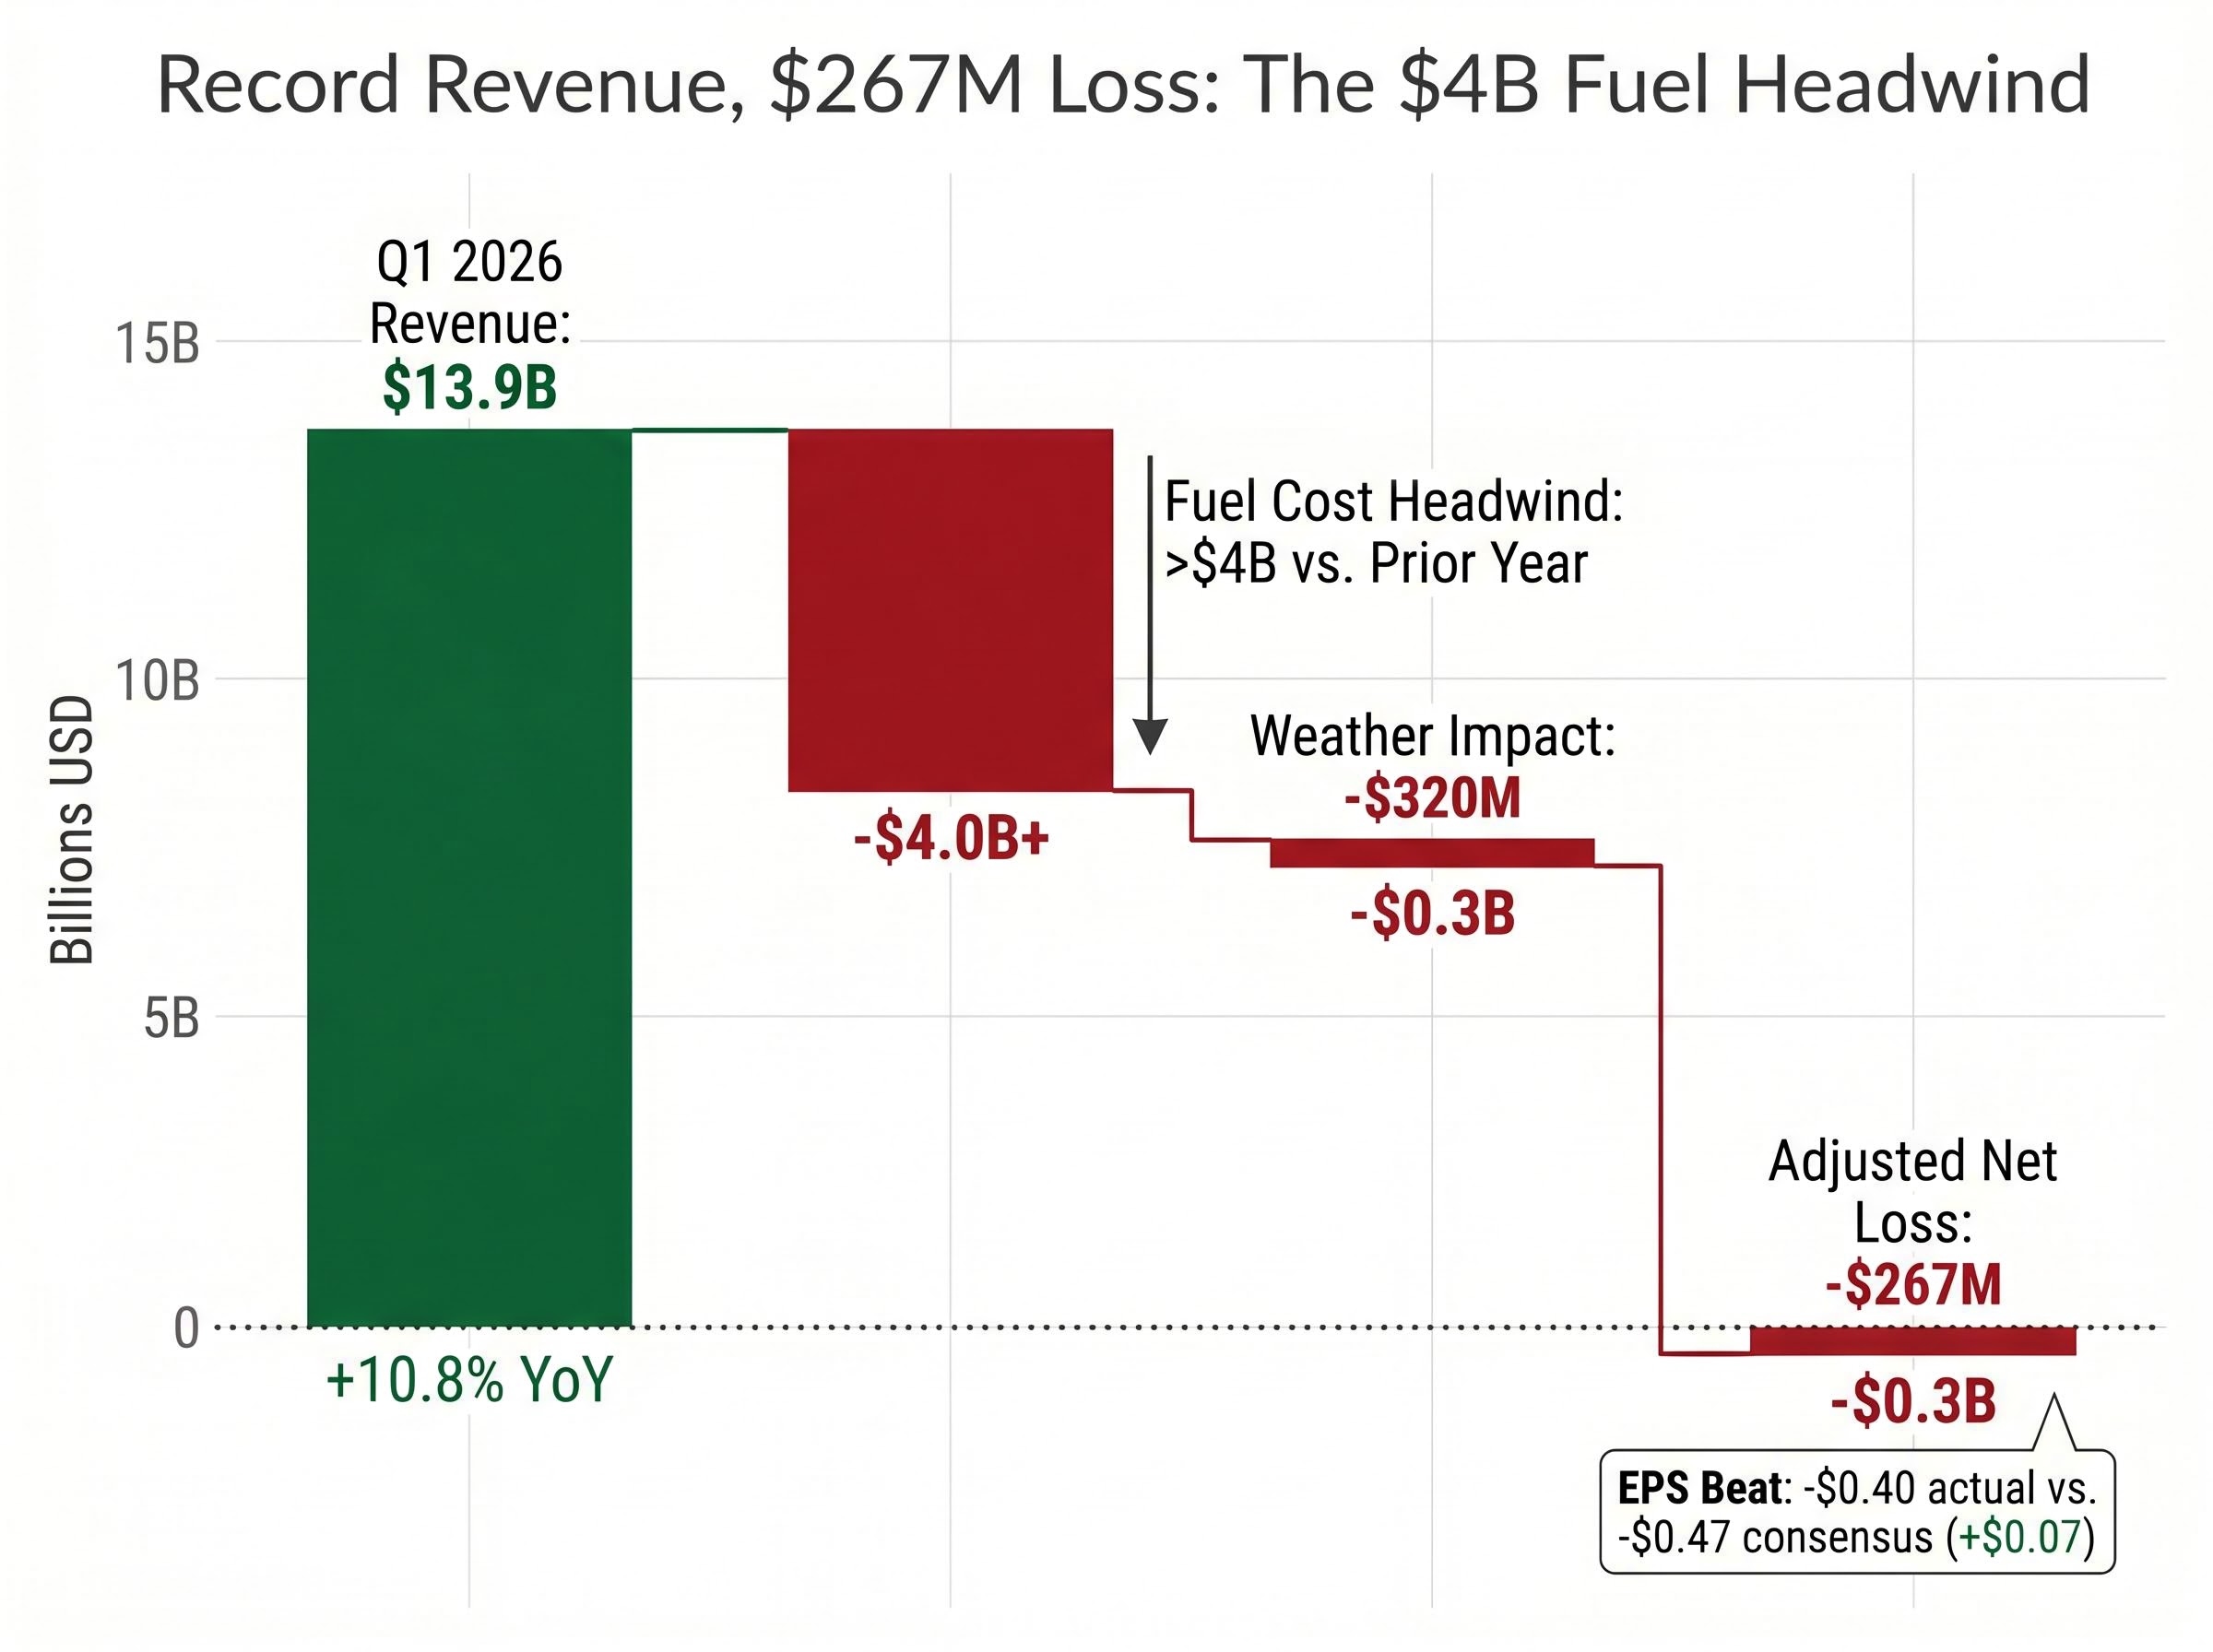
American Airlines delivered record first-quarter revenue of $13.9 billion in Q1 2026, a 10.8% year-over-year increase, yet still recorded an adjusted net loss of $267 million (negative $0.40 per diluted share). The result beat analyst consensus expectations of negative $0.47 per share by $0.07, creating a paradox: how does a company surpass earnings forecasts while losing hundreds of millions? The answer lies in a single cost factor that overwhelmed every strategic gain the airline achieved during the quarter.
CEO Robert Isom emphasised the company’s four strategic priorities (customer experience, network optimisation, premium revenue development, and loyalty programme expansion) as drivers of the revenue strength. However, fuel costs exceeding $4 billion above prior-year levels consumed the gains, leaving American’s transformation initiatives succeeding on revenue generation whilst macroeconomic forces prevented those revenues from translating to profit.
The headline numbers appear contradictory until examined as interconnected pieces of a larger operating reality. American generated $13.9 billion in Q1 revenue, surpassing its previous first-quarter record and exceeding analyst expectations ranging from $13.75 billion to $13.926 billion. The airline’s adjusted earnings per share of negative $0.40 beat consensus by $0.07, a meaningful margin surprise in an environment where most carriers struggled to meet lowered expectations.
American reported an adjusted net loss rather than GAAP net loss, a distinction governed by SEC guidance on non-GAAP financial measures that requires companies to present the most directly comparable GAAP measure with equal prominence and reconcile the adjustment items.
That revenue strength came from unit revenue gains across the entire network. Total revenue per available seat mile (TRASM) increased 7.6% to 19.32 cents. Passenger revenue per available seat mile (PRASM) rose 6.5% to 17.35 cents. Atlantic passenger unit revenue surged 16.7%, reflecting particularly strong international demand.
Yet the company still lost $267 million on an adjusted basis. The resolution to this apparent contradiction sits in the cost structure. Fuel expense increases exceeding $4 billion versus the prior year consumed the revenue gains and then some. Management recorded nine of the highest revenue intake weeks in the company’s 100-year history during Q1, yet that record demand could not overcome the magnitude of the fuel headwind.
Fuel Cost Impact
Incremental fuel expense versus prior year: exceeding $4 billion
Winter storms reduced revenue by an estimated $320 million during the quarter, meaning underlying demand proved substantially stronger than reported figures initially suggested. Strip out the weather impact, and the revenue performance becomes even more impressive. The unit revenue strength persisted despite capacity increases of 3.0% in available seat miles, indicating pricing power remained intact.
Understanding how a company beats expectations whilst losing hundreds of millions clarifies how to interpret airline earnings in the current fuel environment. A headline beat does not signal fundamental strength when a single uncontrollable cost factor dominates the profit equation. The revenue generation engine is working; the cost structure overwhelms it.
The Strait of Hormuz handles approximately 20% of global oil trade. Conflict with Iran that began around 4 April 2026 (shortly after Q1 ended) closed this critical shipping lane, creating what the International Energy Agency characterised as the “largest supply disruption in the history of the global oil market”.
The second Strait of Hormuz closure following the U.S. vessel seizure on 19 April pushed Brent crude to $95.21 per barrel and WTI to $87.48, with the ceasefire expiring on 22 April amid conflicting diplomatic signals. The closure occurred during American’s Q1 reporting period, creating the fuel price environment that produced the quarter’s loss.
The IEA Oil Market Report for April 2026 documented global oil supply falling by 10.1 million barrels per day to 97 million barrels per day in March, with attacks on Middle Eastern energy infrastructure and Strait of Hormuz tanker restrictions creating the historic disruption that drove fuel prices to the levels American confronted in Q1.
Fuel prices traced a sharp upward trajectory following the conflict onset:
Regional variations compounded the challenge. The Southern and Western U.S. averaged $9.37 per gallon, whilst the Central region paid $7.18 per gallon. The U.S. Gulf Coast spot price ranged from $3.92 to $4.07 per gallon in mid-April.
IEA Assessment
“The largest supply disruption in the history of the global oil market.”
Management’s full-year fuel assumption of approximately $4.00 per gallon anchors the company’s 2026 guidance. This assumption produces an incremental fuel expense exceeding $4 billion for the full year compared to 2025 levels. Long-haul flight costs increased by approximately $104 per passenger according to industry studies, a margin compression that no amount of premium cabin revenue growth can fully offset in the near term.
This context explains the majority of the gap between American’s revenue performance and profitability across the industry. Every U.S. carrier confronted the same fuel reality in Q1. The question becomes which airlines possessed the cost structure, network efficiency, and strategic positioning to generate profit despite the headwind.
Four major U.S. carriers reported Q1 results, each confronting the same fuel cost environment yet delivering vastly different profitability outcomes.
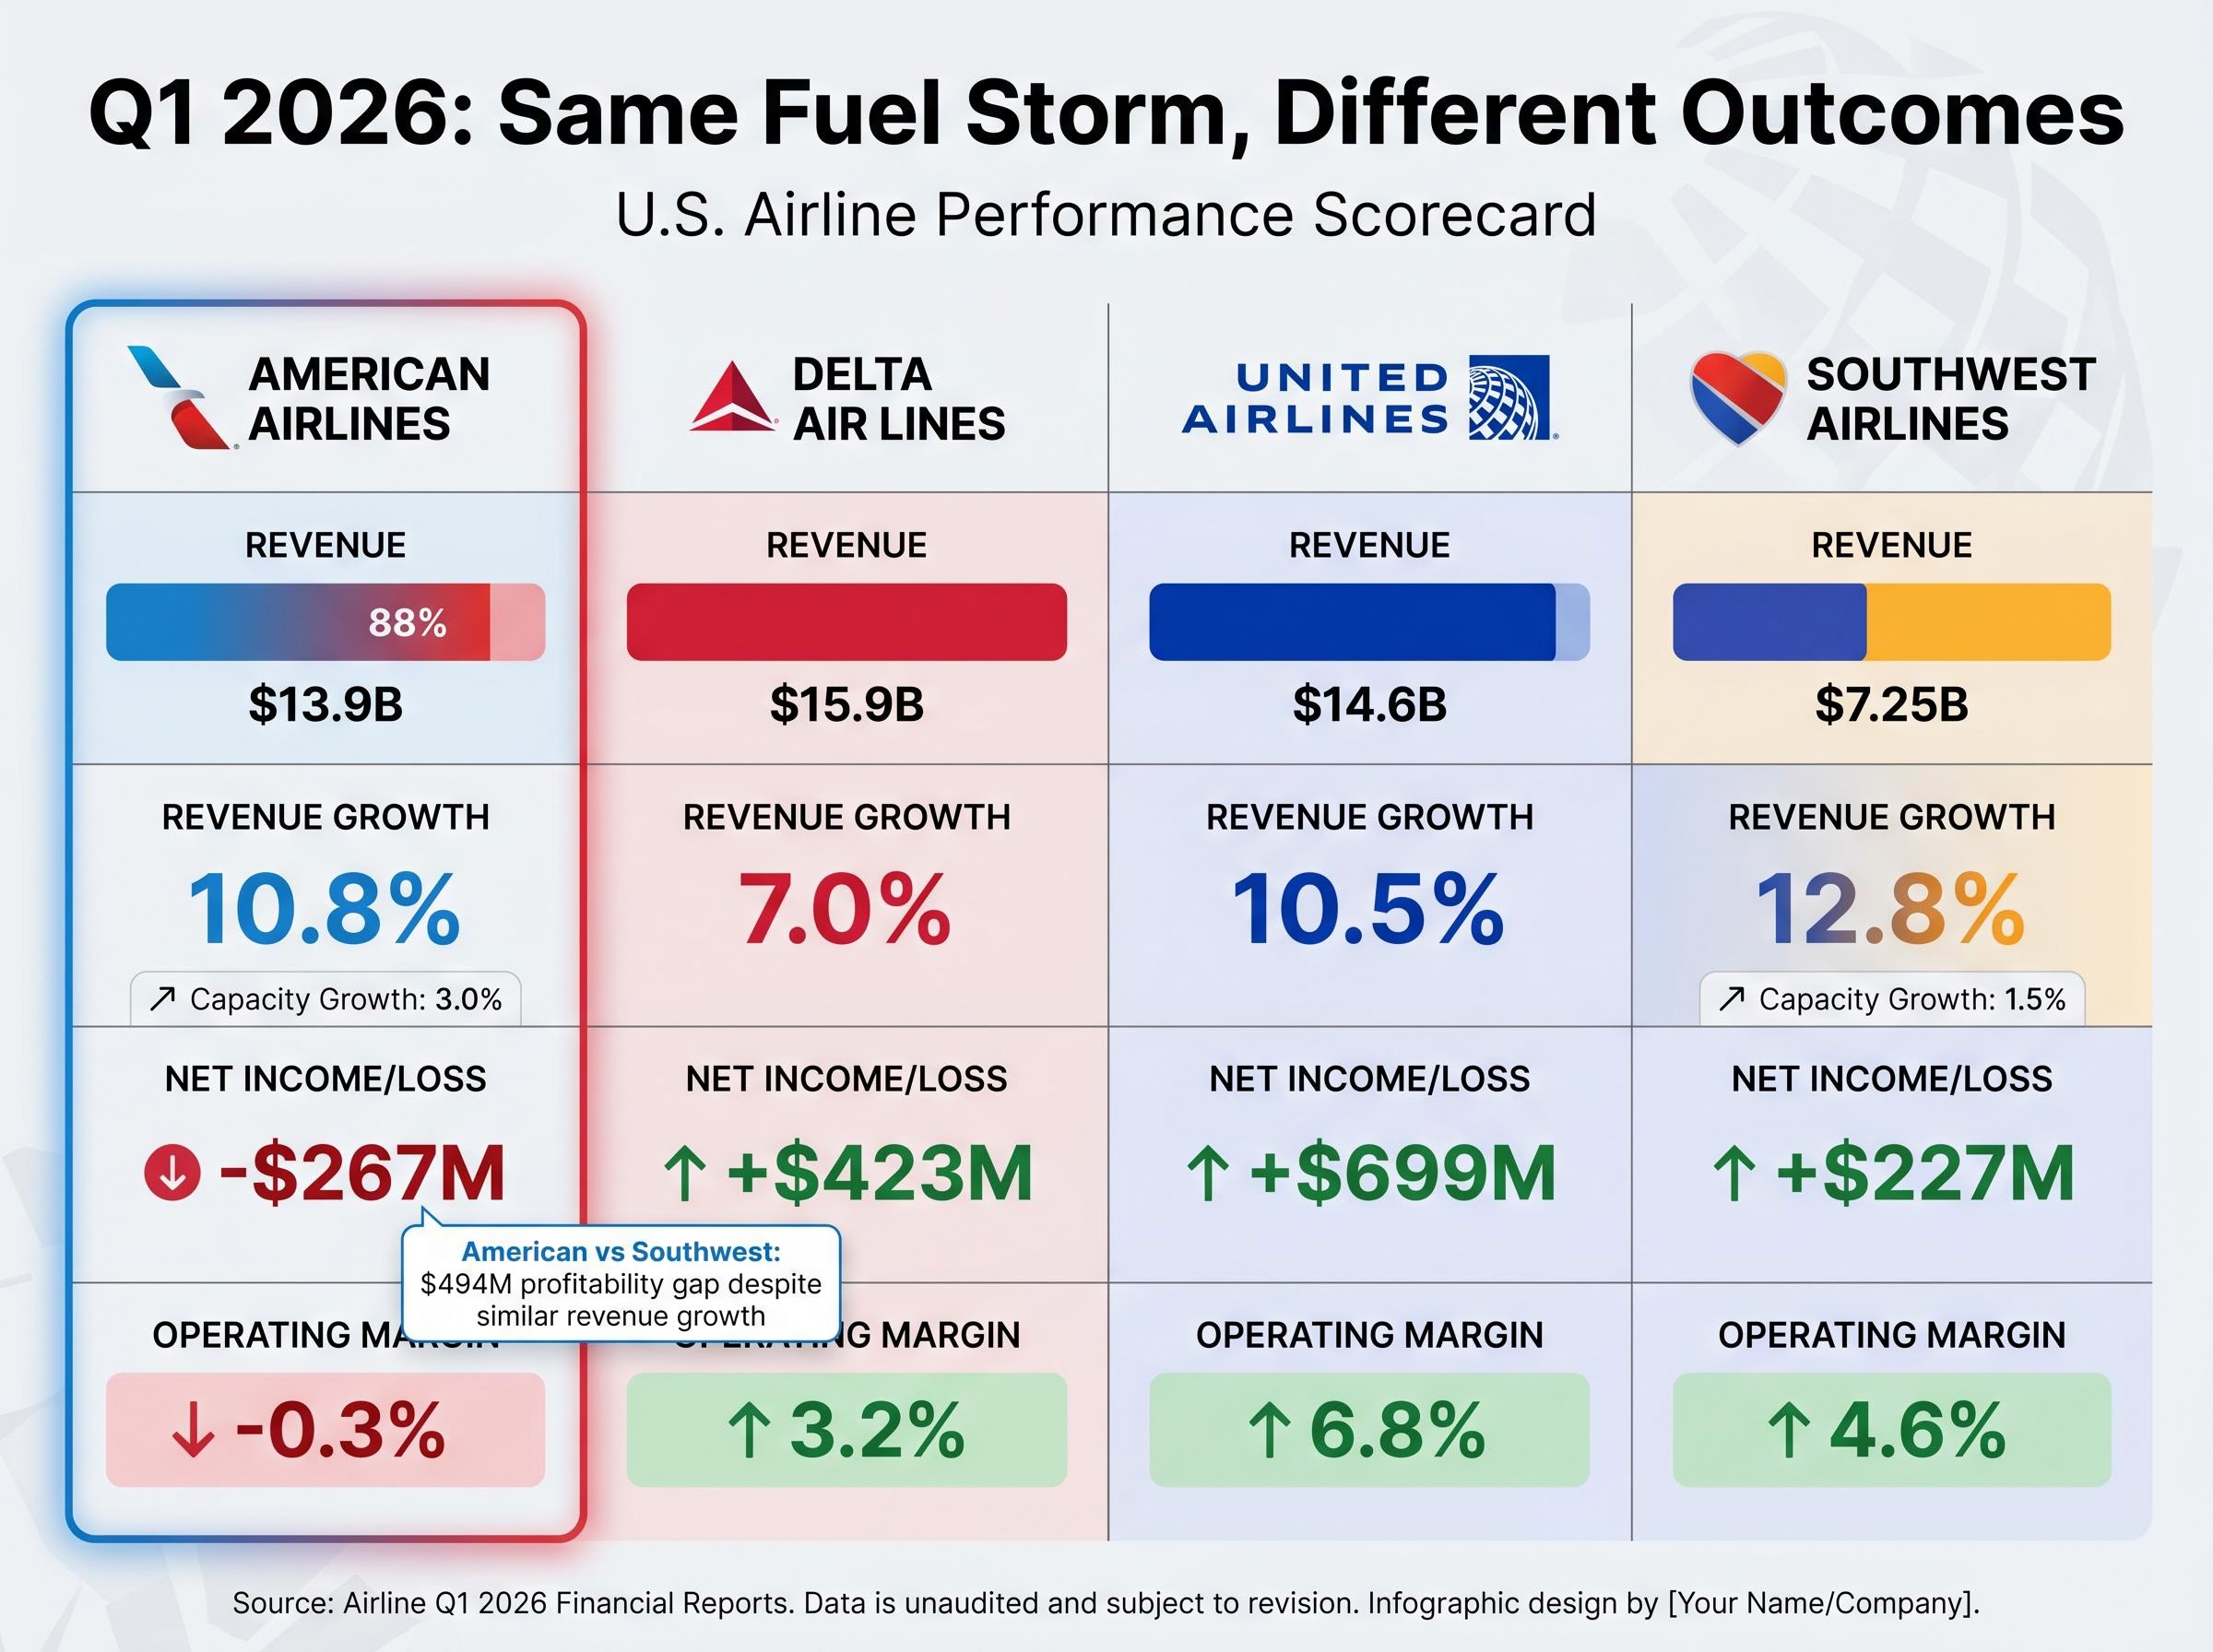
| Carrier | Q1 Revenue | Revenue Growth | Net Income (Loss) | Operating Margin |
|---|---|---|---|---|
| American Airlines | $13.9B | 10.8% | -$267M (adjusted) | -0.3% |
| Delta Air Lines | $15.9B | 7.0% | $423M (adjusted) | 3.2% |
| United Airlines | $14.6B | 10.5% | $699M | 6.8% |
| Southwest Airlines | $7.25B | 12.8% | $227M | 4.6% |
American’s 10.8% revenue growth aligned closely with United’s 10.5% and outpaced Delta’s 7.0%, demonstrating competitive revenue momentum. The profitability picture tells a different story. American recorded a $267 million adjusted loss whilst Delta generated $423 million in adjusted net income, United delivered $699 million, and Southwest achieved $227 million.
The profitability gap between American and Southwest proves particularly instructive. Southwest grew revenue faster (12.8% versus 10.8%) yet achieved a $227 million profit whilst American lost $267 million, a $494 million profitability swing. This divergence reflects Southwest’s completed business transformation plan finalised in late 2025, combined with disciplined capacity management that prioritised yield optimisation over volume growth. Southwest increased capacity by only 1.5% compared to American’s 3.0%, allowing the carrier to capture revenue growth through pricing power rather than seat additions.
United Airlines confronted identical fuel pressures and cut its full-year 2026 EPS guidance by 35-40% to $7-$11, with fuel representing 30-35% of operating costs and an estimated $1.5-2 billion in additional annual fuel expenses. United’s 35-40% full-year guidance cut driven by Iran war fuel costs illustrates the magnitude of the headwind facing the entire U.S. airline sector in Q1 2026.
Southwest achieved profitability through strategic discipline that American’s initiatives have not yet fully delivered. The carrier’s operating margin of 4.6% (up 8.1 percentage points year-over-year) demonstrated how mature transformation programmes translate to profit even in elevated cost environments.
Southwest confronted similar fuel pressures (Q1 fuel costs of $2.73 per gallon, with a $164 million fuel headwind), yet its cost structure absorbed the impact. This contrast illustrates what American’s strategic initiatives might deliver once fully mature, though the timeline for achieving comparable operational efficiency remains uncertain.
Management controls certain factors regardless of fuel market dynamics. American’s execution on those controllable elements demonstrated tangible progress during Q1, providing evidence that the transformation strategy is working even if profitability remains constrained.
Premium revenue streams outpaced main cabin revenue growth by approximately 700 basis points, the clearest signal that the company’s premiumisation strategy is gaining traction. Management committed to expand premium seat capacity at twice the rate of main cabin seats across new and renovated aircraft, a deliberate pivot reflecting both market preference and a strategy to reduce vulnerability to low-cost carrier competition.
Key Strategic Metrics:
CEO Strategic Priorities
Robert Isom emphasised four strategic priorities driving the company’s momentum: customer experience enhancement, network growth and optimisation, premium revenue development, and loyalty programme expansion.
The loyalty programme metrics reveal another revenue stream gaining momentum. AAdvantage enrolment grew 25% year-over-year, whilst co-branded card spend increased 9%. Management recognised the company had previously underperformed relative to competitors on credit card economics, indicating meaningful opportunity for non-ticket revenue enhancement once fully optimised.
Management’s commitment to expand premium capacity at twice the rate of main cabin reflects both market demand and strategic necessity. Premium cabin passengers generate higher absolute revenue per seat, provide better load factor stability during demand softness, and demonstrate less price sensitivity than economy travellers.
This pivot addresses a structural vulnerability: low-cost carriers cannot compete effectively in premium segments. By shifting capacity mix toward premium offerings, American reduces its exposure to the pricing pressure that budget carriers create in economy cabins.
For readers wanting to understand the full detail behind American’s Q1 performance, including the GAAP versus adjusted earnings reconciliation and long-term strategic initiatives, our dedicated analysis of American’s Q1 2026 earnings and $382 million GAAP loss examines the premium cabin expansion strategy, A321XLR network deployment, loyalty programme monetisation targeting $1.5 billion in pre-tax income by 2030, and the structural margin gap American is working to close versus Delta and United.
Total debt of $34.7 billion represents the lowest level since mid-2015 and positions the company to reach management’s stated goal of sub-$35 billion debt by year-end 2026. This milestone matters beyond the symbolic threshold. A debt reduction to below $35 billion could catalyse a credit rating upgrade, reducing refinancing costs and providing ongoing margin benefit once achieved.
The company reduced total debt by approximately $15 billion from the 2021 peak of $49 billion, demonstrating sustained commitment to deleveraging despite constrained profitability. With liquidity of $10.8 billion and unencumbered assets exceeding $27 billion, the balance sheet provides substantial cushion against unexpected disruptions.
Professional analysts hold genuinely divergent views on American’s intrinsic value and probability of successful turnaround execution. The fragmentation in ratings and price targets reflects not confusion but appropriate uncertainty about factors outside anyone’s control.
Consensus rating stands at Hold (neutral), with 6 Buy ratings, 9 Hold ratings, and 2 Sell ratings. The consensus price target ranges from approximately $14.97 to $15.89 depending on the data source, implying roughly 30% upside from current trading levels near $11.50. The stock declined over 20% year-to-date through the earnings announcement.
The price target range tells the more revealing story. Analyst targets span from $10.00 to $22.00, a $12 spread that captures fundamental disagreement about what the company is worth. This dispersion is not analytical sloppiness; it reflects genuine uncertainty about fuel trajectories, demand sustainability, and execution timelines.
Short interest surged approximately 32.1% in March 2026, reaching 74.5 million shares or 11.3% of the outstanding float. This elevated short positioning indicates substantial bearish conviction accumulated as investors positioned for potential downside.
Susquehanna upgraded American from Neutral to Positive with a $20.00 price target, representing the optimistic end of the analytical spectrum. This view emphasises balance sheet progress, strategic execution, and the temporary nature of fuel headwinds.
Bull case arguments:
This perspective frames fuel costs as an extraordinary temporary circumstance that will normalise as geopolitical tensions ease. Once fuel prices retreat from current elevated levels, the record revenue generation should translate to strong profitability given the operational leverage the company has built.
TD Cowen cut its price target from $17.00 to $13.00 (maintaining Buy rating), whilst Jefferies reduced its target from $15.00 to $12.00 (Hold rating). These moves reflect skepticism that American’s cost structure and leverage position leave the company vulnerable even when demand is strong.
Bear case arguments:
This perspective questions whether American can achieve sustainable profitability in an environment where $4 billion in incremental costs overwhelm revenue gains. The full-year guidance essentially flat versus 2025 despite record demand suggests the business model remains broken until costs normalise or revenue growth accelerates further.
Management provided Q2 adjusted EPS guidance ranging from negative $0.20 to positive $0.20, essentially breakeven at the midpoint. This range during the peak spring travel season underscores the fuel headwind’s magnitude. The company expects Q2 revenue to increase 13.5% to 16.5% year-over-year, representing acceleration from Q1’s 10.8% growth, yet that stronger revenue growth translates to minimal profit.
Full-year guidance spans from negative $0.40 to positive $1.10 adjusted EPS, with a midpoint of $0.35 (essentially flat compared to 2025). The $1.50 range in guidance reflects management’s own uncertainty about fuel price trajectories and demand sustainability rather than vague forecasting. It represents honest acknowledgment that factors outside the company’s control will determine whether the year delivers breakeven results or modest profitability.
Key catalysts to monitor:
Management’s fuel assumption of approximately $4.00 per gallon for the full year anchors the guidance. If fuel prices retreat meaningfully below this level, the company could exceed the guidance range. If prices remain elevated or increase further, results could fall toward the bottom end of the range or below.
Projected free cash flow exceeding $2 billion for the full year provides another measure of financial health independent of earnings volatility. This cash generation supports continued debt reduction and maintains balance sheet flexibility regardless of near-term profitability fluctuations.
American Airlines’ Q1 2026 results demonstrate that strategic execution and macroeconomic headwinds can produce paradoxical outcomes. Record revenue of $13.9 billion, premium segment strength outpacing main cabin by 700 basis points, and debt reduction to $34.7 billion represent genuine progress. Yet $4 billion in incremental fuel costs explain why that progress has not yet translated to profitability.
The wide divergence in analyst positions (price targets spanning $10 to $22) is not confusion but appropriate recognition of genuine uncertainty. Whether American delivers on its $0.35 midpoint guidance depends primarily on fuel price trajectory and demand sustainability through the summer travel season, factors outside management’s control.
Q2 results, expected to show breakeven performance during peak travel demand, will provide the next meaningful test of whether the company’s transformation can overcome the extraordinary cost environment. The strategic initiatives are working on revenue generation. The question is whether fuel costs will normalise before demand softens.
This article is for informational purposes only and should not be considered financial advice. Investors should conduct their own research and consult with financial professionals before making investment decisions.
American Airlines reported record Q1 2026 revenue of $13.9 billion, a 10.8% year-over-year increase, but still recorded an adjusted net loss of $267 million (negative $0.40 per diluted share), beating analyst consensus of negative $0.47 per share by $0.07.
Incremental fuel costs exceeding $4 billion versus the prior year, driven largely by the Iran conflict and Strait of Hormuz closure that disrupted global oil supply, consumed the revenue gains and prevented the record demand from translating into profit.
While American posted a $267 million adjusted loss, United earned $699 million, Delta earned $423 million adjusted, and Southwest achieved $227 million profit, all facing the same fuel cost environment but with more mature cost structures or tighter capacity discipline.
Management provided full-year 2026 adjusted EPS guidance of negative $0.40 to positive $1.10, with a midpoint of approximately $0.35, reflecting significant uncertainty around fuel price trajectories and demand sustainability.
Investors should monitor whether spring peak season delivers the guided breakeven performance (Q2 EPS guidance of negative $0.20 to positive $0.20), fuel price developments related to the Iran conflict, and progress toward the year-end debt target of below $35 billion.