
Charter Hall Retail REIT delivers 4% earnings growth and flags 3.5% lift for FY27
In its FY26 full year results presentation, Charter Hall Retail REIT reported operating earnings of 26.4cpu, up 4.0% on FY25 and in line with upgraded guidance. The results marked the completion of a long-stated strategy, with the portfolio now curated to its target mix of 50% shopping centre and 50% net lease convenience retail.
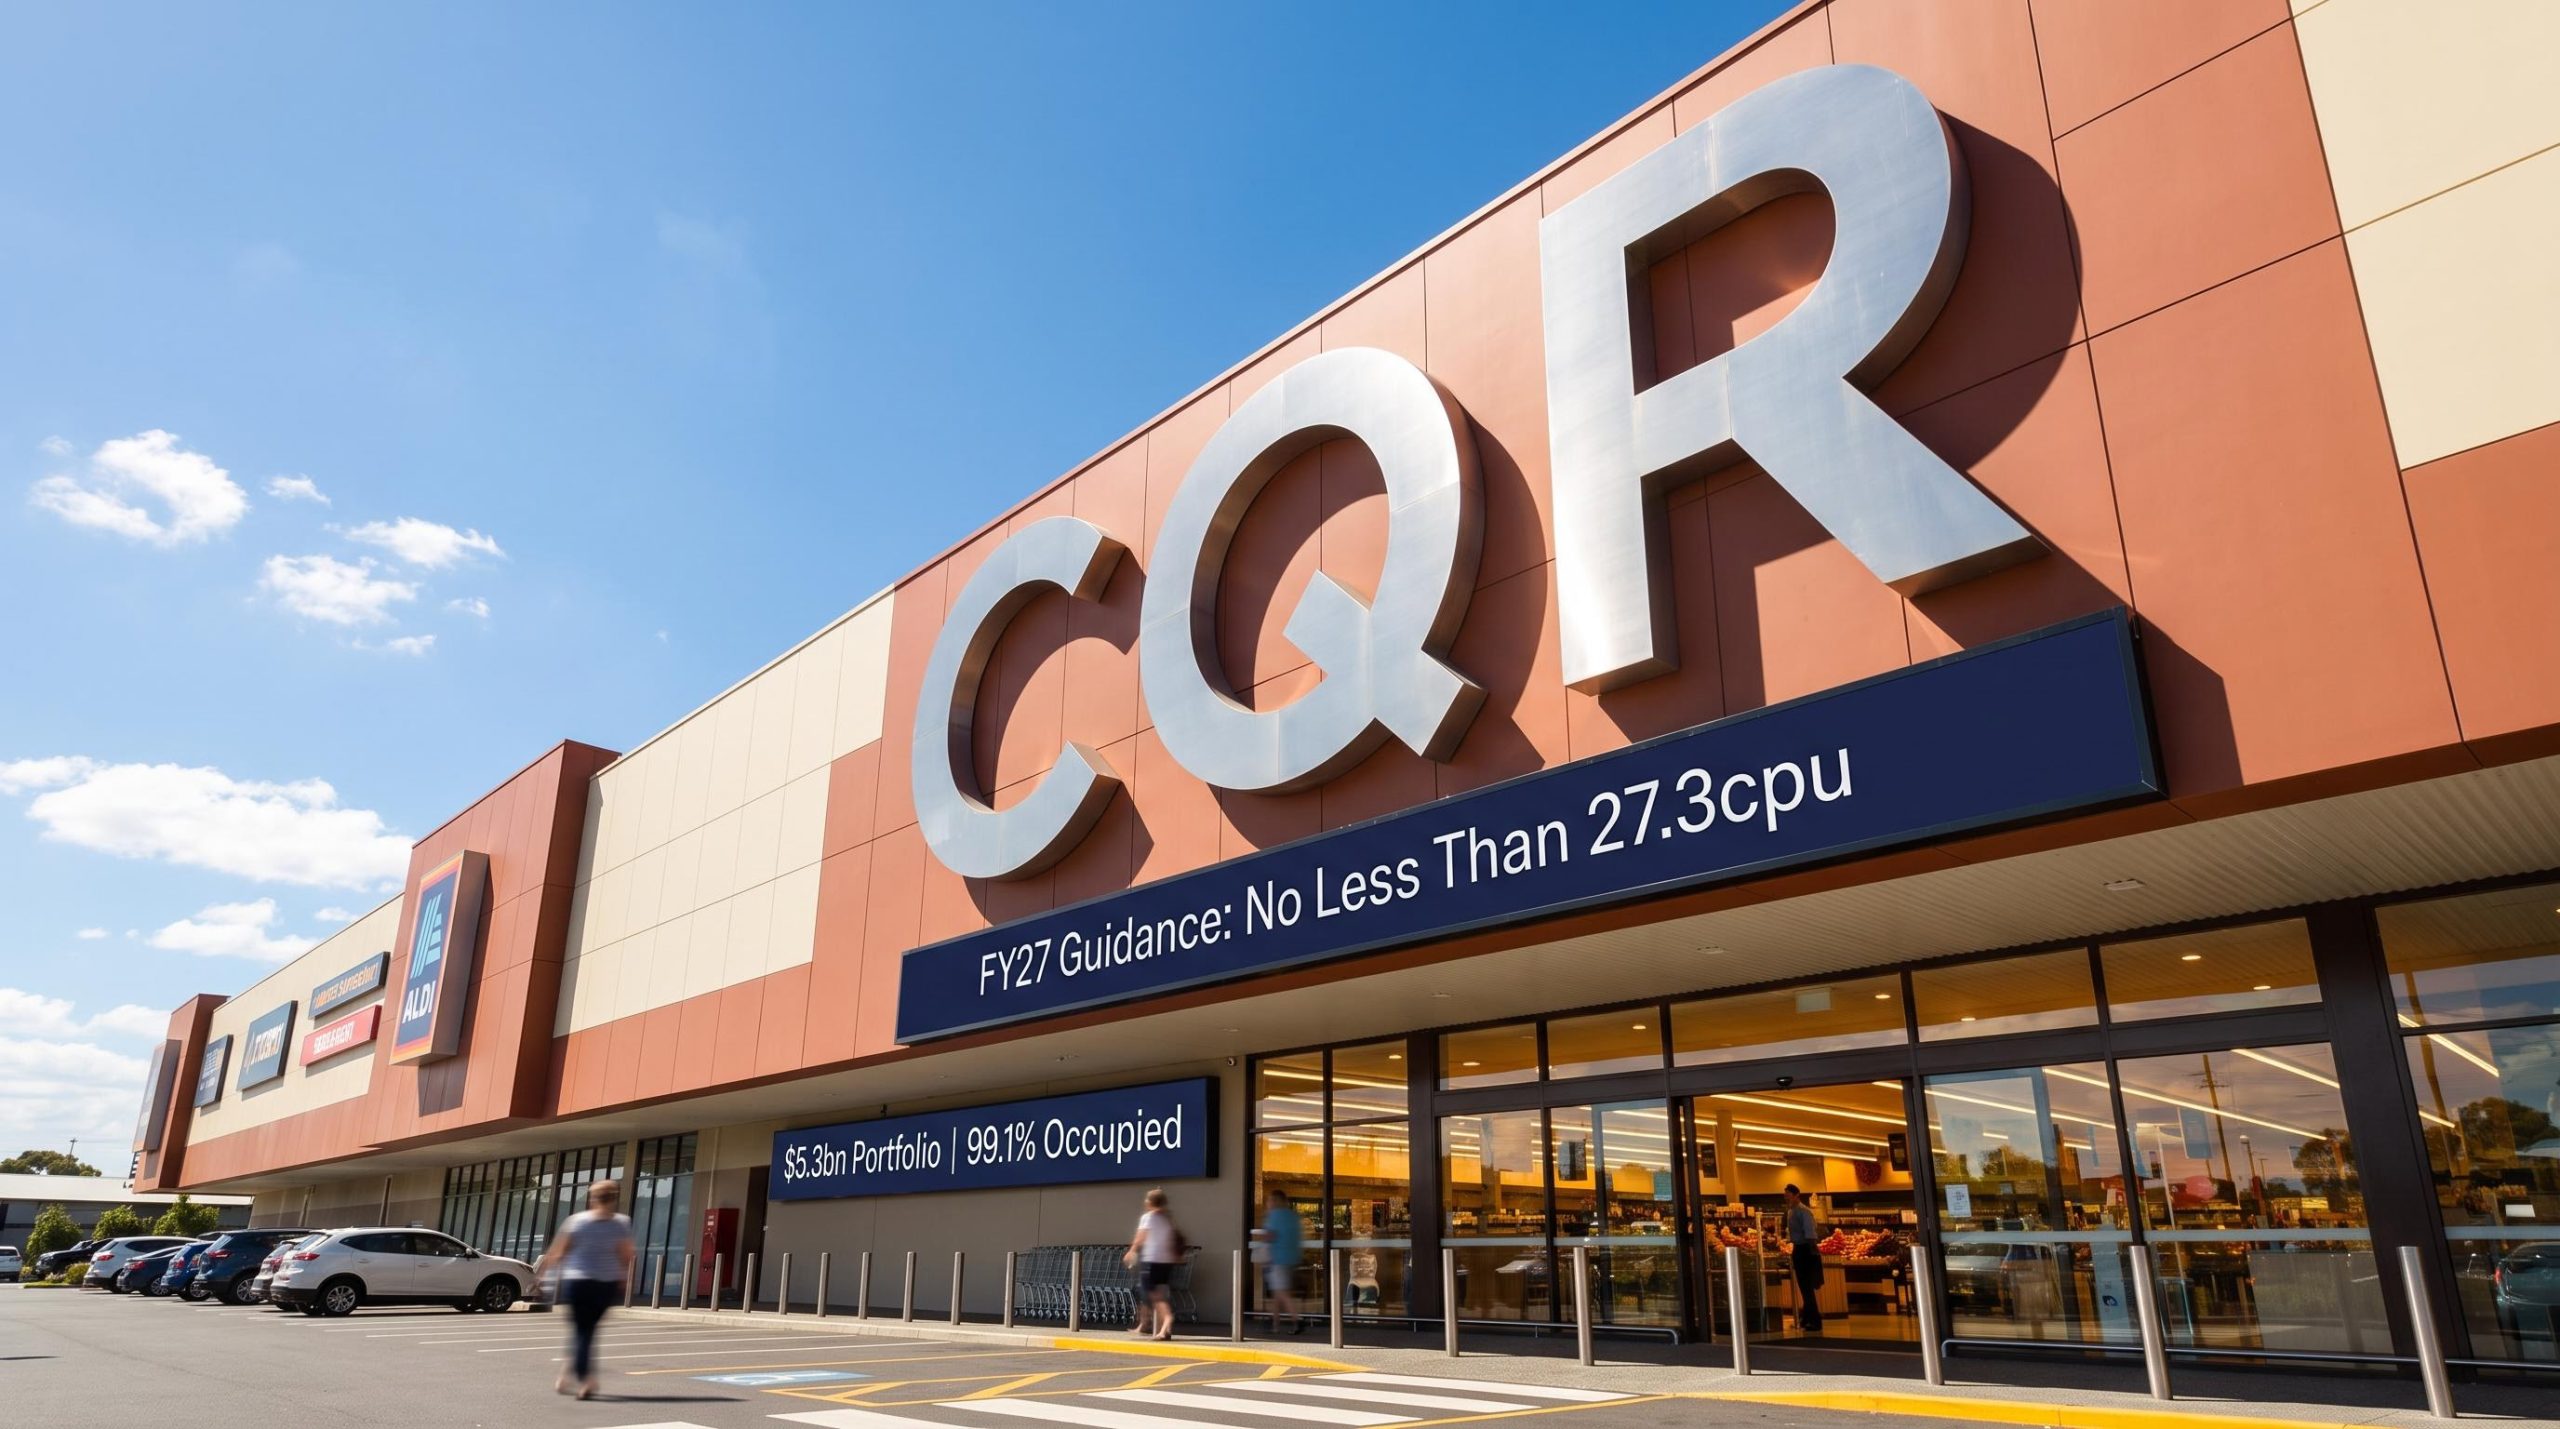
Management outlined a $5.2bn–$5.3bn convenience retail portfolio operating at 99.1% occupancy, underpinning both income quality and resilience. Looking ahead, the REIT flagged FY27 operating earnings guidance of no less than 27.3cpu, representing growth of +3.5% on the year just completed.
When big ASX news breaks, our subscribers know first
FY26 results at a glance
The following headline metrics reflect the REIT’s completed full-year performance to 30 June 2026.
| Metric | FY26 | Change vs FY25 |
|---|---|---|
| Operating earnings | 26.4cpu | +4.0% |
| Distribution | 25.5cpu | +3.3% |
| NTA per unit | $5.03 | +8.4% |
| Portfolio occupancy | 99.1% | +0.2% |
| Same property NPI growth | 3.0% | — |
| 12-month levered portfolio return | 15.8% | — |
| Balance sheet gearing | 30.9% | — |
The results also revealed several capital management gains following the refinance of balance sheet debt to a secured platform:
-
Debt margin reduced 40bps to 125bps following the refinance
-
Weighted average cost of debt of 5.0%
-
Weighted average debt maturity of 3.6 years
What “same property NPI growth” means for investors
Same property net property income (NPI) growth, also known as like-for-like growth, measures income growth from assets held across both reporting periods. It strips out the effect of acquisitions and divestments, offering a cleaner read on organic performance.
Both the shopping centre and net lease segments delivered 3.0% same property NPI growth in FY26. For income-focused investors, steady organic growth of this kind helps underpin the reliability of distributions over time.
The pivot to net lease reshapes the portfolio
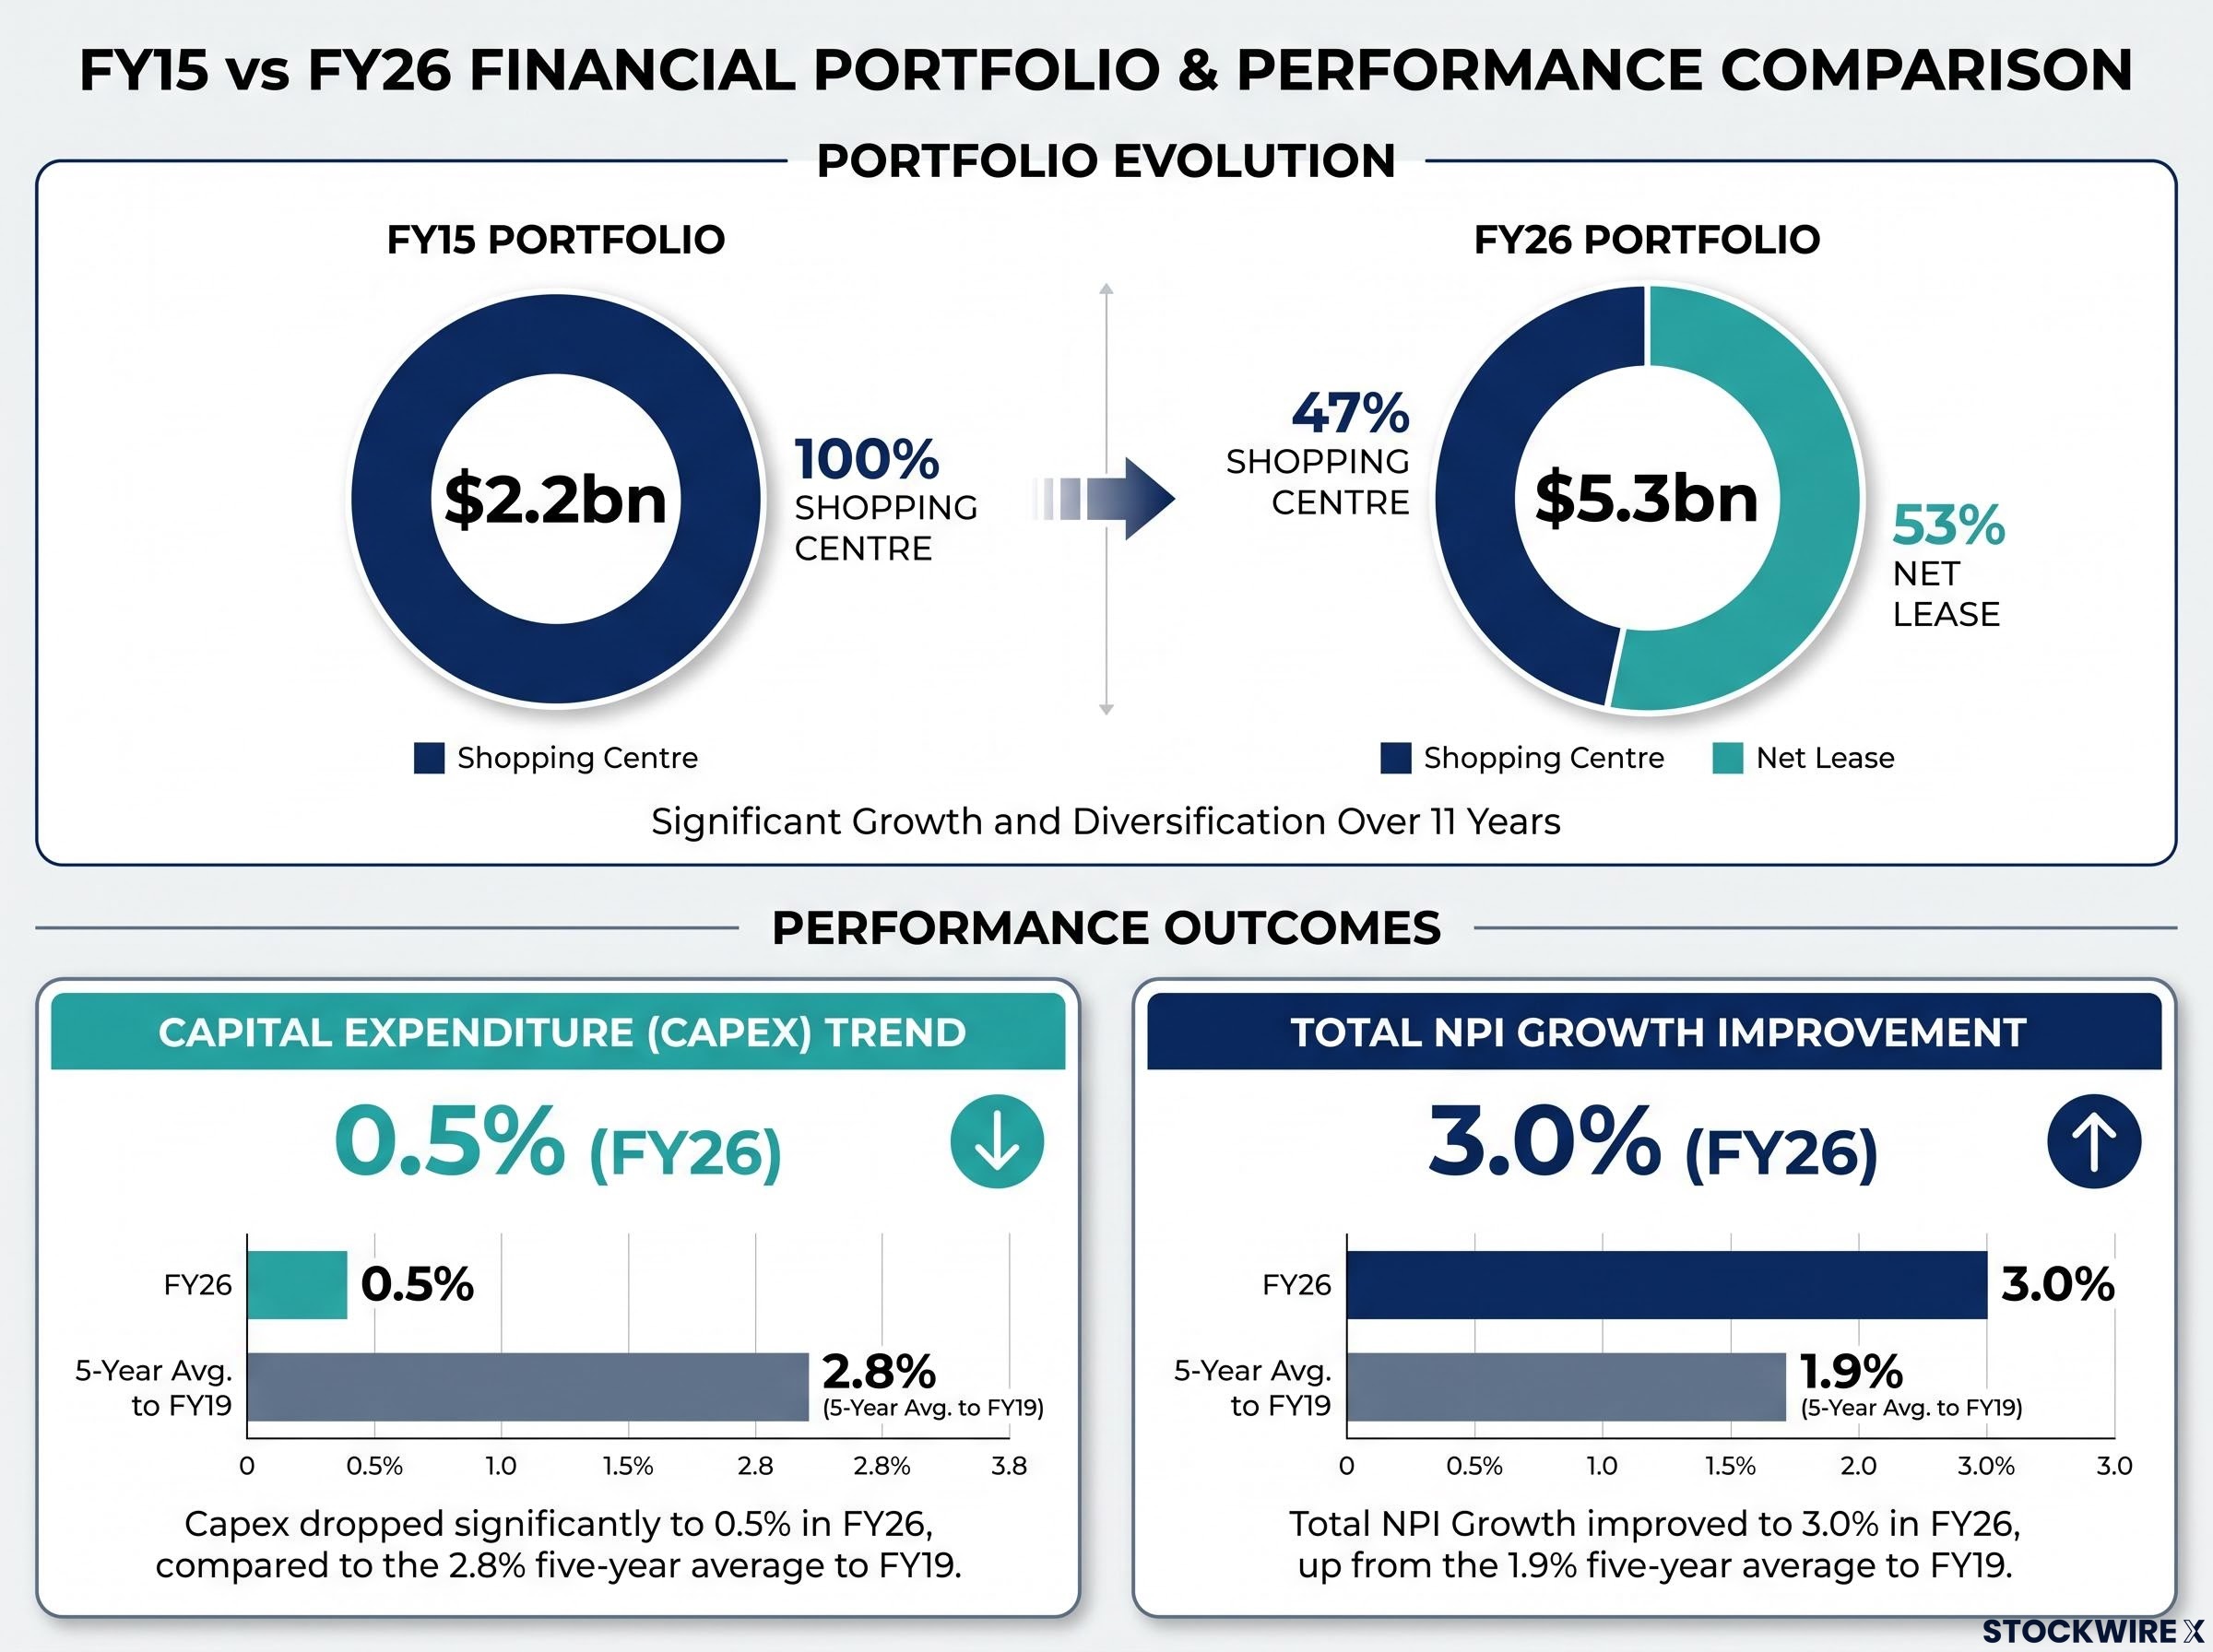
The strategic centrepiece of the FY26 results was the completion of a portfolio shift that has been underway for a decade. In FY15, the REIT was a 100% shopping centre vehicle. By FY26, the portfolio had been curated to 47% shopping centre and 53% net lease by value, delivering on a long-stated strategy rather than a sudden change in direction.
Over that period, the portfolio grew from $2.2bn (FY15) to $5.3bn (FY26). Management highlighted that curation towards net lease drove capital expenditure down to 0.5% of portfolio value in FY26, compared with a 2.8% five-year average to FY19. Total NPI growth improved to 3.0%, up from a 1.9% five-year average to FY19.
The REIT’s stated strategy is to deliver the highest property income and earnings growth from the convenience retail sector.
$317m in value created through platform-driven deals
The REIT leveraged the Charter Hall Group platform to execute Sale and Lease Back and take private transactions across HPI, bp, Ampol, Z Energy and Gull. Management reported total value creation of +$317m on $907m of equity invested, representing an average equity IRR of 18.0% and an overall uplift of 35.0%.
| Investment | Equity Invested | Equity Value | Value Created | Equity IRR |
|---|---|---|---|---|
| HPI (AU) | $368m | $440m | $72m | 20.6% |
| bp Australia | $214m | $364m | $150m | 16.3% |
| Z Energy (NZ) | $132m | $152m | $20m | 12.6% |
| bp New Zealand | $131m | $193m | $63m | 18.1% |
| Gull (NZ) | $64m | $85m | $21m | 19.3% |
| Ampol (AU) | $57m | $67m | $10m | 18.5% |
| Total (AUD) | $907m | $1,224m | $317m | 18.0% avg |
Operational strength beneath the headline numbers
The results detailed the operational engine supporting the REIT’s income, spanning supermarket anchors, specialty tenants and broad portfolio diversification.
Supermarkets and specialties performing
Supermarket performance strengthened across the year:
-
Supermarket moving annual turnover (MAT) growth of 3.6%, up from 2.5%
-
89% of supermarkets paying turnover rent or within 10% of doing so
-
416 specialty leases completed with leasing spreads of +4.1%
-
Specialty retention rate lifted to 86%
-
Specialty productivity of $11,748 per sqm, with occupancy cost easing to 10.9%
Portfolio quality and diversification
The portfolio recorded a weighted average lease expiry (WALE) of 7.1 years, with a majors WALE of 8.9 years and tenant arrears held below 0.5%. Across 730 assets, the diversification spans shopping centres, energy and convenience, hospitality and Bunnings.
The net lease segment benefits from CPI-linked rent reviews, with 82% of the net lease portfolio linked to inflation. Management noted the energy and convenience portfolio is to be revalued following the September 26 CPI print, a potential income tailwind.
Valuations turn as cap rate cycle firms
The results revealed a valuation recovery, with a portfolio net valuation increase of $248m (4.9%) driving NTA growth. The weighted average cap rate firmed to 5.45%, down 29bps. On a like-for-like basis, capital values across the portfolio were 32.9% higher in 2026 compared with 2020.
A capitalisation (cap) rate reflects the yield an investor expects from a property. A firming, or lower, cap rate generally signals rising asset values. Management noted the REIT’s valuations are underpinned by income growth rather than market movement alone.
FY27 guidance and outlook
With the 50/50 target now reached, management positioned the REIT for continued income and NTA growth. The forward guidance presented was as follows:
-
Operating earnings of no less than 27.3cpu, representing +3.5% growth on FY26
-
Distribution of no less than 26.4cpu (+3.5%), equating to a 6.5% distribution yield based on a $4.06 unit price at 6 August 2026
Management highlighted several structural tailwinds supporting this outlook:
-
Australian population growth
-
Limited new supply reducing retail space per capita
-
Capital efficiency through tenant retention and strategic partnerships
-
Positioning for the strongest earnings growth among peers, as stated by management
The REIT noted its FY27 guidance is based upon information currently available and barring unforeseen events.
Don’t Miss the Next ASX Real Estate Mover
Big News Blast delivers FREE breaking ASX announcements straight to your inbox within minutes of release, complete with in-depth analysis already done for you. Join 20,000+ investors who stay ahead of the market the moment news drops. Click the “Free Alerts” button at Big News Blast to start receiving real-time coverage today.