
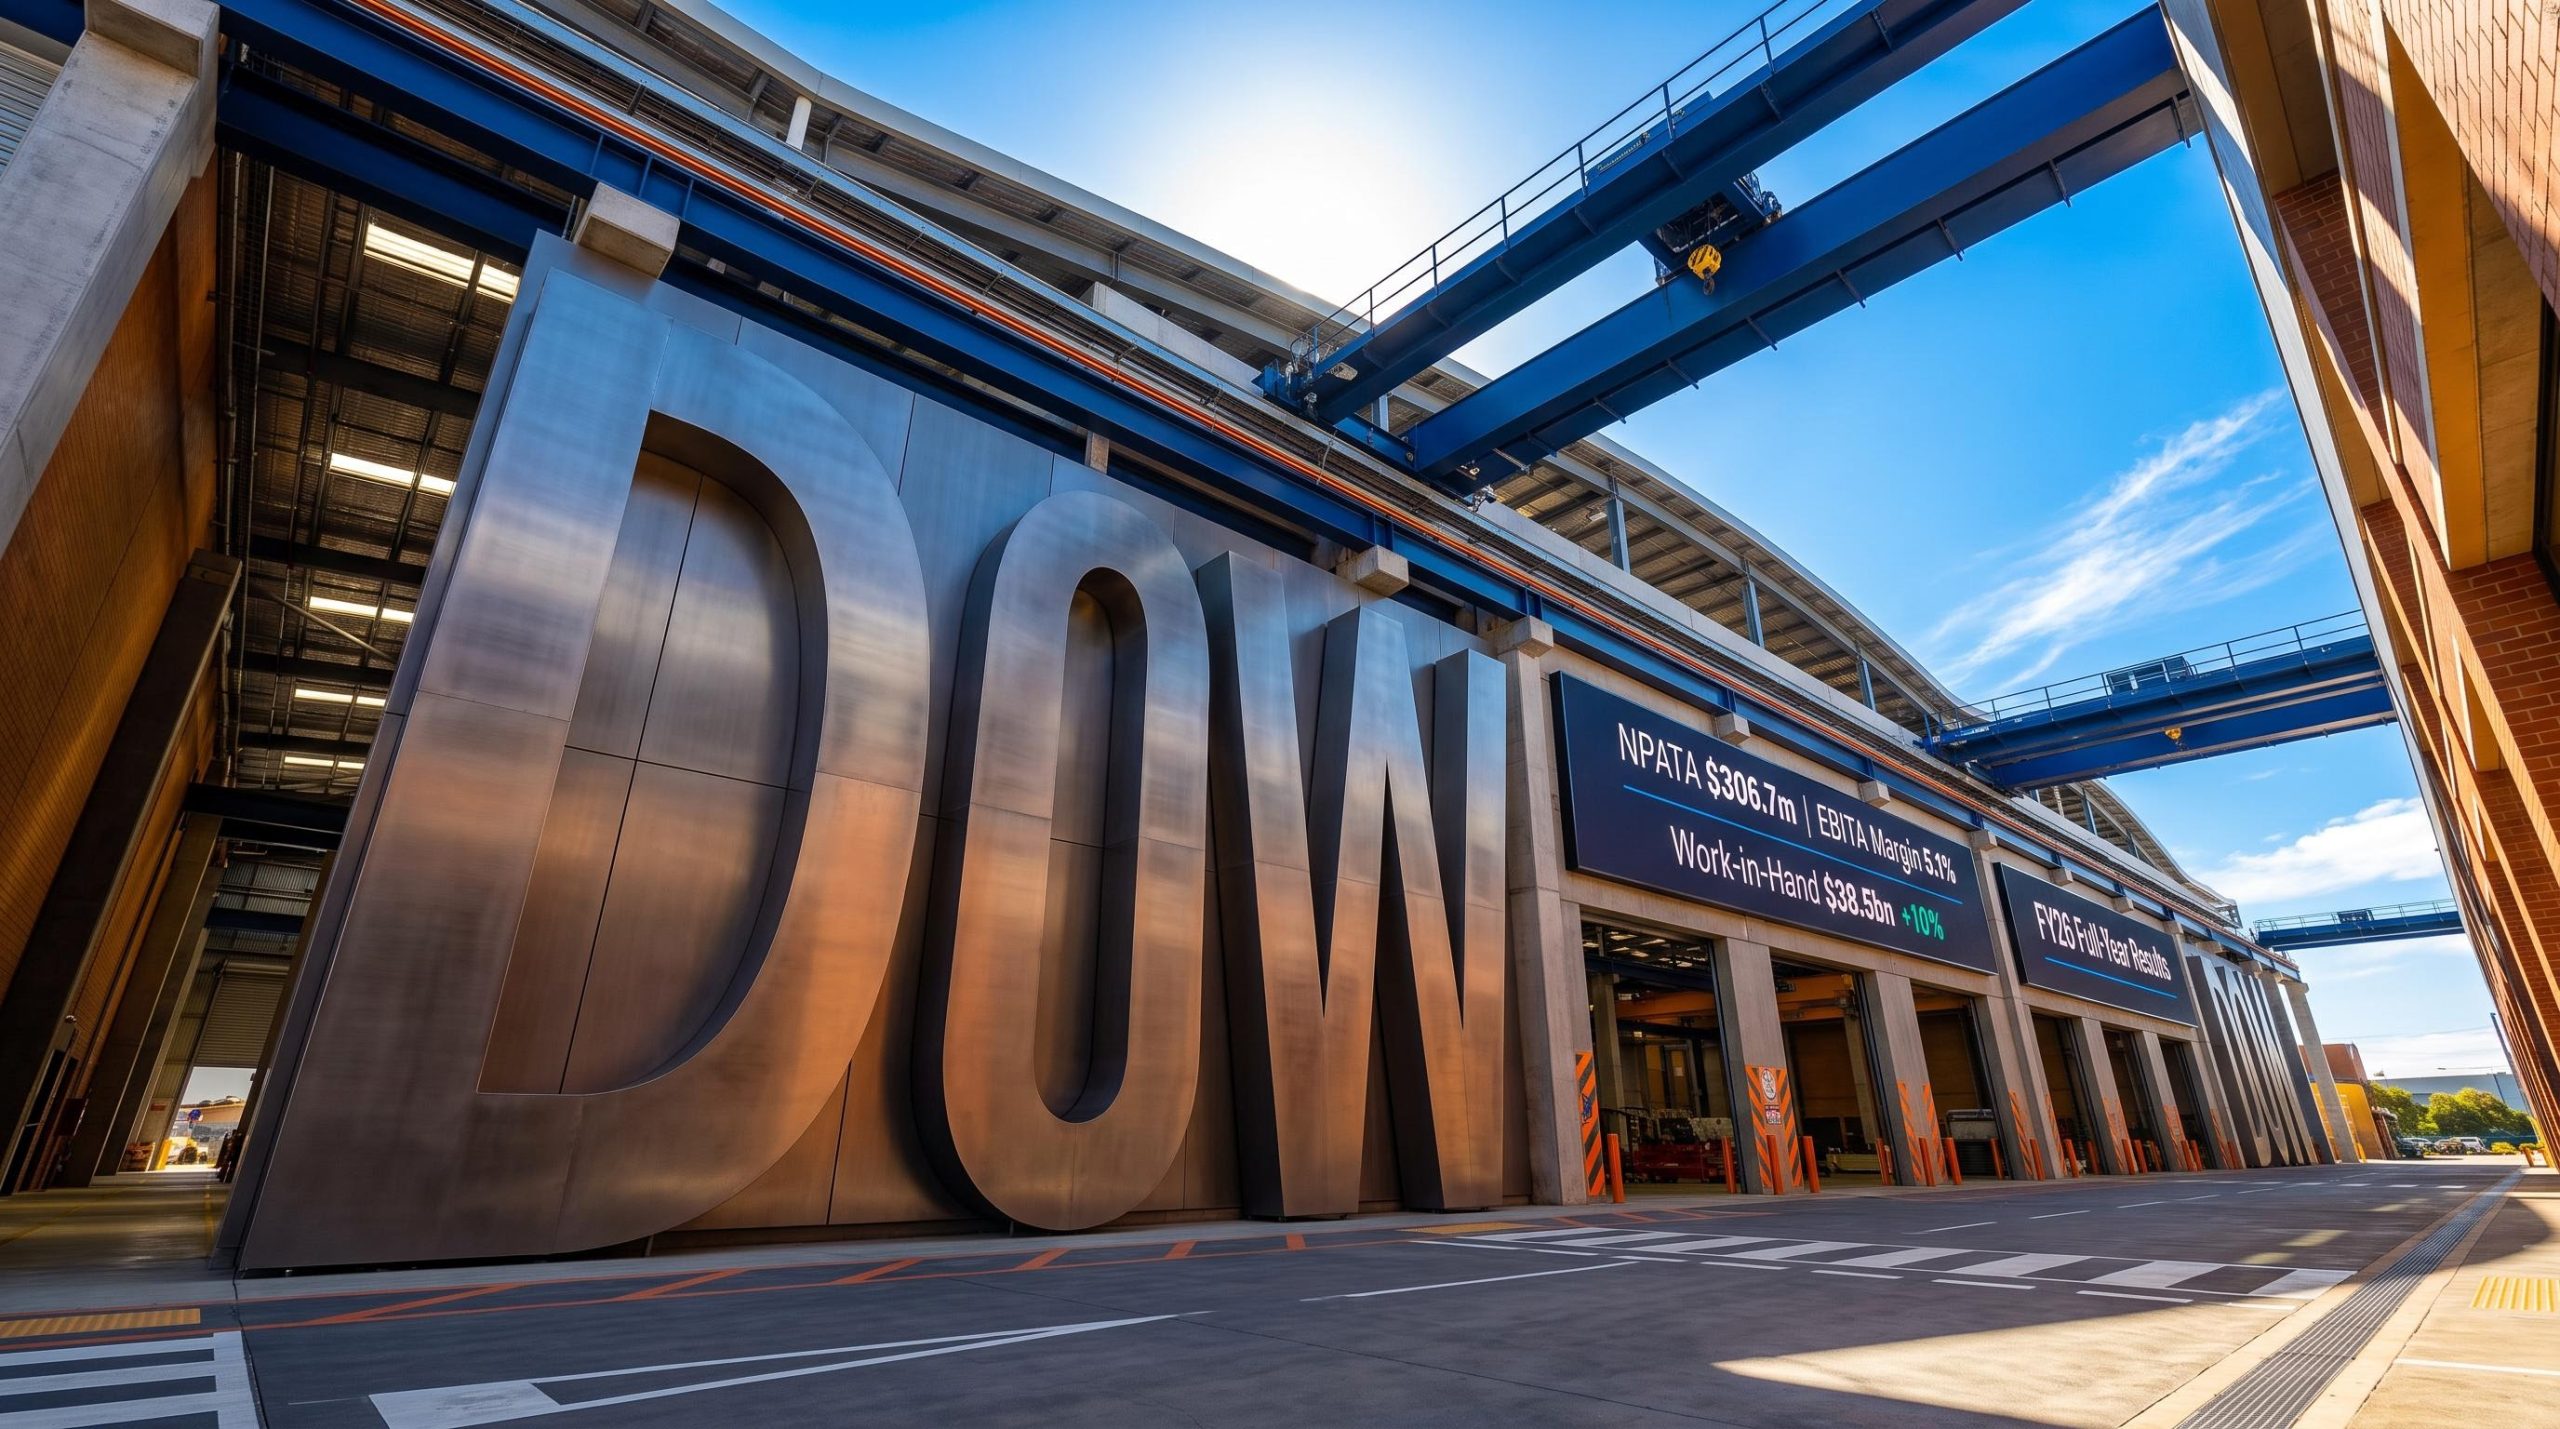
Downer delivers margin-led earnings growth and 17% dividend lift in FY26
In its FY26 full-year results presentation, released on 20 August 2026 for the 12 months ended 30 June 2026, Downer EDI reported statutory net profit after tax (NPAT) of $225.4m, up 51% on the prior year. Management framed the Downer FY26 results around a higher-quality, more resilient and diversified portfolio driving margin expansion.
Underlying earnings before interest, tax and amortisation (EBITA) margin reached 5.1%, while underlying NPATA landed at $306.7m, within the $295m–$315m guidance range. Downer also recorded an average EBITA margin of 4.7% across FY25–FY26, exceeding its >4.5% management target. That target was incorporated into the company’s long-term incentive plan and was not provided as guidance.
When big ASX news breaks, our subscribers know first
FY26 results at a glance
The FY26 scorecard reflected margin-led growth and stronger cash-backed earnings. Key figures reported included:
-
Statutory NPAT: $225.4m (+51% on FY25)
-
Underlying NPATA: $306.7m (+9.8%)
-
Underlying EBITA: $502.9m (+6.1%)
-
Underlying EBITA margin: 5.1% (up 0.7pp)
-
Cash conversion: 91.1% (exceeded the >90% target)
-
Work-in-hand: $38.5bn (+10%)
-
Leverage: 0.8x net debt/EBITDA (improved from 0.9x)
| Metric | FY26 | FY25 | Change |
|---|---|---|---|
| Revenue | $9,873.3m | $10,885.7m | (9.3)% |
| EBITA | $502.9m | $474.2m | +6.1% |
| NPATA | $306.7m | $279.4m | +9.8% |
| EBITA margin | 5.1% | 4.4% | +0.7pp |
| ROFE | 20.6% | 18.1% | +2.5pp |
The revenue decline was deliberate, driven by disciplined revenue quality and completed divestments rather than operational weakness. Management presented the reduction as a shift toward higher-margin, higher-quality work.
Shareholder returns step up
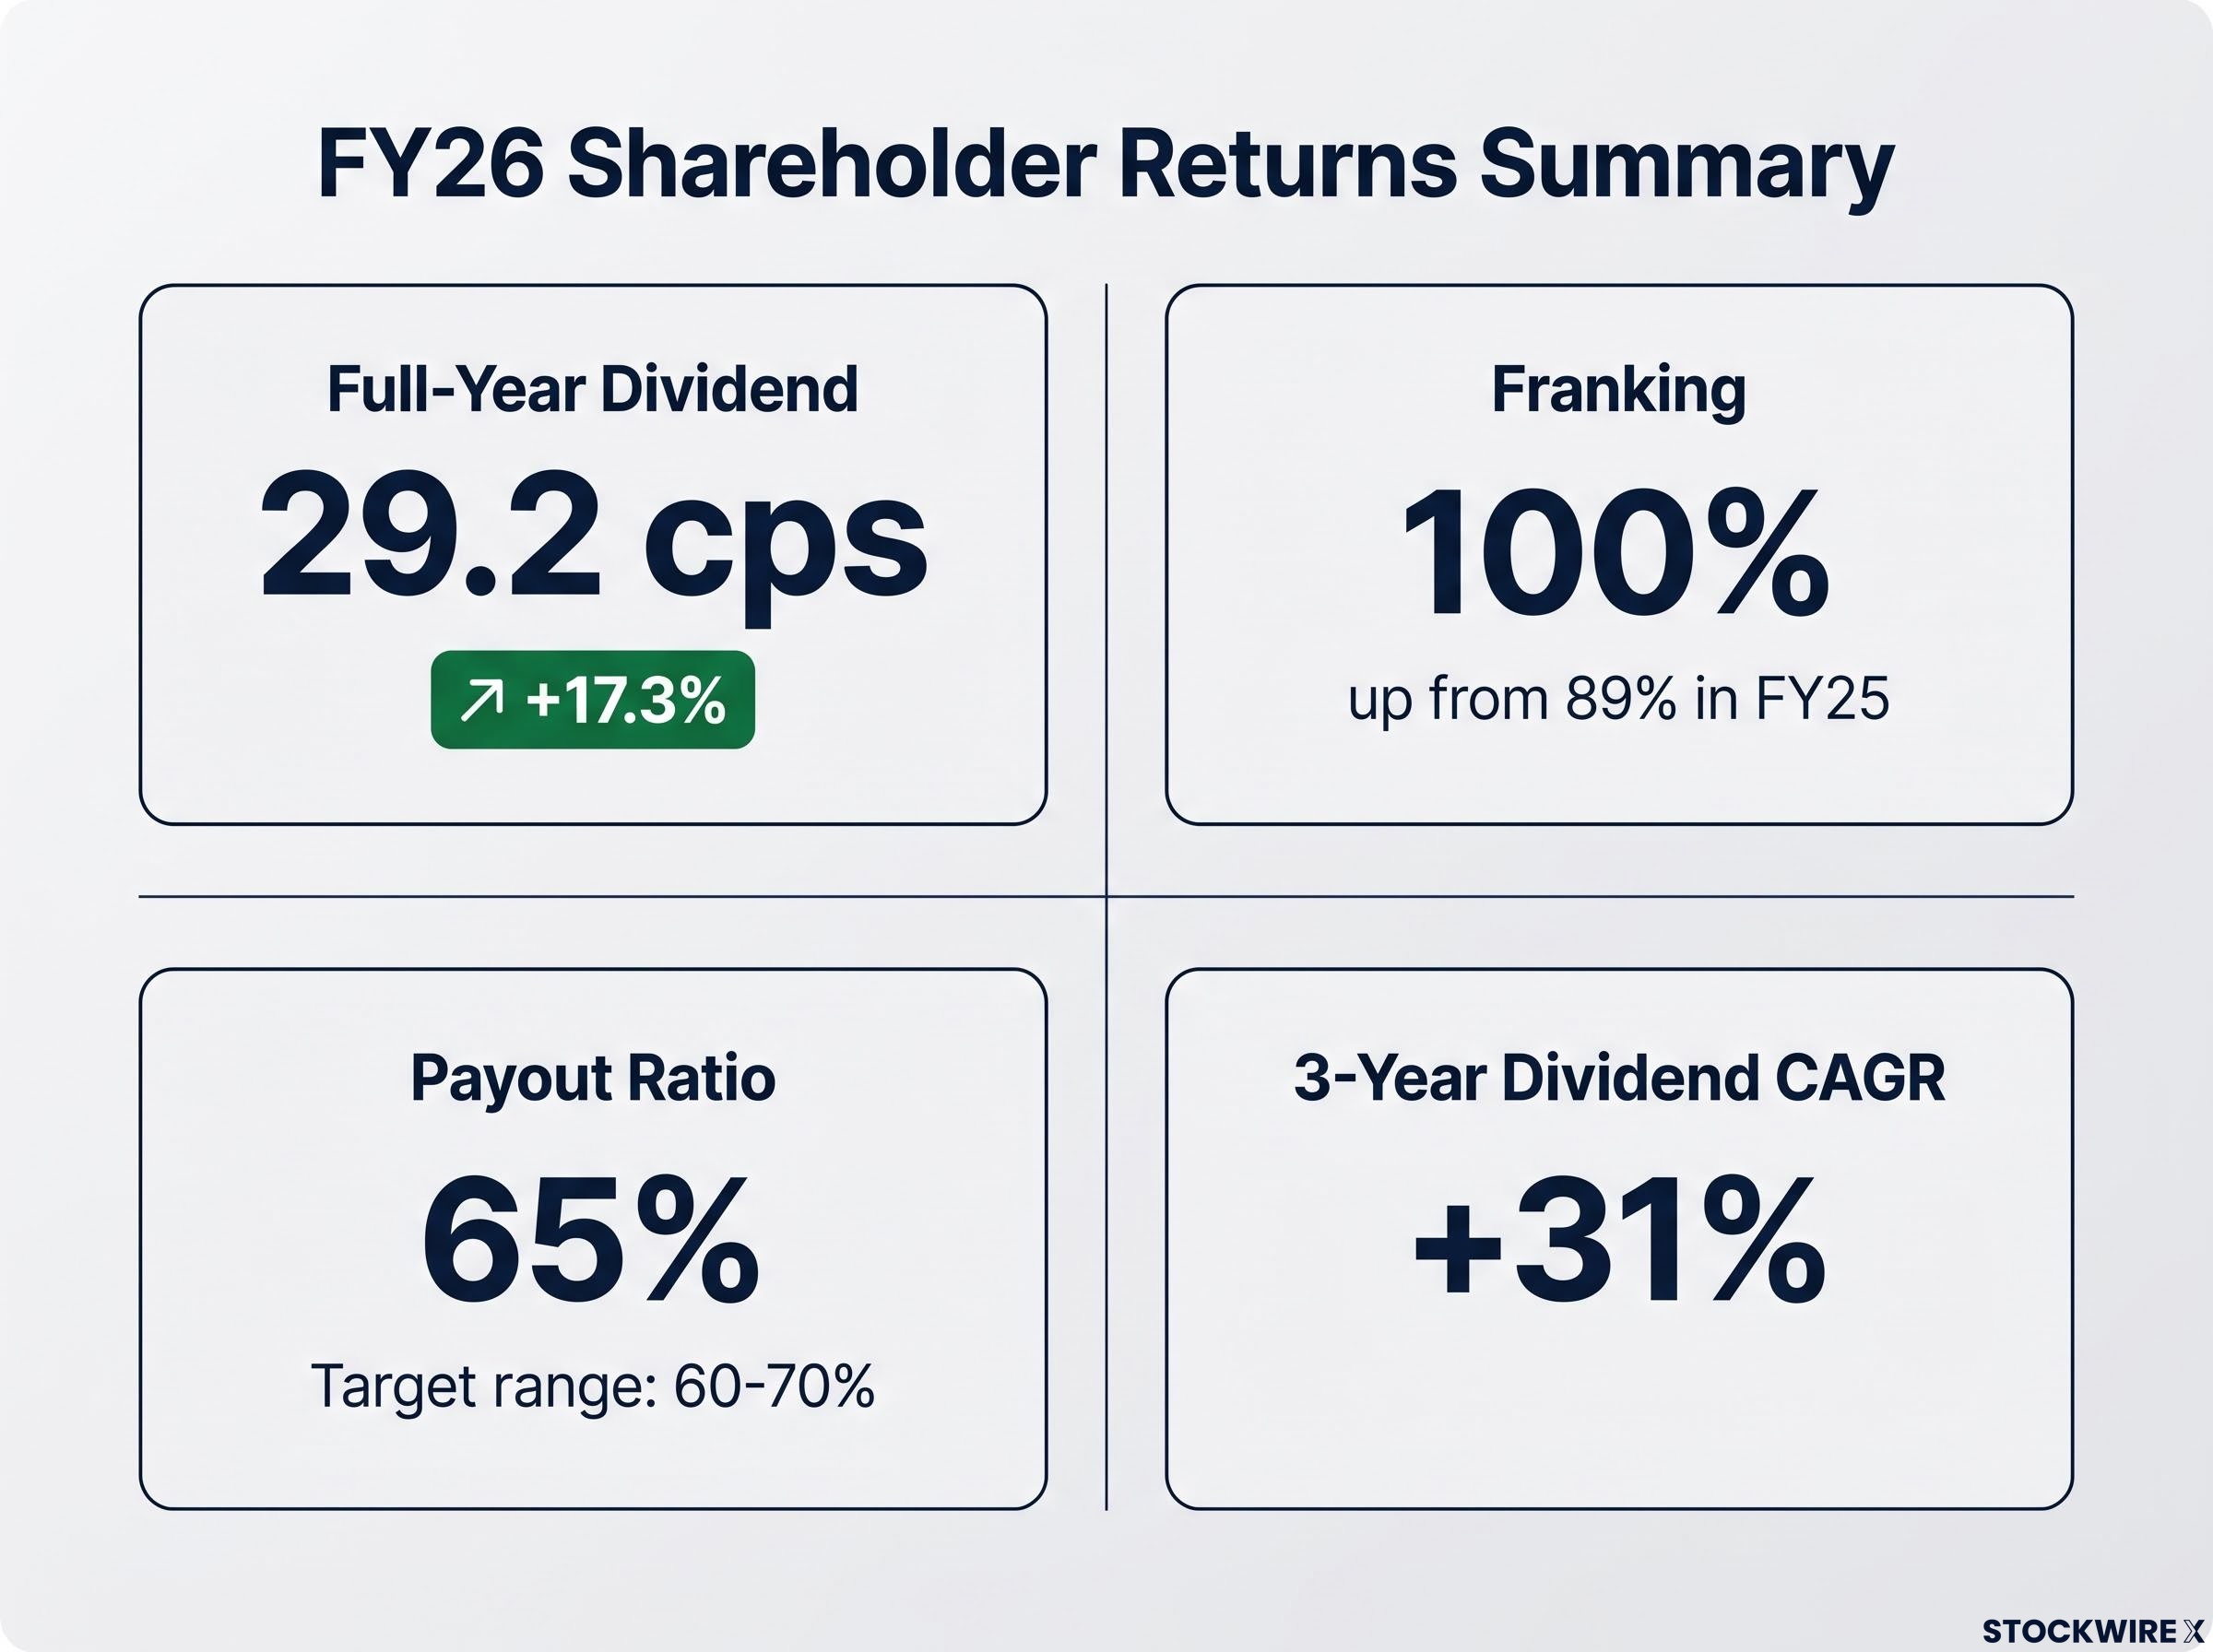
Capital returns featured prominently in the presentation. Downer declared a full-year dividend of 29.2 cps, up 17.3% and 100% franked, an increase from 89% franking in FY25. The payout ratio of 65% sat within the target range of 60–70% of underlying NPATA.
Over three years, the dividend delivered a compound annual growth rate (CAGR) of +31%, while underlying earnings per share (EPS) grew at a +26% three-year CAGR to reach 42.9 cps in FY26.
Management also outlined progress on the share buy-back program, estimated at ~$260m and representing up to 5% of issued capital. Approximately $96.5m was bought back during FY26, with the program set to continue in FY27.
+118% Total Shareholder Return since 1 July 2023
Six times the S&P/ASX 100 (ex-Financials) median TSR of 19%.
Record order book underpins the growth story
Work-in-hand stood at $38.5bn, up 10% on June 2025, driven by $12.2bn of new work secured during FY26. The order book was characterised by quality markers, with approximately 90% government-related and 93% services-based.
Segment growth was led by Facilities at +20%, Energy & Utilities at +12%, and Transport at +1%. Marquee contract wins secured during FY26 (headline value excludes extension options) included:
-
Defence Property & Asset Services — $3.05bn, 6-year term (commenced Feb-26)
-
Water network infrastructure (ANZ) — ~$1.5bn
-
NZTA State highway maintenance — ~NZ$1.5bn (commenced May-26)
-
Stockland Integrated Facilities Management — ~$500m (commenced Aug-26)
-
Chevron WA maintenance — ~$500m, 10-year term
-
Transitional energy / Power projects — ~$450m
How the three segments performed
Energy & Utilities — margin breakout
The segment reported EBITA of $140.9m, up 20% on the prior corresponding period, with margin lifting to 5.7% (up 1.5pp) and work-in-hand of $5.7bn (+11.5%). Revenue of $2.5bn was down 10.9%, reflecting a deliberate mix and quality shift, primarily driven by Telco supplier consolidation and lower outsourced volumes.
Energy and Utilities contract wins announced in August 2026 added more than $900 million across four clients and terms of up to 15 years, with CEO Peter Tompkins flagging further awards expected in coming months as the pipeline extends beyond those four awards.
Transport — steady margin lift
Transport delivered EBITA of $297.0m, up 6.8%, with margin rising to 5.7% (up 0.5pp) and work-in-hand of $17.2bn. Management highlighted continued progress on the Queensland Train Manufacturing Program (QTMP), alongside completion of the Keolis Downer divestment, which generated $68.7m in sale proceeds.
Facilities — order book surges 20%
Facilities work-in-hand climbed 20.2% to $15.6bn. EBITA of $143.5m was down 4.8% and margin eased to 6.8%, reflecting the Defence PAS contract mobilising at lower initial margins in 2H26, with a progressive ramp up to the targeted run rate during 1H27. Management framed this as a timing and investment phase rather than a decline.
What is work-in-hand and why it matters
Work-in-hand refers to the value of contracted future revenue that has not yet been delivered, effectively the company’s order book. It provides forward revenue visibility and supports earnings resilience, particularly when the book is heavily weighted toward government-linked and services-based work.
For Downer, the $38.5bn order book carries embedded escalation mechanisms, with 92% of services work-in-hand including price escalation provisions. These cushion the business against inflation and cost shocks.
That resilience was tested during the period. Bitumen prices rose approximately 50% on 1 April 2026, which the company managed through rise-and-fall provisions and other cost-recovery mechanisms, limiting the earnings impact.
Balance sheet and cash strength
Cash conversion of 91.1% exceeded the company’s >90% target, indicating that earnings were substantially cash-backed. Free cash flow reached $228.6m, while returns to shareholders totalled $285.6m.
Leverage improved to 0.8x, and Downer maintained its Fitch BBB investment-grade rating. Interest coverage strengthened to 10.6x. Individually significant items of $98.7m were approximately 40% lower than FY25, improving the quality of the statutory-to-underlying reconciliation.
The debt refinancing in April 2026 replaced $500 million of maturing Medium Term Notes with a $400 million, seven-year issuance priced at 6.488%, extending the weighted average debt maturity profile to approximately four years at 30 June 2026 and reducing near-term refinancing risk.
Where Downer is heading — FY27 outlook and FY30 ambitions
For FY27, on an underlying basis, management is targeting a return to revenue growth in 2H27, with 1H27 revenue, earnings and margin lower than the prior corresponding period. The skew reflects the anticipated timing of key contract awards and QTMP transitioning from facility construction to rollingstock manufacturing.
Looking further out, Downer outlined several FY30 management ambitions, each presented as ambition rather than guidance:
-
Group revenue CAGR of 4–5% across FY26–FY30
-
Group EBITA margin towards 6%
-
>90% average cash conversion
Management pointed to structural tailwinds supporting these ambitions, including the energy transition, data centres (with a projected ~$150bn in Australian spend over five years to 2030 and an $11.8bn Downer pipeline), Defence spending rising towards 3% of GDP by 2033, water investment, and rail rollingstock renewal. The company estimated an addressable market of approximately $127bn across its three segments for the financial year ending 30 June 2027.
Taken together, the presentation reinforced a consistent through-line: margin-led growth, a record order book, and disciplined capital returns position Downer to pursue its medium-term ambitions.
Stay Ahead on ASX Industrials News
Get breaking ASX announcements delivered to your inbox within minutes, complete with in-depth analysis already done. Join 20,000+ subscribers receiving FREE real-time alerts the moment market-moving news breaks. Click the “Free Alerts” button at StockWire X to stay ahead before the market moves.