

OFX 1H27 results presentation: profit squeezed, but cost actions and multi-product traction signal a turn
In its 1H27 results presentation, OFX Group outlined Net Operating Income of $89.2m, down 15.0% v PCP, and Underlying EBITDA of $4.0m, down 72.4% v PCP, against a soft macro backdrop.
Management paired the headline with positive revenue growth QoQ of +3.2% in 1Q27 and +2.1% in 2Q27, and $15m of annualised cost actions executed in 1H27. The strategic review continues, with discussions continuing with Equals on a non-exclusive basis.
Key metrics from the presentation include:
- NOI margin of 64bps
- Net Available Cash of $36.6m
- ARPC of $4.0k
- Non-FX revenue of $1.8m
- Wallet balances of $294.7m
When big ASX news breaks, our subscribers know first
Financial results: lower volumes weigh, costs begin to fall
Half-year scorecard
The presentation set out the half-year results against the prior two periods. Fee and trading income fell 15.5% v PCP, which management attributed to subdued business confidence driving lower cross-currency activity and lower margins, partly offset by growth in Non-FX revenue.
| Metric ($m) | 1H26 | 2H26 | 1H27 | V 1H26% |
|---|---|---|---|---|
| Fee and trading income | 109.1 | 94.8 | 92.2 | (15.5)% |
| Net Operating Income | 105.0 | 91.6 | 89.2 | (15.0)% |
| Underlying operating expenses | 90.5 | 81.0 | 85.2 | (5.9)% |
| Underlying EBITDA | 14.5 | 10.7 | 4.0 | (72.4)% |
| Underlying NPAT | 2.9 | (0.6) | (3.3) | (214.5)% |
| Statutory NPAT | 2.4 | (2.9) | (6.7) | (381.7)% |
Underlying opex fell 5.9% v PCP on lower employment costs and incentives.
The FY26 results set the baseline for this half, with bad and doubtful debts tripling to $6.3m on a handful of North American Corporate incidents and underlying EBITDA falling 56.4% for the full year.
What drove the EBITDA move
The walk from $14.5m to $4.0m in Underlying EBITDA v PCP included:
- Volumes: $(8.6)m
- Margins: $(6.8)m
- Non-FX: +$1.2m
- Interest: +$1.7m
- Lower employment related: +$4.8m
- Treasury revenue: $(2.6)m
Cross-currency turnover was down 9.0%. On the macro side, business confidence rose 8pts to -11 in Sep-26 but remained 15pts below the long-run average, and volatility totalled 26 days in 1H27 against 46 days in FY26.
Interest income rose 49.4% v PCP, supported by growing wallet balances and a higher interest rate environment.
Cash and balance sheet
Net Cash Held was $63.3m, down 16.0% v PCP. Net Available Cash of $36.6m includes a $4.7m increase in restricted cash balances, which management described as mainly timing related.
Operating cashflows were $3.0m, while one-off items of $3.4m represent Firma and Paytron integration and migration, 2.0 transformation and strategic review costs. The presentation stated the investment phase peaked in 1H27, with FY27 capex expected to be $17-$19m.
Multi-product strategy: the proof points
Multi-product FX clients are clients using FX plus a Non-FX product that includes Subscriptions, Pay by Card or Cards. Retention and ARPC (average revenue per Active Client, excluding interest income) matter for a transaction-driven business because revenue depends on clients transacting repeatedly.
Multi-product FX clients deliver about 2x the quarterly ARPC of FX only clients (about $2.2k v about $1.2k). They are also about 3x less likely to lapse in the following quarter, at 5.5% v 17.8% in 2Q27.
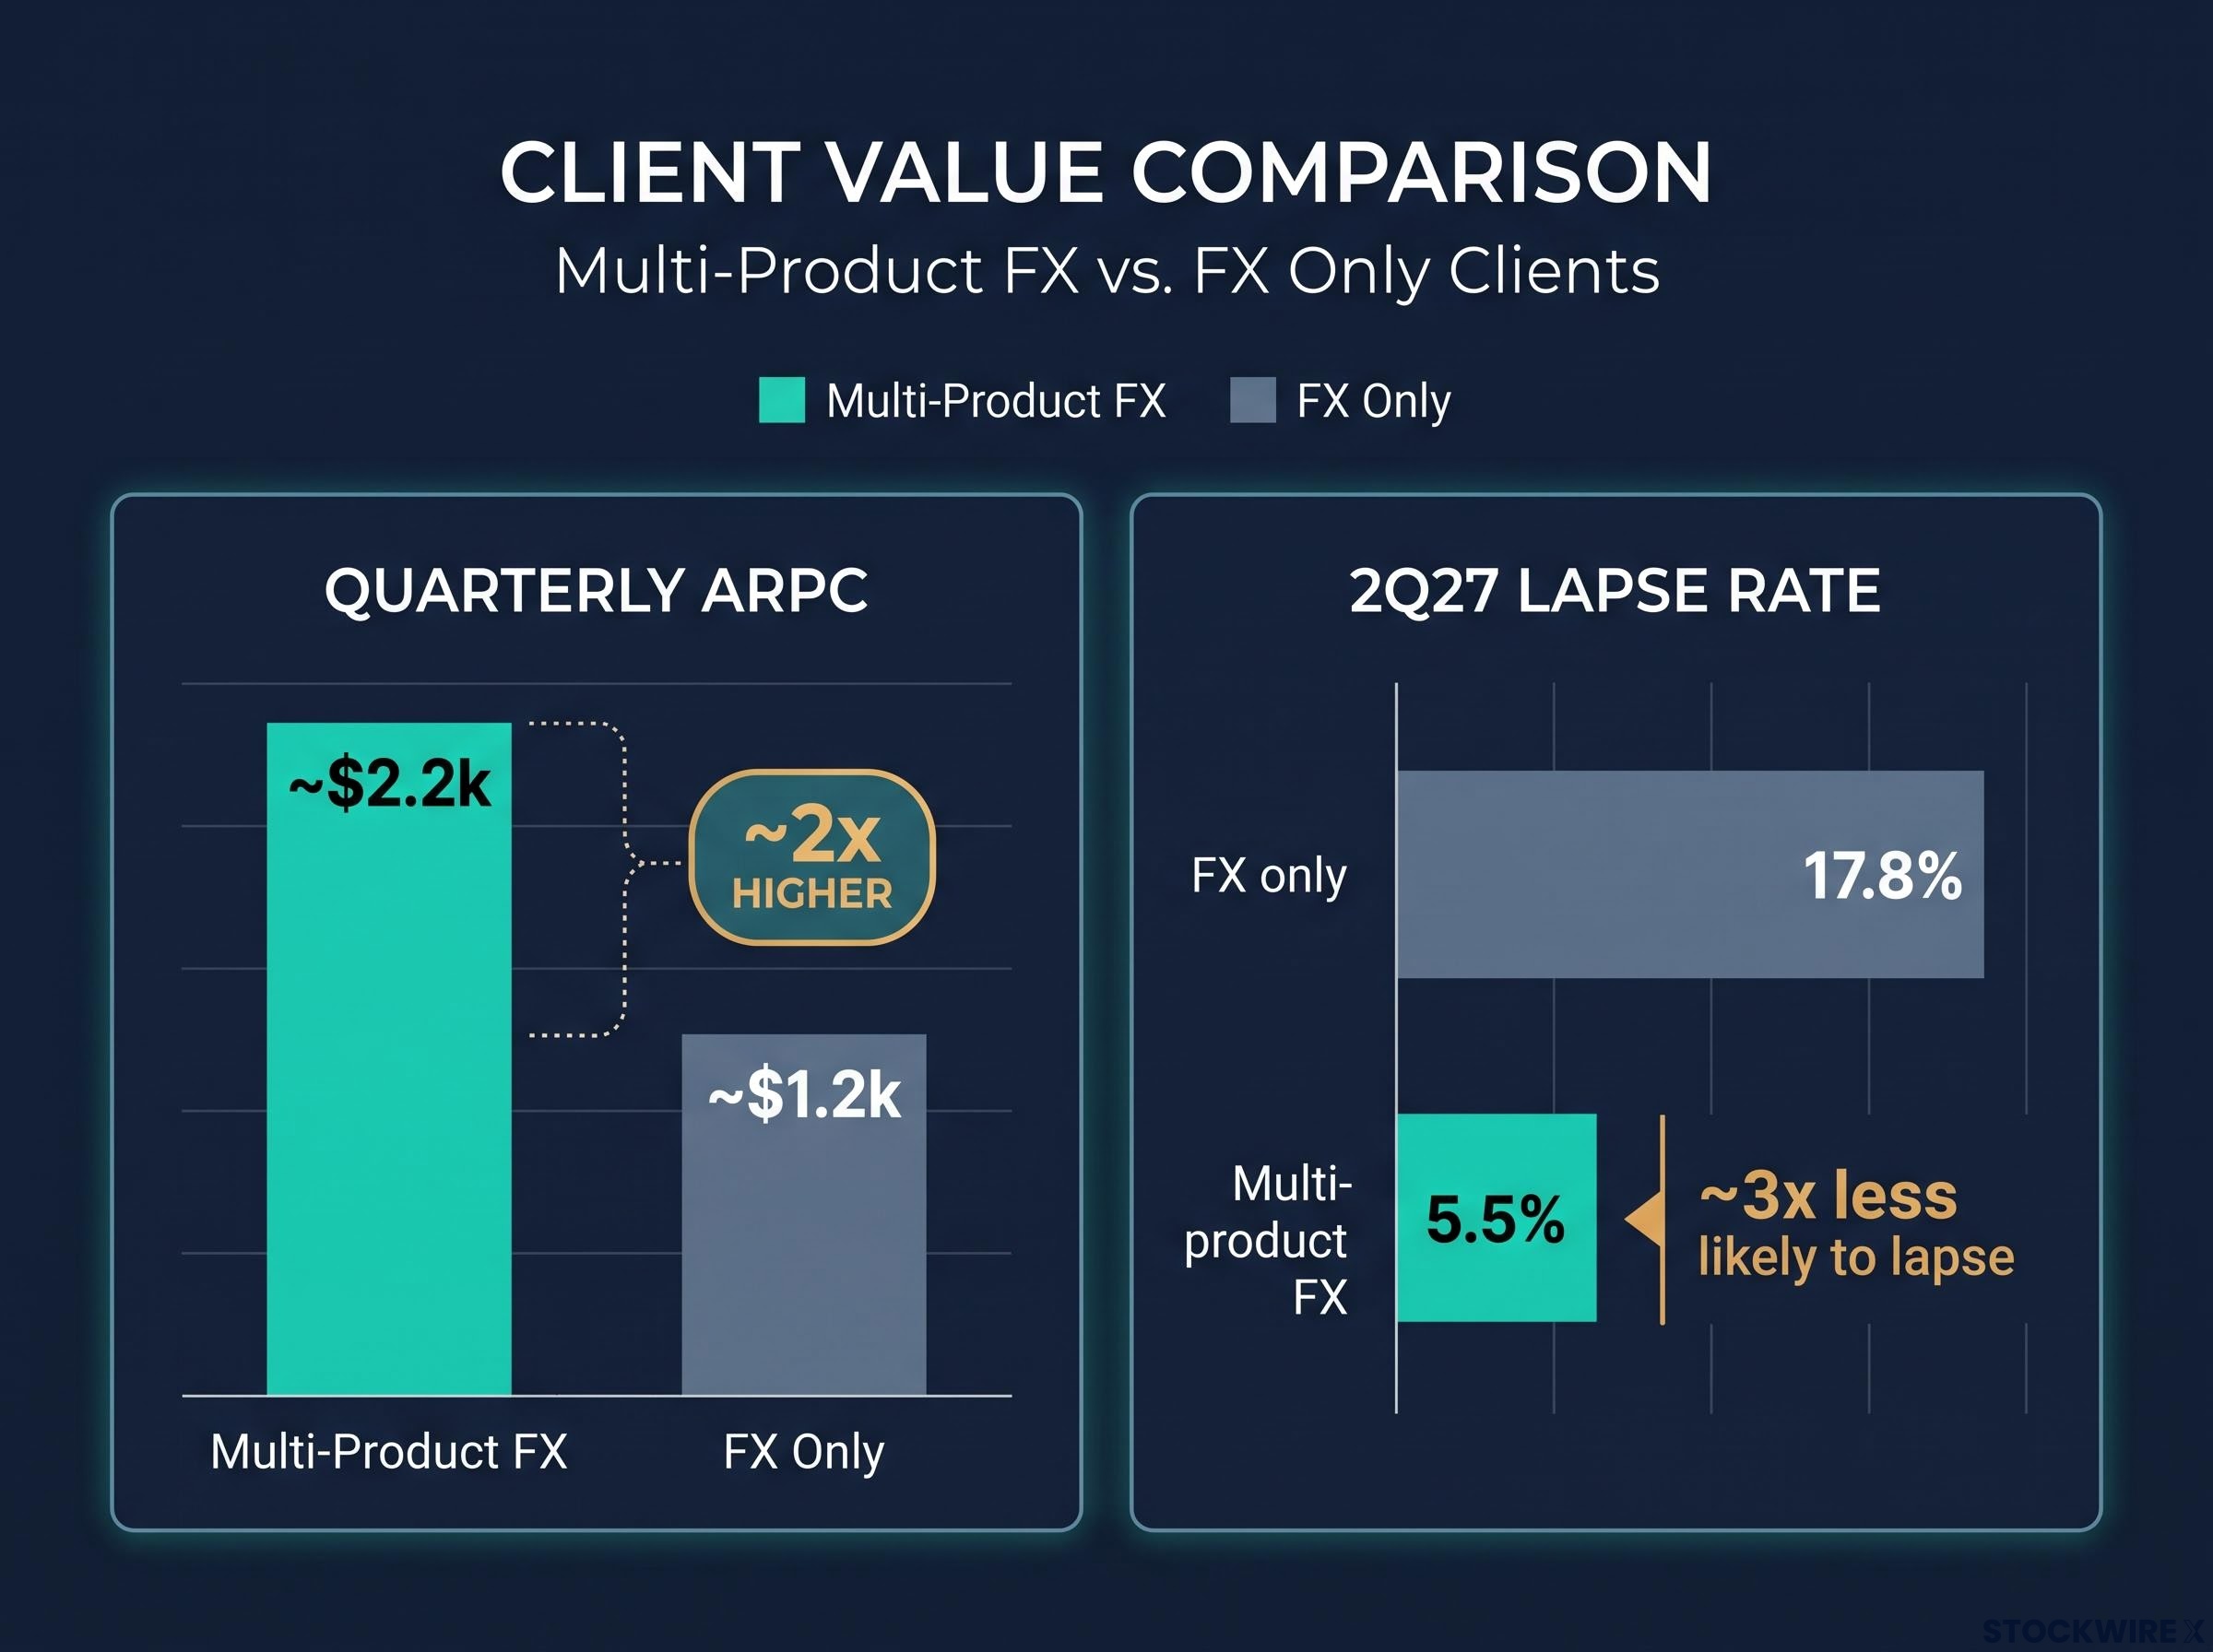
Adoption is growing: 11.7% of LTM Active Clients on NCP use more than 1 Non-FX product, up 3.3ppts v 2H26.
OFX’s platform migration progress through early 2026 laid the groundwork for these adoption gains, with 91% of Corporate clients in major markets on the New Client Platform by 31 March and more than 55 new features added in a single quarter.
Non-FX revenue reached $1.0m in 2Q27, annualising to $4.1m, with interest on wallet balances of about $1.6m, annualising to about $6.4m.
| Non-FX revenue, 2Q27 | $k |
|---|---|
| Card | 479 |
| Pay by Card | 269 |
| Subscription | 272 |
Growth indicators versus 2H26 include:
- Total cards issued: 9.6k (+58.5%)
- Clients with paid subscriptions: 964 (+15.9%)
- Clients with interest bearing wallet balances: 12.6k (+22.0%)
The presentation also showed LTM corporate Active Clients down to 27.9k, a 6.9% fall v 2H26. The Firma and OLS portfolio, which is no longer being originated, fell to 7.6k, while the OFX portfolio was relatively stable at 20.3k.
What happens next for OFX
Management outlined the following expectations:
- 2H27: cost actions executed late in 2Q27 are expected to deliver about $10m lower opex, annualising to about $15m through FY28.
- 2H27: NOI growth of 2-3%, assuming current macro conditions.
- FY27: operating expenses of $159m – $162m, assuming bad debts moderate in 2H27 and no one off large bad debts or unusual events.
- FY27: capex of $17-$19m, with 2H27E Net Cash Held expected to improve.
- FY28: NOI growth of 3-5%, assuming similar macro conditions to FY27, with operating expenses broadly flat.
- Strategic review: discussions continue with Equals on a non-exclusive basis.
Management’s thesis is that FY27 returns to positive operating leverage, with FY28 continuing it.
Get Fintech News Before the Market Moves
Get FREE breaking ASX news from the financials and fintech space delivered within minutes of release, complete with in-depth analysis. Join 20,000+ investors already using Big News Blast to stay ahead of the market. Click the “Free Alerts” button to start receiving alerts the moment news breaks.