
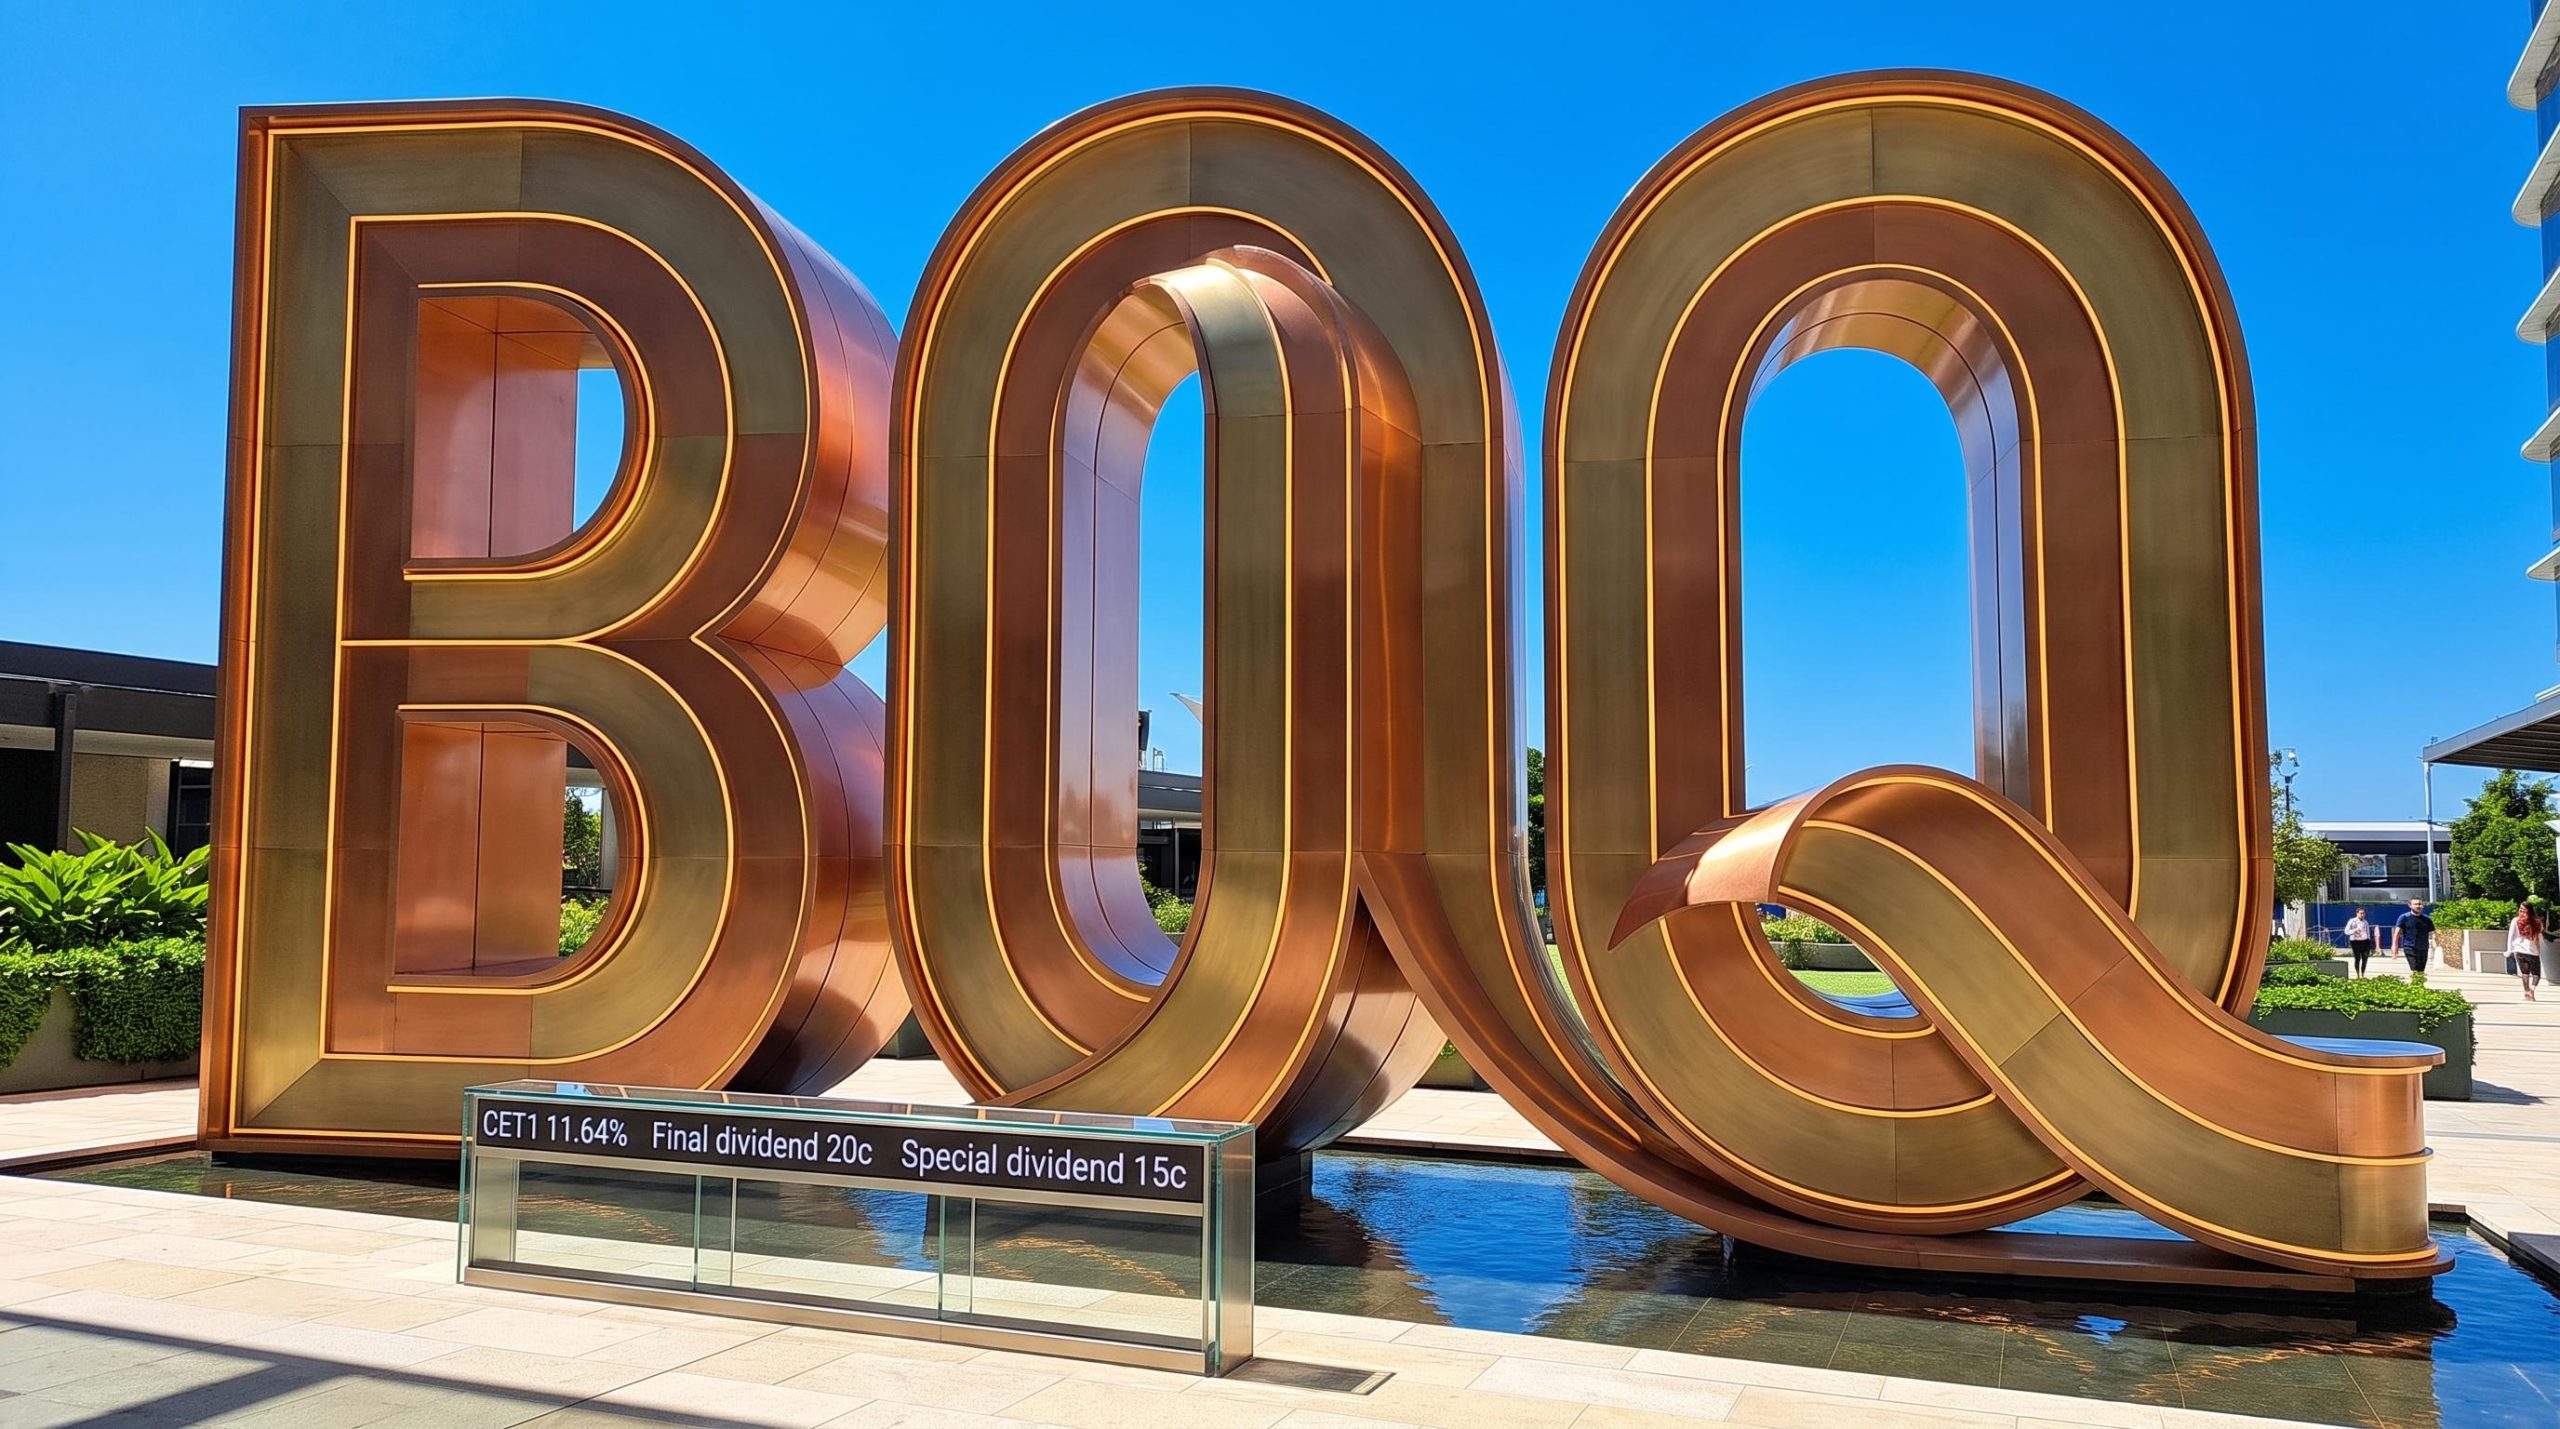
FY26 results: $358m cash earnings and a stronger capital position outlined
In its FY26 results presentation for the year ended 31 August 2026, BOQ Group outlined cash earnings after tax excluding notable items of $358m, down 7% on FY25 ($383m). Cash earnings after tax was $325m (down 15%), while statutory net profit after tax was $250m (up 88%).
Management pointed to balance sheet gains alongside the earnings decline. Net interest margin (NIM) was 1.70%, up 6bps from 1.64%, and the CET1 ratio reached 11.64%, up 70bps from 10.94%.
On dividends, the presentation detailed a 20c fully franked final dividend and a 15c special dividend. Total FY26 dividends were 55c, comprising the 20c interim, 15c special and 20c final dividends. The 40.0c dividends per ordinary share in the results table is a separate line in the source, and the presentation does not reconcile it to the 55c total.
Earnings softened, but management positioned the capital base as supporting returns while the transformation is completed.
Key FY26 metrics
| Metric | FY26 | FY25 | Change |
|---|---|---|---|
| Cash earnings after tax excl. notable items | $358m | $383m | (7%) |
| Net interest margin | 1.70% | 1.64% | 6bps |
| CET1 ratio | 11.64% | 10.94% | 70bps |
| Total income | $1,679m | $1,657m | 1% |
| Loan impairment expense | $54m | $21m | 157% |
Notable items totalled $47m pre-tax ($33m after tax). They covered:
- Impairment charges related to aged technology assets
- Impairment charges related to low value corporate and branch network assets
When big ASX news breaks, our subscribers know first
Second-half momentum and the Challenger capital partnership
Half-on-half improvement
Second-half cash earnings after tax excluding notable items were $182m, compared with $176m in 1H26, an increase of 3%. Underlying profit excluding notable items rose 8% to $302m from $279m, while total income was $847m versus $832m.
The presentation showed NIM at 1.73% in 2H26, against 1.67% in 1H26, with funding contributions from at-call deposits (+6bps) and term deposits (+4bps). Loan impairment expense was $34m in 2H26 versus $20m in 1H26, and $54m for the full year versus $21m in FY25. Management described impairment expense as normalising off a low base, at 8bps of gross loans and advances.
Challenger whole-of-loan sale
The presentation detailed a ~$3.6bn equipment finance whole-of-loan sale to Challenger Limited, completed on 1 May 2026. BOQ retains origination, servicing and customer relationships under a forward flow arrangement, which returned at target in the first four months.
The Challenger capital partnership was first announced in April as a way to convert a capital-intensive equipment finance book into a fee-generating, capital-light model, with an initial 12-month forward flow term that can be extended by mutual agreement.
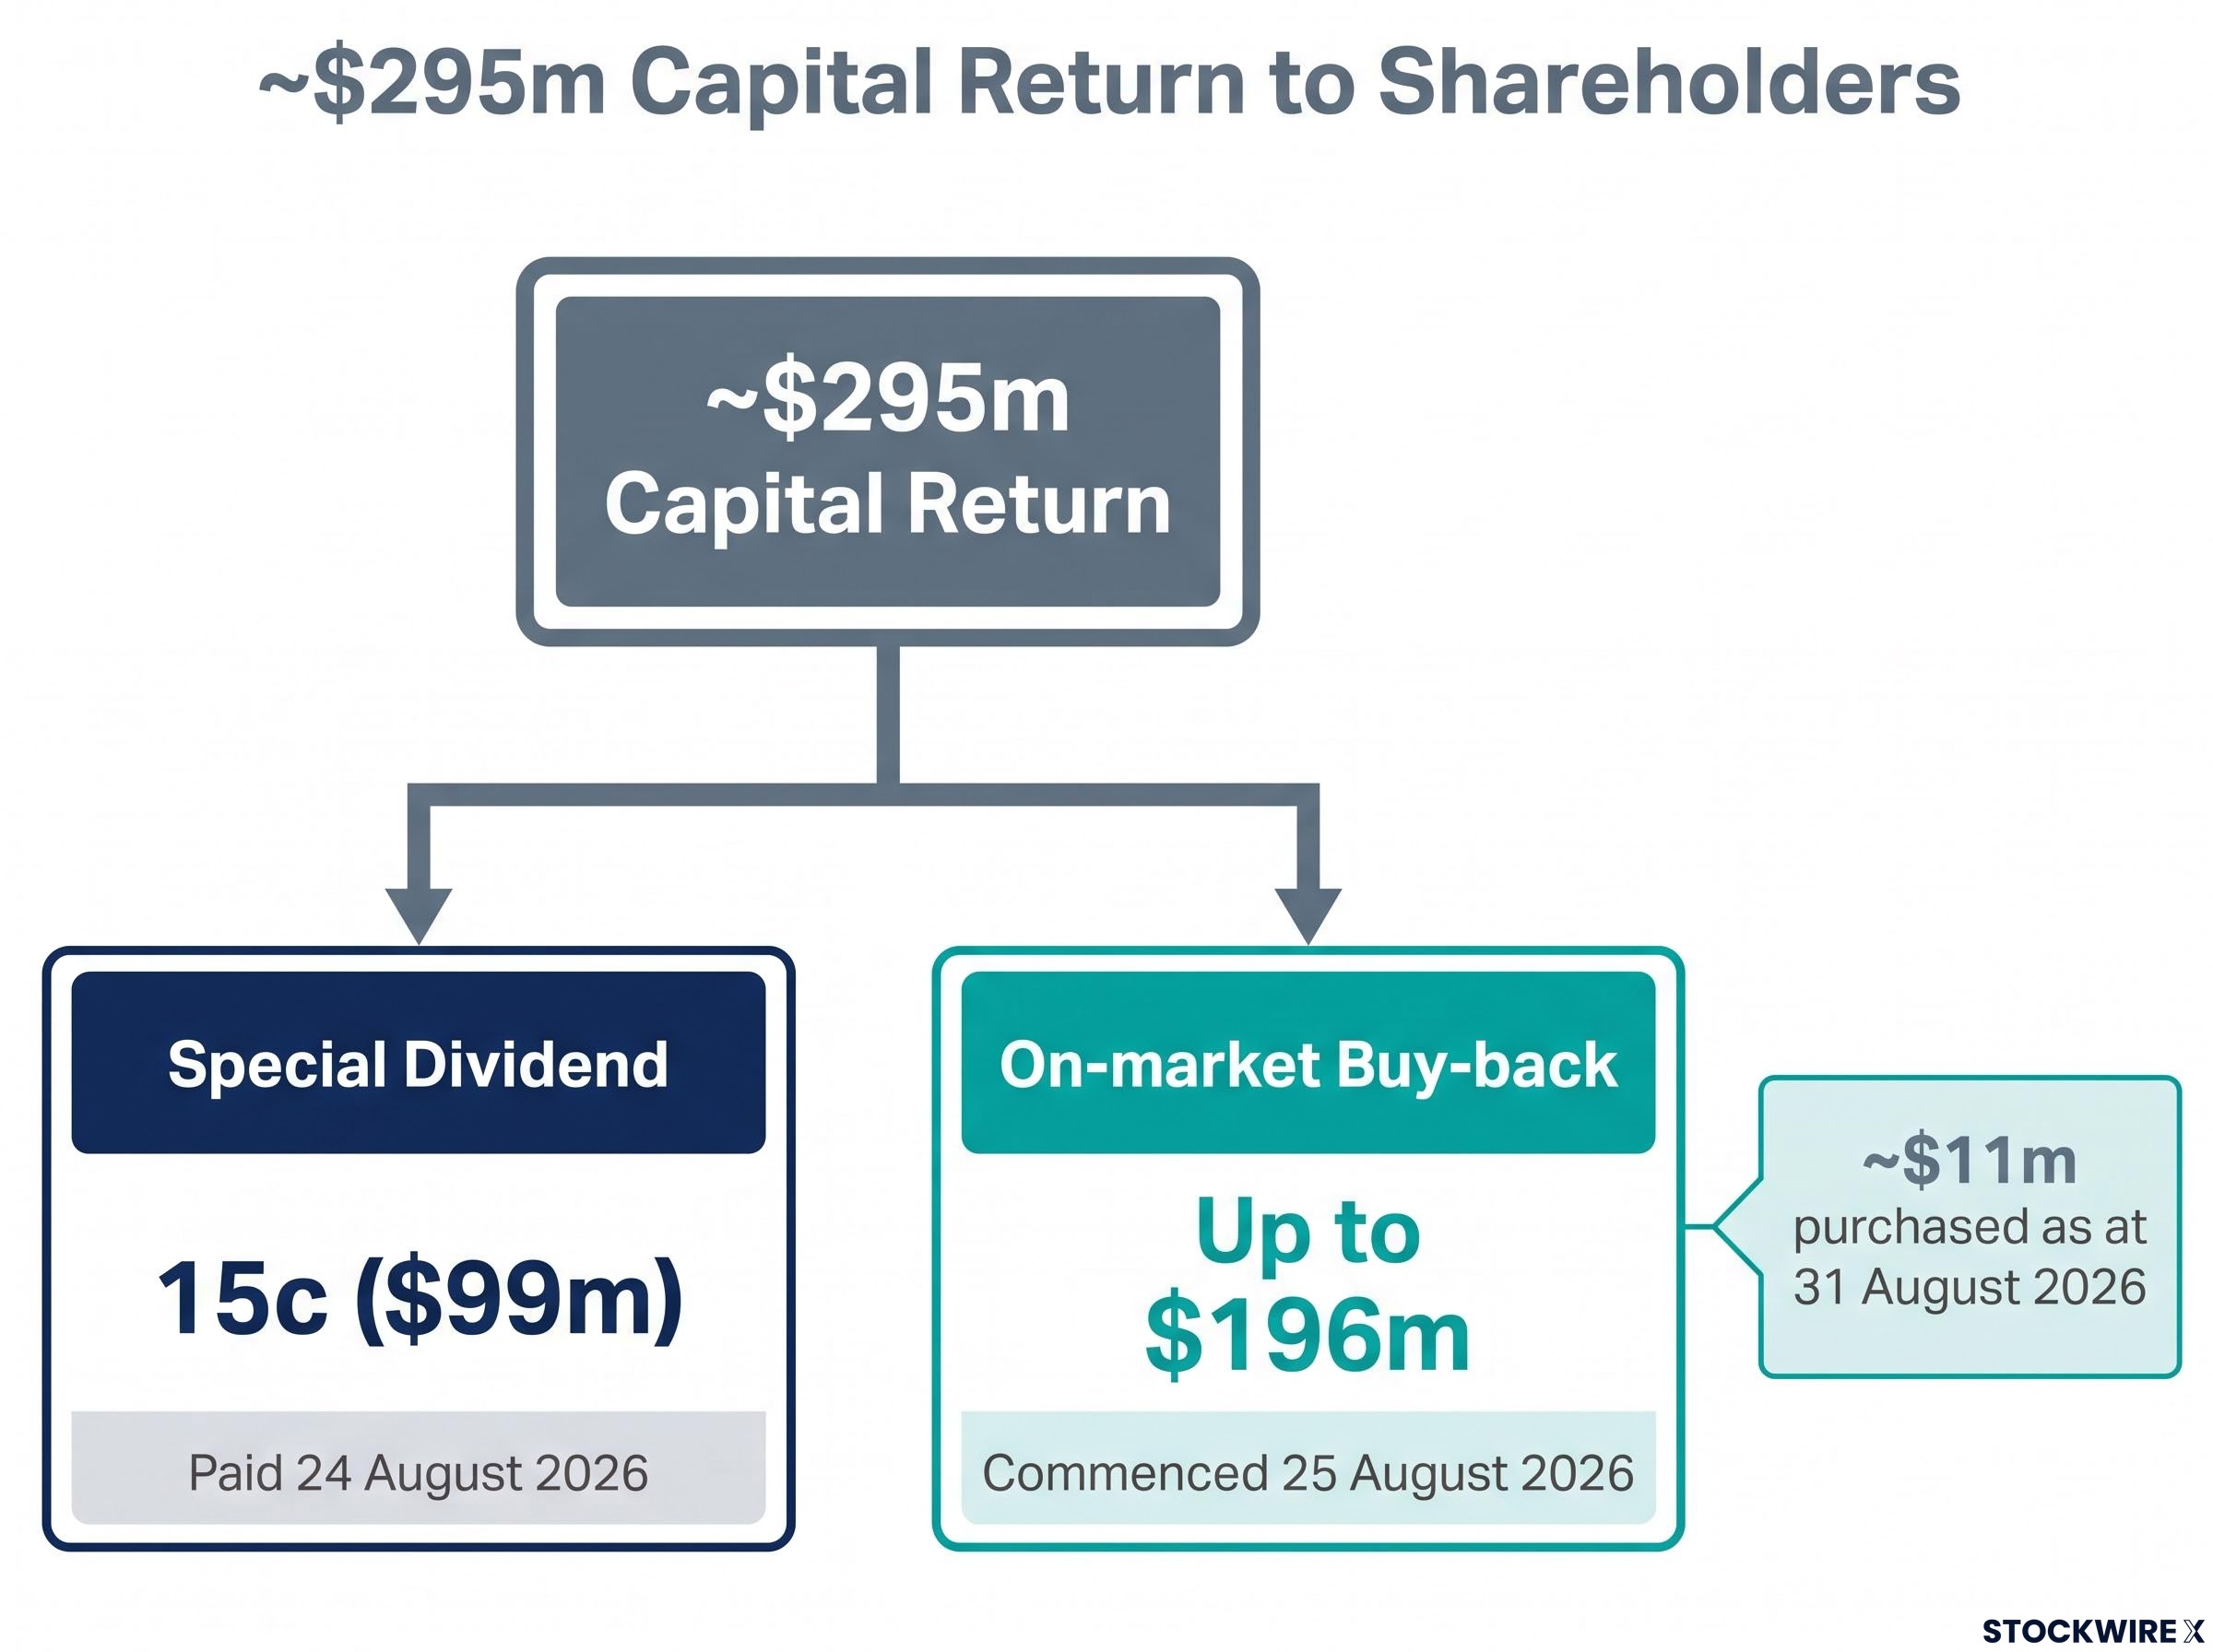
A ~$295m capital return to shareholders was tied to the transaction, in two parts:
- Special dividend: 15c ($99m), paid 24 August 2026
- On-market buy-back: up to $196m, commenced 25 August 2026, with ~$11m purchased as at 31 August 2026
FY26 outcomes against the guidance ranges from the 1H26 investor materials were as follows.
| Item | FY26 range | FY26 actuals |
|---|---|---|
| Net interest income | -$16m to -$12m | -$14m |
| Non-interest income | +$8m to +$10m | +$14m |
| Cash earnings after tax | -$2m to +$4m | +$3m |
Management said the capital management plan is benefiting ROE and EPS in FY27, with those expectations remaining subject to market conditions relating to the planned buy-back.
How the simple, specialist bank strategy is being executed
Transformation milestones
Management highlighted completion of the ME migration, covering ~350,000 customers, ~$29bn of home lending and ~$6.9bn of deposits. Core banking platforms fell from 8 in FY23 to 4. 68% of retail customers are on the digital bank, and 88% of August 2026 home lending applications were processed on the digital platform.
The strategy is organised around four pillars:
- Grow our customer relationships
- Optimise the bank economics
- Rewire the bank for the future
- Accelerate the culture shift
Business bank and deposits
Commercial lending grew 16% to $15.24bn, with 42 bankers onboarded since FY24 contributing 44% of FY26 commercial lending growth. Headline business lending was $18,950m, down from $20,187m, and the presentation shows growth of 14% on a normalised basis, excluding the equipment finance sale.
Home lending fell 8% to $52,868m and customer deposits fell 6% to $62,904m. The presentation attributed deposit movements to optimisation for a lower funding requirement, including term deposit run-off, and targets a sustainable return to home lending growth in FY27.
Cost discipline
Operating expenses excluding notable items rose 2% to $1,098m, while underlying costs fell 1.6%. The $250m productivity program was 82% delivered on exit of FY26.
Transformation investment peaked at $326m in FY23 and was $180m in FY26.
What is an NIM and CET1 ratio? A beginner’s guide
Net interest margin is the gap between what a bank earns on its loans and what it pays to fund them. A 6bps lift, as in FY26, means the bank kept slightly more of each dollar of lending.
The CET1 ratio measures a bank’s core capital against its risk-weighted assets. BOQ’s management target range is 10.25-10.75%, against 11.64% at year end. The presentation shows a pro-forma ratio of 11.14% after the planned buy-back, and notes CET1 includes a $50m capital overlay determined by APRA in relation to BOQ’s Court Enforceable Undertaking.
FY27 outlook and what to watch
Management’s stated FY27 outlook includes:
- Targeting commercial lending growth comparable to FY26
- A sustainable return to home lending growth
- Targeting flat cost growth
- A modest 1H27 NIM uplift, subject to market conditions
- A strong uplift in non-interest income expected
- Relatively stable loan impairment expense
The share buy-back is expected to be completed during FY27, subject to market conditions. There is no change to the CET1 target range or the dividend payout range of 60-75% of cash earnings.
On risk, S&P rates BOQ A- with a Negative outlook. The collective provision scenarios carry a 45% weighting to downside scenarios, and reported provisions of $274m sit $74m above the base scenario.
The presentation framed capital strength and execution of the simplification program as the central themes heading into FY27.
Get Financial Sector News Before the Market Moves
Join 20,000+ investors receiving FREE breaking ASX news within minutes of release, with in-depth analysis already done. Click the “Free Alerts” button at Big News Blast to get the next big banking and finance announcement in your inbox the moment it breaks.