
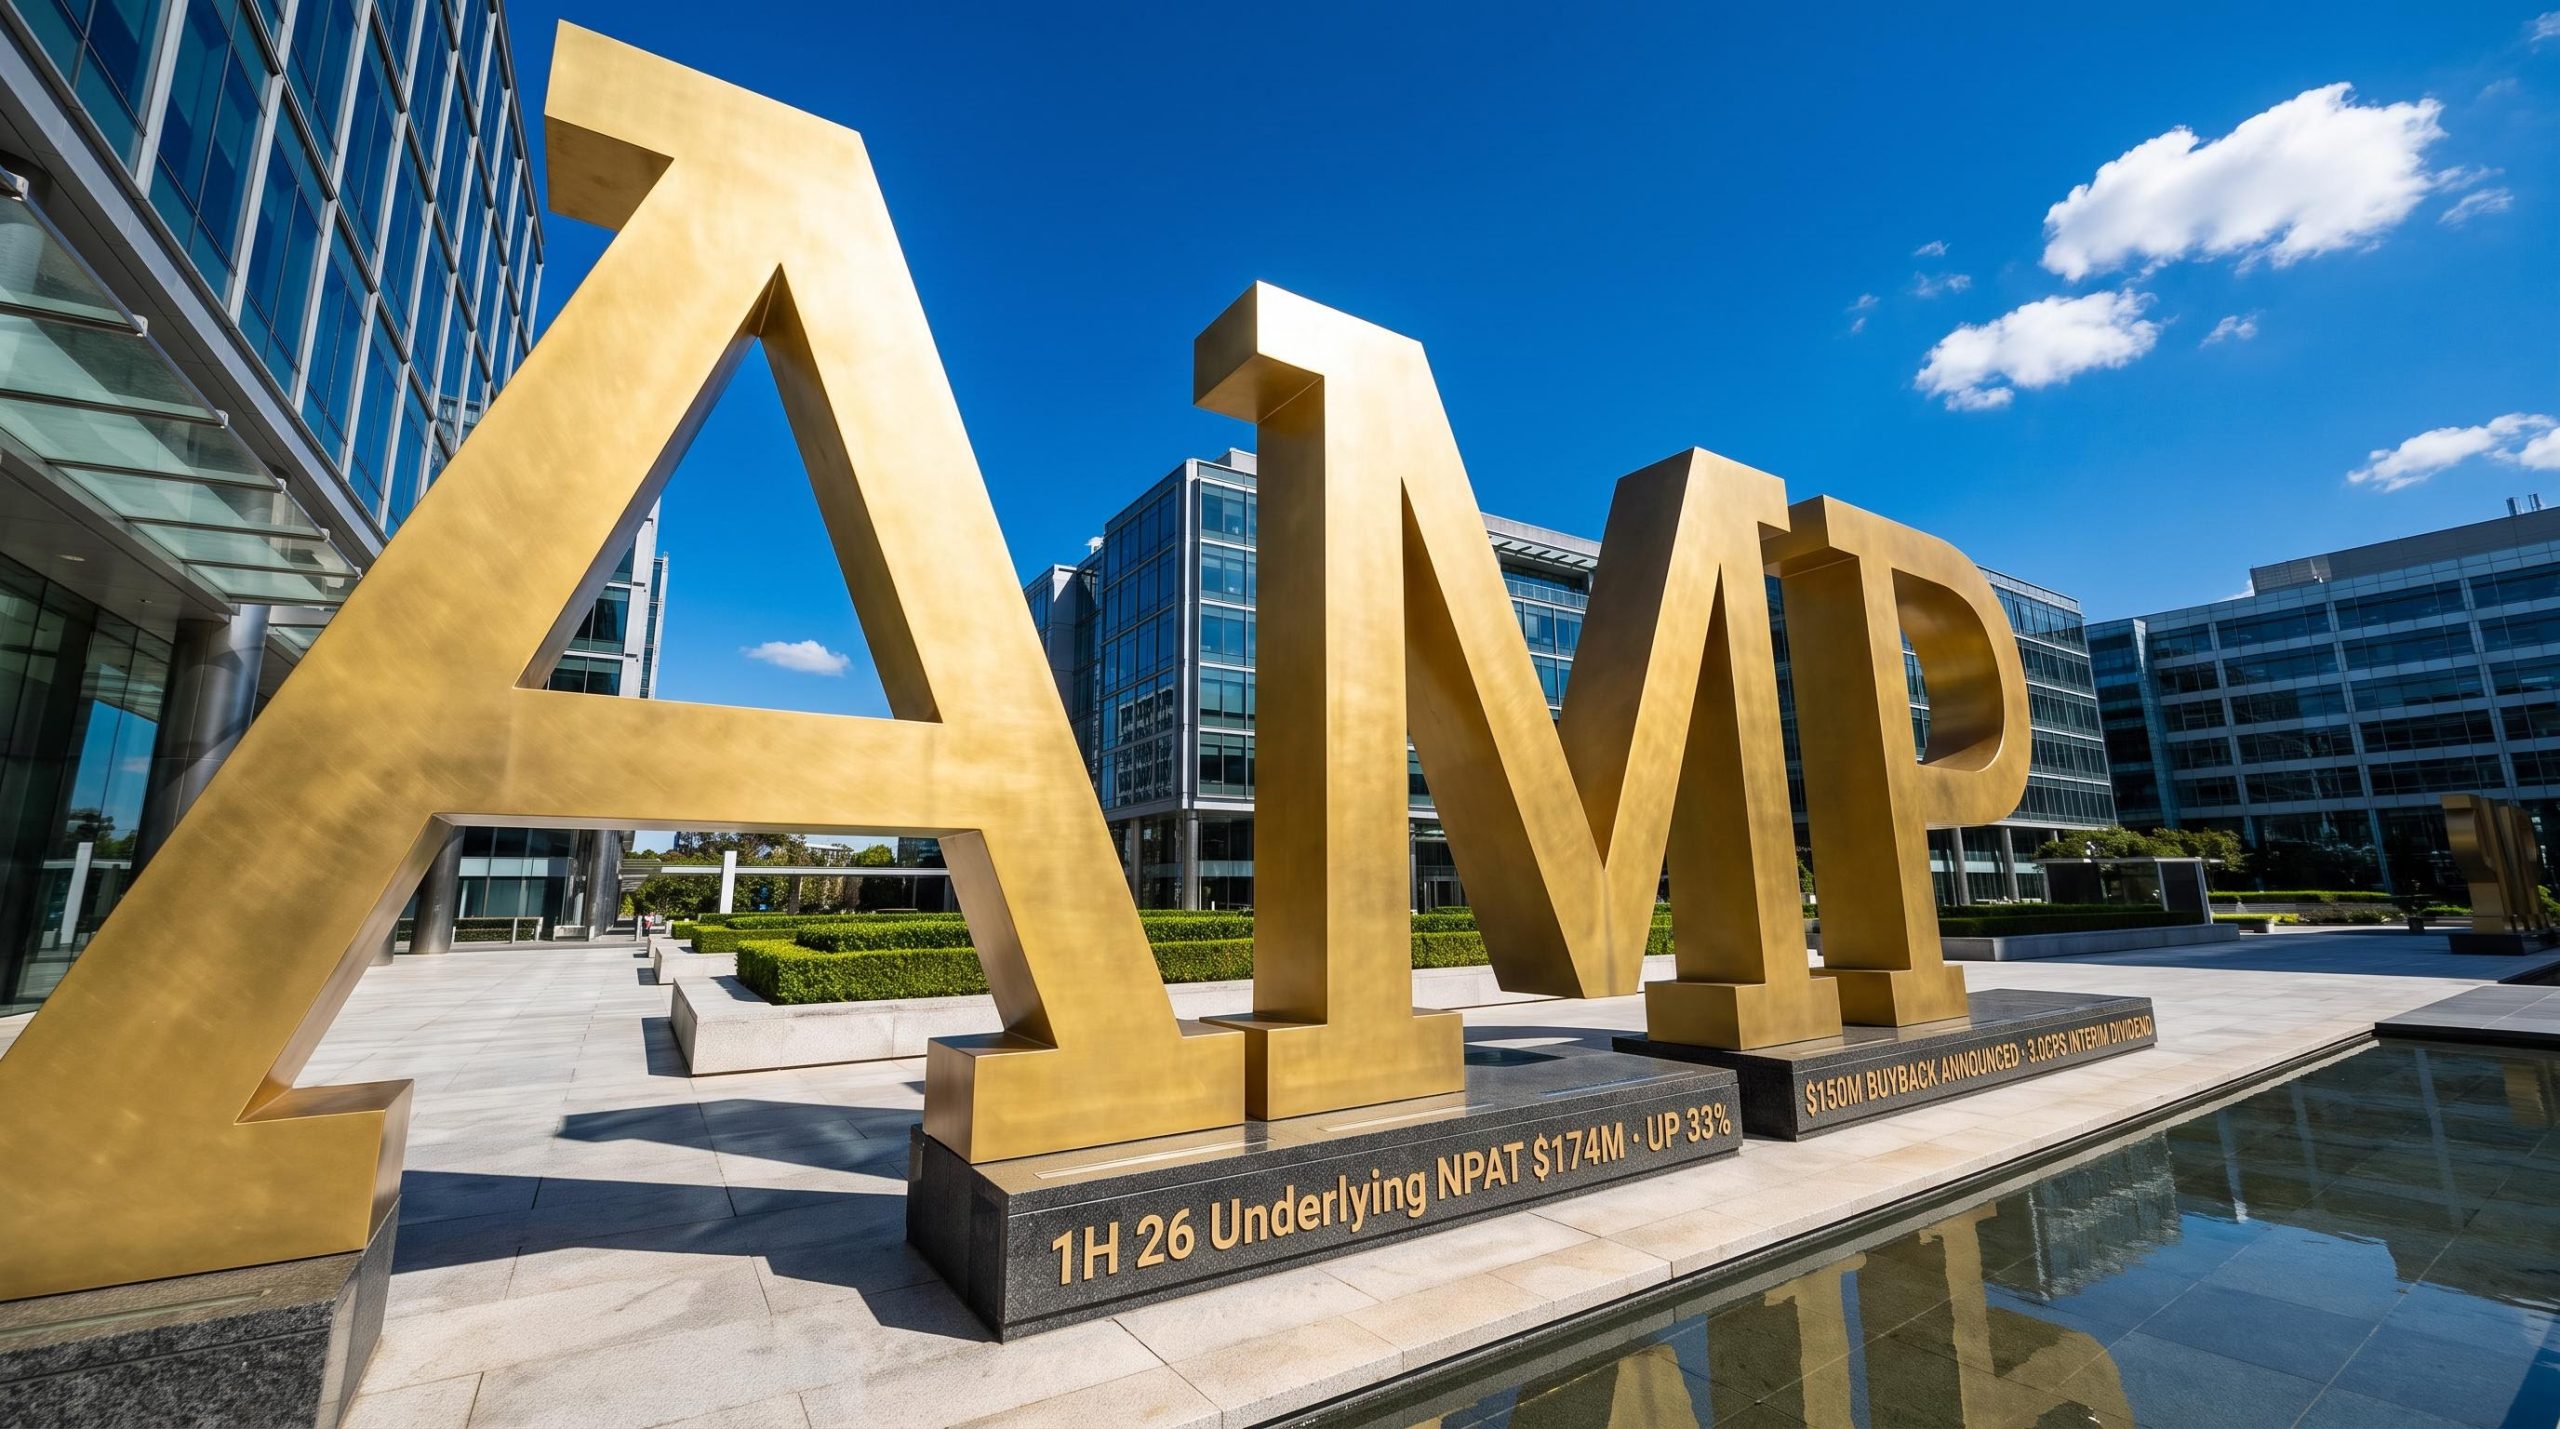
AMP delivers 33% lift in underlying profit and unveils fresh $150m buyback in 1H 26
In its 1H 26 results presentation delivered on 6 August 2026, AMP reported underlying net profit after tax of $174m, up 33%, with statutory profit reaching $154m, a rise of 57%. The results were presented to the market by Chief Executive Officer Blair Vernon and Chief Financial Officer Jackie Cleary for the half-year ended 30 June 2026.
Management coupled the earnings improvement with a substantial shareholder return story. AMP returned $201m to shareholders during the period and announced an additional $150m on-market share buyback alongside an interim dividend of 3.0cps, franked at 20%.
When big ASX news breaks, our subscribers know first
1H 26 results at a glance
The headline metrics highlighted improving earnings quality and disciplined cost control across the group.
| Metric | 1H 26 | 1H 25 | Change |
|---|---|---|---|
| Underlying NPAT | $174m | $131m | +33% |
| Statutory NPAT | $154m | $98m | +57% |
| EPS (underlying) | 6.9cps | 5.2cps | +33% |
| EBIT margin | 30.7% | 28.2% | +2.5pp |
| Cost to income | 60.5% | 63.0% | -2.5pp |
| ROE (underlying) | 9.8% | 7.4% | +2.4pp |
Capital-return highlights disclosed in the presentation included:
-
$201m returned to shareholders, representing 85% of surplus capital generation
-
$150m on-market share buyback completed in June
-
Additional $150m buyback announced
-
Interim dividend of 3.0cps, franked at 20%
-
$56m in net deferred tax assets (DTA) utilised during the half
Where the growth came from
Platforms and Super lead the wealth momentum
AMP’s Platforms business delivered underlying NPAT of $61m, up 15%, supported by net cashflows rising 33% to $3.1bn. Closing assets under management (AUM) reached $92.7bn, and the EBIT margin expanded 3.9pp to 42.1%, which management attributed to the scalability of the platform and continued operating leverage.
Superannuation & Investments recorded underlying NPAT of $32m, up 18%, with net cashflows of +$76m. The presentation described this as the first positive half since 2017, with closing AUM of $62.6bn.
New Zealand Wealth Management reported underlying NPAT of $18m, down 5.3% in Australian dollar terms due to foreign exchange headwinds, though up 4.8% in New Zealand dollar terms. Net cashflows rose 19.6% to $116m, driven by increased KiwiSaver inflows and higher contribution rates.
China partnerships more than double their contribution
The China partnerships contributed $56m to NPAT, up 107%, with annualised return on investment (ROI) rising to 16%, an increase of 7pp from 9%.
AMP had already signalled the strength of its China partnerships through upgraded profit guidance in July 2026, when management lifted the 1H 26 underlying NPAT range to $170m-$180m on the back of a 24% surge in China earnings and a $13m carried interest recognition from a legacy infrastructure fund.
AMP retains a 19.99% stake in China Life Pension Company (CLPC), carried at $589m, and a 14.97% stake in China Life AMP Asset Management Company (CLAMP), carried at $116m. Total China carrying value reached $705m, up 12.3%.
CLPC AUM rose 9% to RMB ~2.6tr. The presentation described CLPC as the pre-eminent pension company in China, holding one of only 12 Trustee Licences in the market.
Understanding AMP’s wealth and retirement opportunity
AMP’s investment case rests substantially on structural growth in mandated, long-term savings pools. Superannuation in Australia, KiwiSaver in New Zealand, and China’s pension pillars represent pools of largely compulsory savings that tend to grow regardless of market cycles. AMP earns fees on the assets it administers, generating AUM-based revenue that is recurring in nature.
A clinical endpoint of this model is scale. As mandated contributions accumulate and populations age, the addressable pool of assets expands, supporting fee revenue that is relatively capital-light. The presentation outlined several structural tailwinds:
-
Australia: 12% compulsory super contributions, 4.5m Australians already retired with 806,000 more expected within five years, and $750bn of assets set to move into the retirement phase over the next decade
-
New Zealand: approximately 340,000 additional New Zealanders reaching retirement age by 2036, alongside rising KiwiSaver participation
-
China: 12% compulsory Pillar 2 contributions, a population of approximately 1.4bn, and Pillar 3 personal pensions launched in December 2024
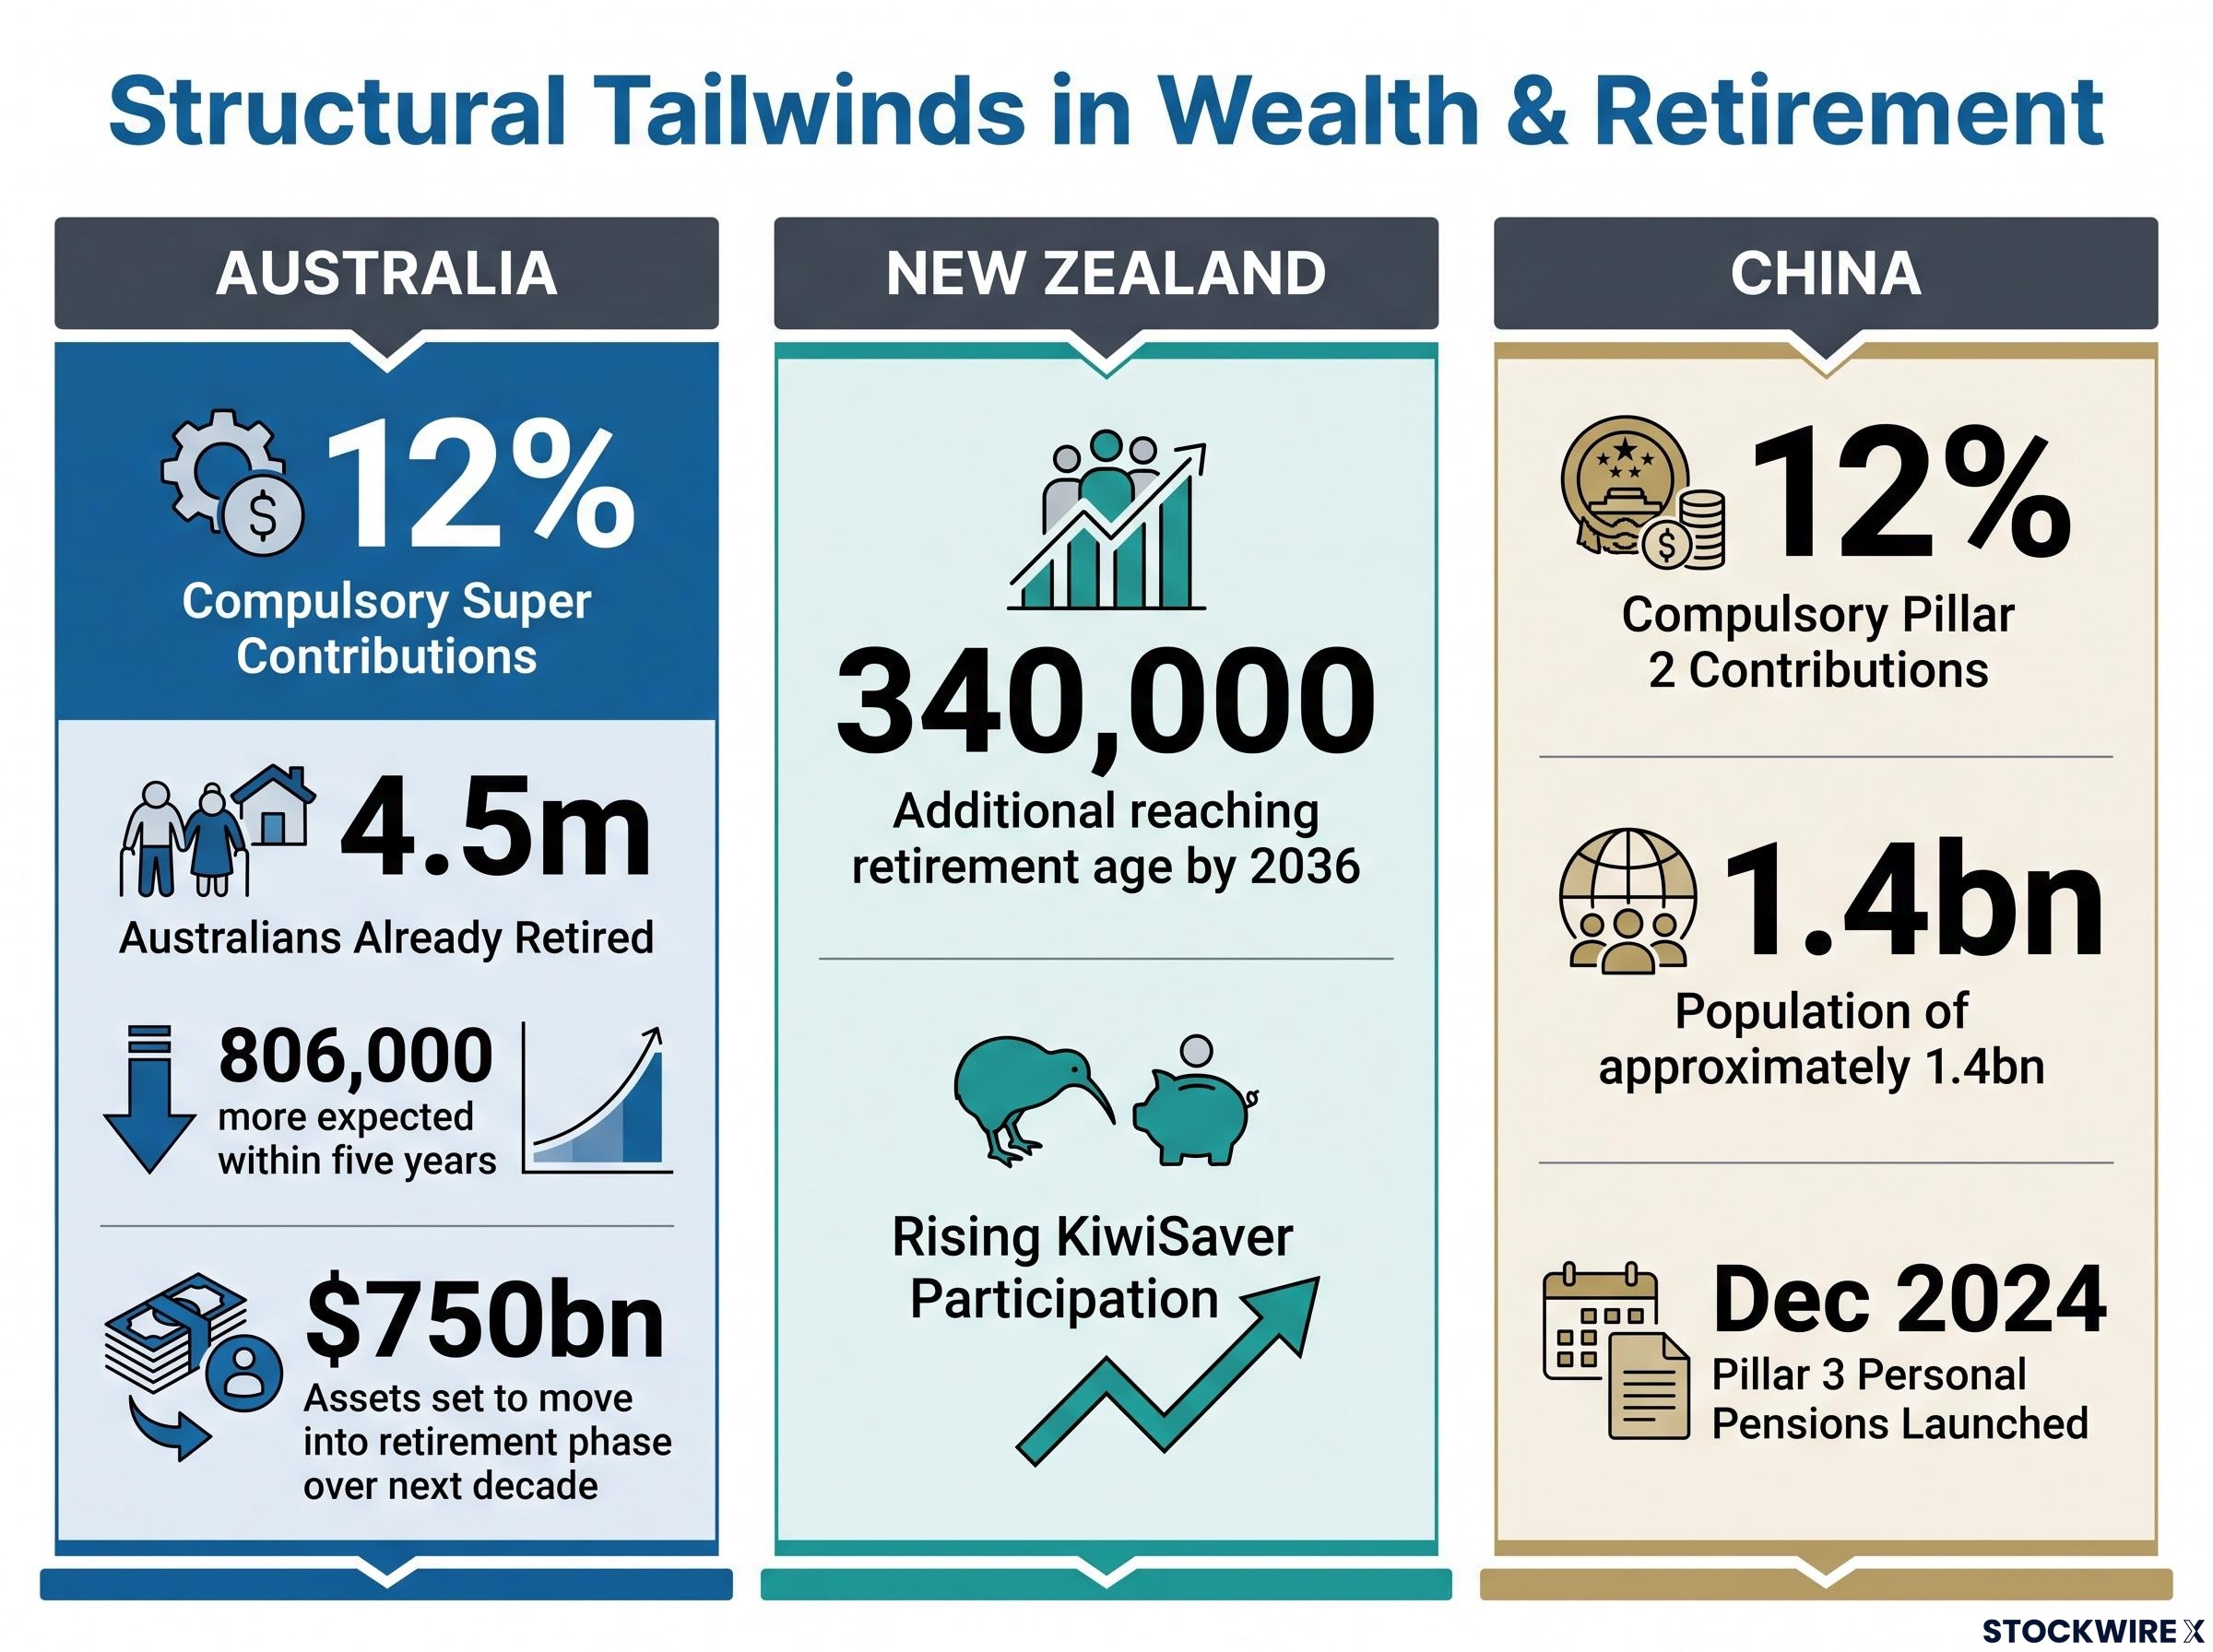
For investors, the significance lies in the connection between structural asset growth and AMP’s recurring, capital-light fee revenue. As these savings pools expand, the base on which AMP earns administration and investment fees grows accordingly.
Capital strength funding shareholder returns
Total surplus capital generation reached $236m in 1H 26, including $56m of DTA utilisation and $79m of bank capital efficiency. This underpins the group’s capacity to return capital while continuing to invest in growth.
Group CET1 surplus capital rose to $322m, up 12.2% from $287m at FY 25, despite the $201m returned to shareholders during the half. Net tangible assets per share stood at $1.35, up from $1.33.
Management position on capital
Management emphasised a disciplined approach to capital, prioritising the return of surplus capital to shareholders while directing investment toward growth in its capital-light wealth businesses. Capital release from the Bank and non-strategic partnerships remains a key focus.
The simplification story and what comes next
A business reset and rebuilt
Management framed AMP’s position as a completed simplification, with the business simplified and its cost base reset. Legacy litigation matters were largely resolved, with litigation and remediation related costs down 54.5% during the period.
Blair Vernon’s appointment as CEO in March 2026, promoted internally from the CFO role he held during AMP’s multi-year simplification, positioned the group to maintain strategic continuity through the wealth-focused rebuild rather than reset priorities under an external hire.
The company’s reputation score is now rated as ‘strong’, with a Reptrak Q2 2026 score of 70.6, described in the presentation as the highest since tracking began in 2008.
AMP Bank recorded underlying NPAT of $20m, down 33%, reflecting investment to scale AMP Bank GO, whose deposits reached $1.7bn. The Bank and non-strategic partnerships were framed as a capital release and realisation focus.
FY 26 guidance and 2H priorities
Forward guidance was disclosed as subject to market conditions. Key items included:
-
Platforms AUM-based revenue margins expected at 40–41bps
-
Superannuation & Investments margins expected at 60–61bps
-
AMP Bank GO target of $2.0bn in deposits, with NIM of approximately 1.25%
-
Combined Partnerships annualised ROI anticipated at 12–15%
-
Controllable costs expected at $630m–$640m
-
The Board to review the final dividend at FY 26
Management summarised its 2H 26 priorities as accelerating growth in the wealth businesses, increasing cash generation and shareholder returns, and leveraging AI while managing emerging risks.
Stay Ahead on ASX Finance News
Big News Blast delivers FREE breaking ASX finance and fintech alerts to your inbox within minutes of release, complete with in-depth analysis so the work is already done. Join 20,000+ subscribers who never miss a market-moving announcement. Click the “Free Alerts” button at StockWire X to get started today.