
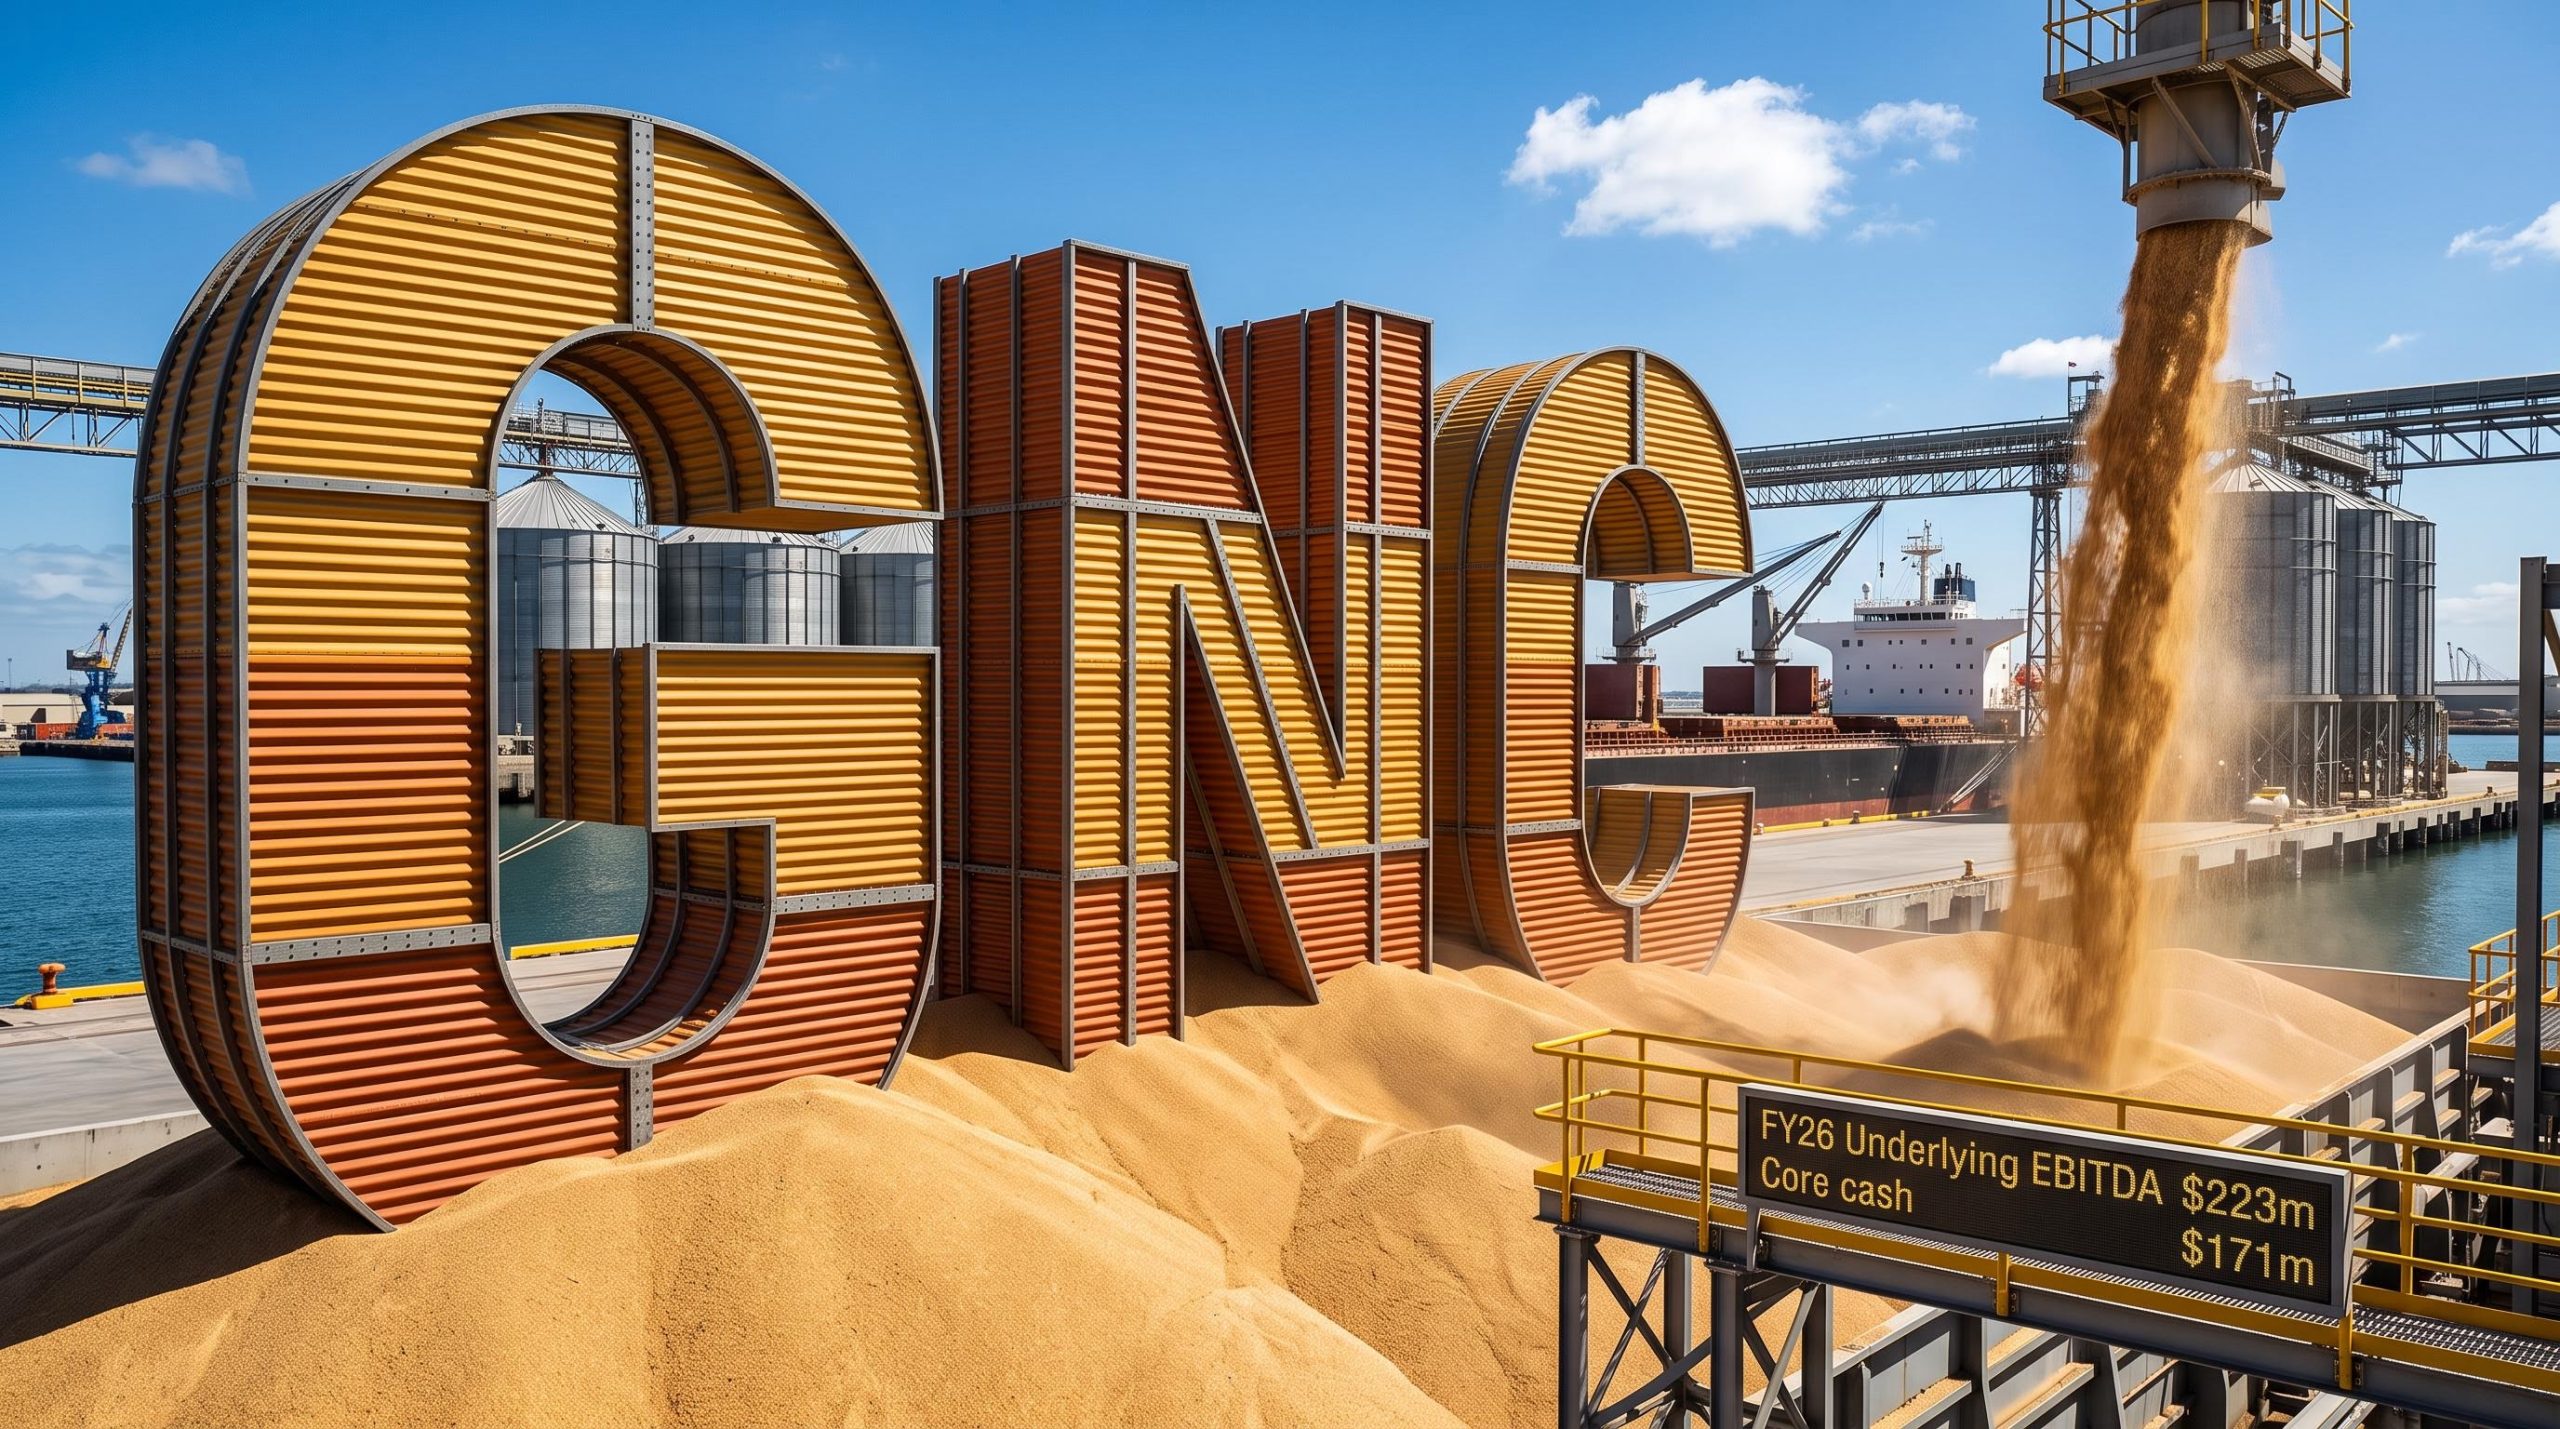
FY26 results presentation: $223m Underlying EBITDA and $171m core cash
In its FY26 results presentation dated 12 November 2026, GrainCorp outlined Underlying EBITDA of $223m (FY25: $308m) and closing core cash of $171m for the 12 months to 30 September 2026.
Management highlighted that surplus global grain production and low commodity pricing reduced grower willingness to bring grain to market. The operating context was record global wheat production in 2025-26 and grain pricing at multi-year lows during the key Australian 2025-26 marketing window.
The initial FY26 earnings guidance had already pointed to compressed export margins, with grower reluctance to sell into weak pricing flagged well before the full-year numbers were struck.
The headline metrics management presented were:
- Underlying NPAT of $31m (FY25: $87m)
- Statutory NPAT of ($10m) (FY25: $40m)
- Total grain handled of 28.6mmt (FY25: 31.6mmt)
- FY26 dividends of 28cps (FY25: 28cps ordinary, 20cps special)
When big ASX news breaks, our subscribers know first
Where the earnings came from
Management described FY26 as a year of below-average margin opportunities across the industry value chain, with a focus on disciplined execution.
Segment earnings
The presentation split Underlying EBITDA by segment as follows.
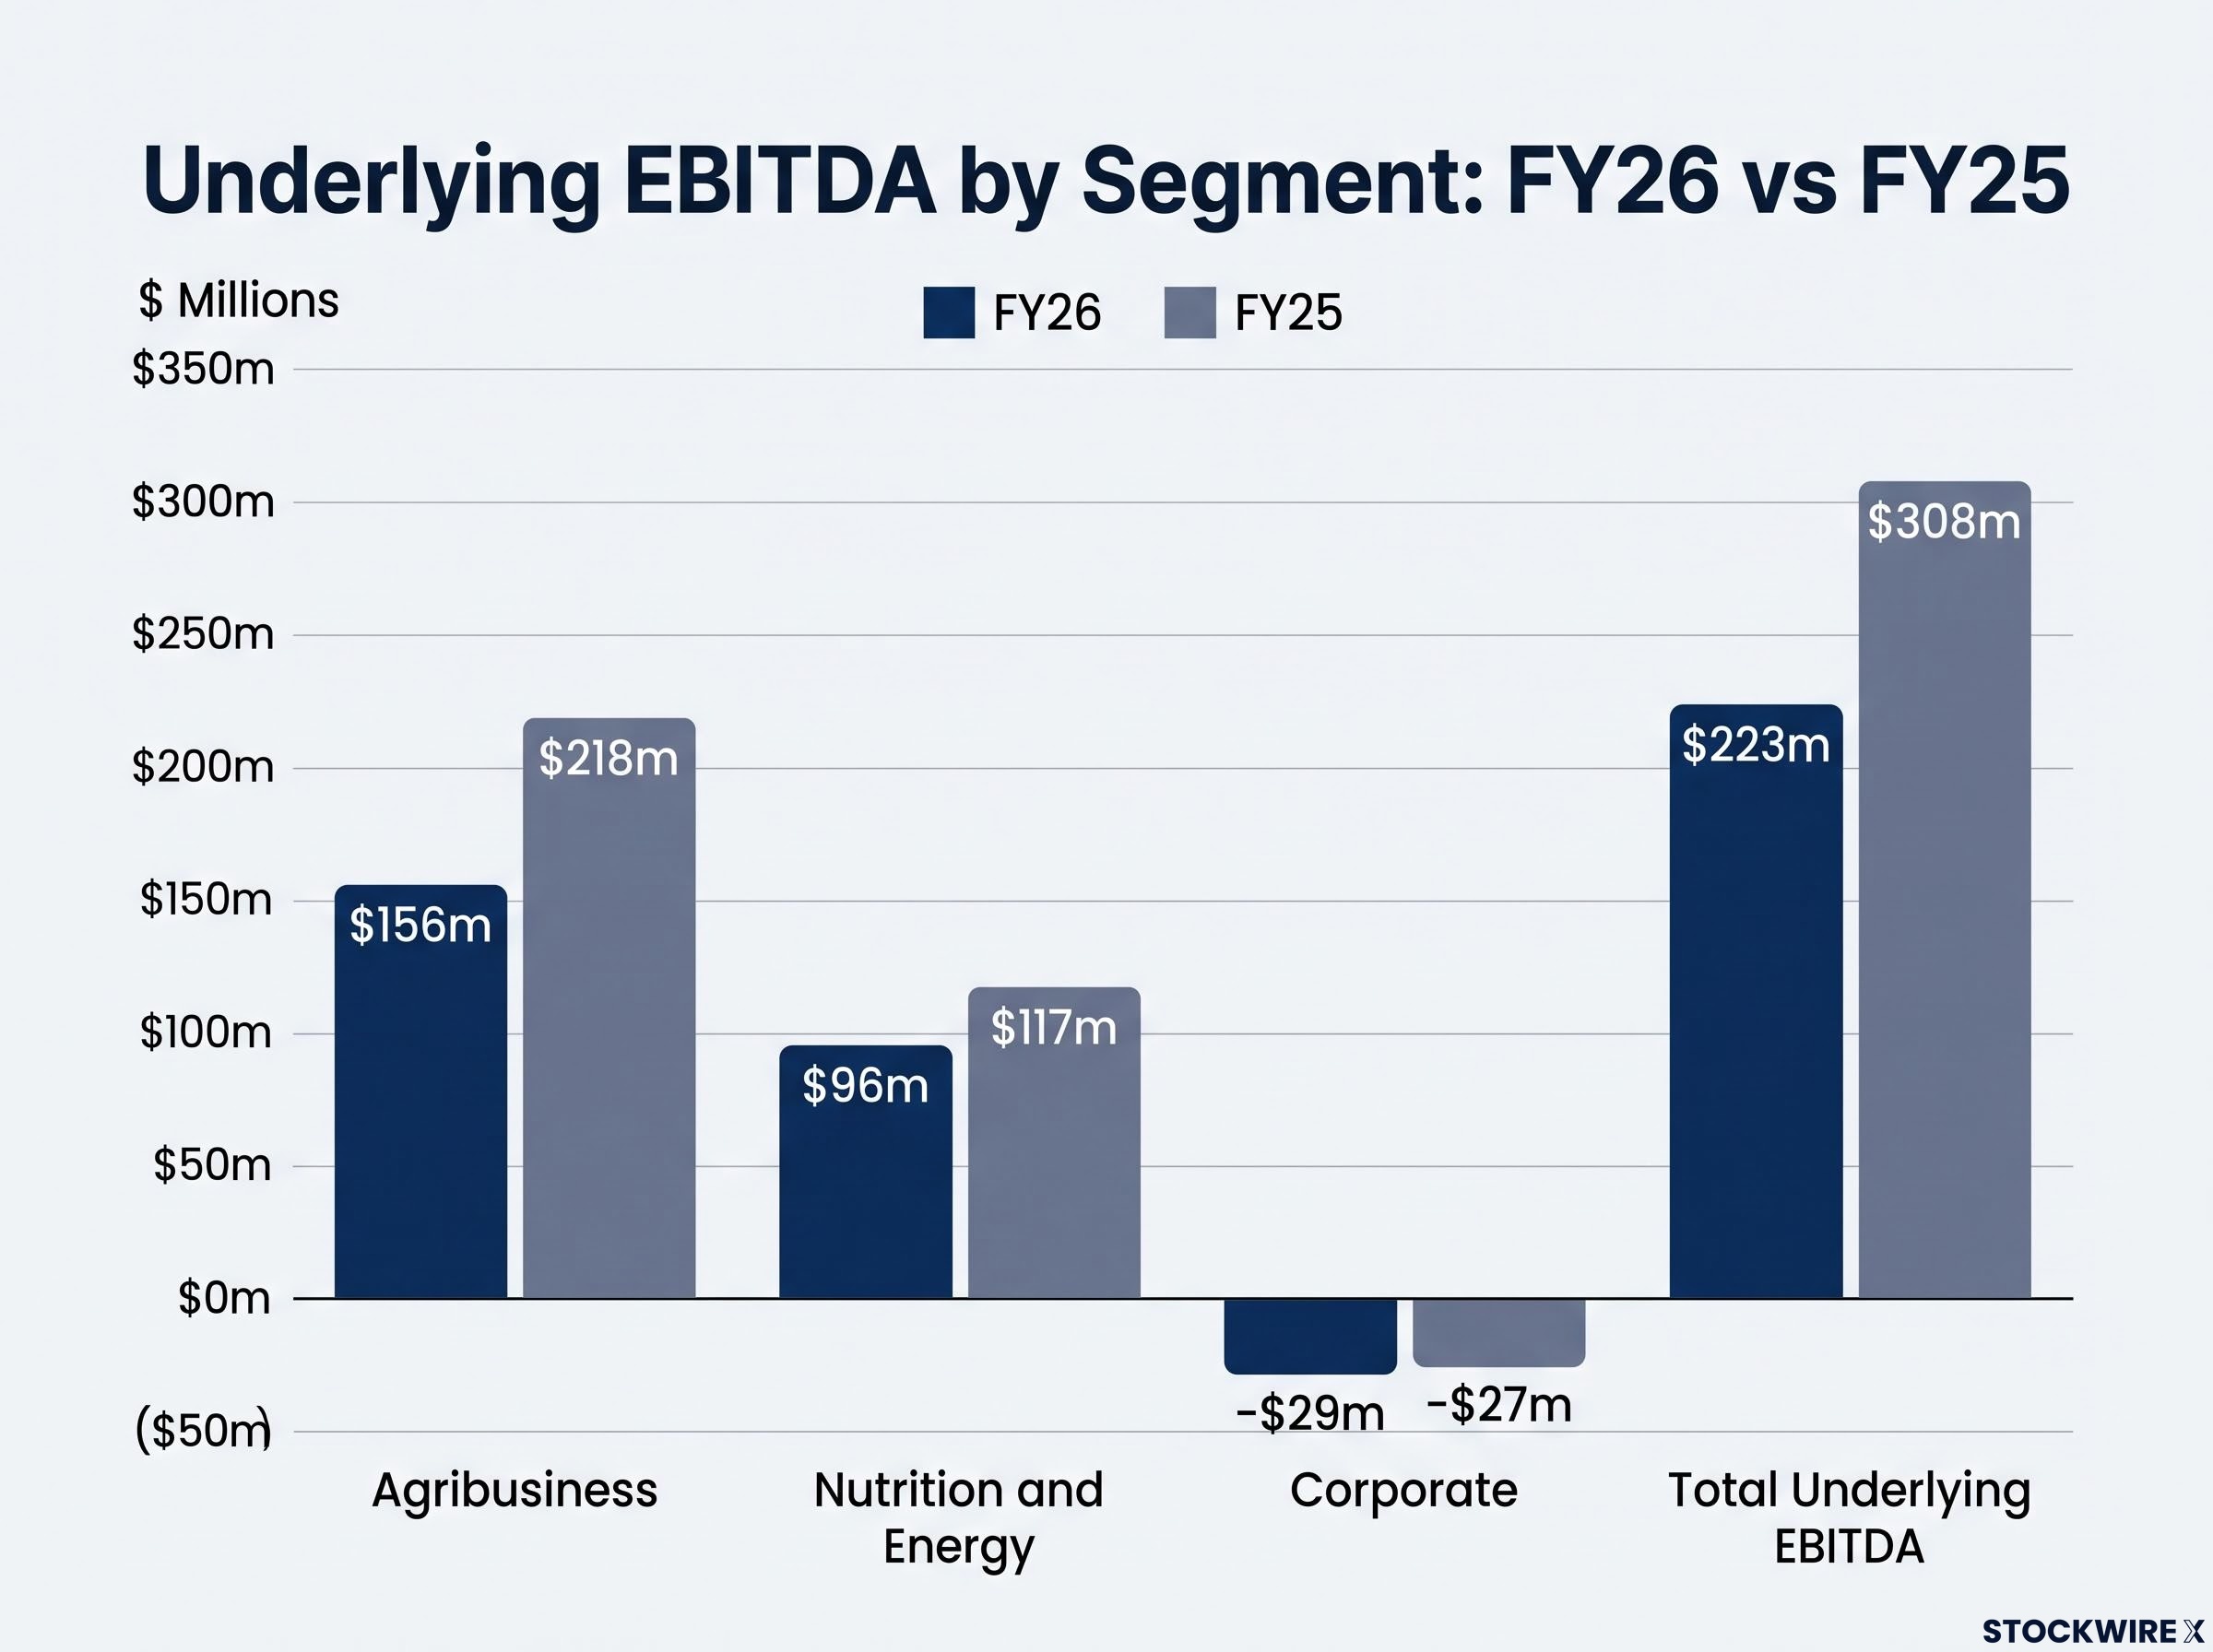
| Underlying EBITDA ($m) | FY26 | FY25 |
|---|---|---|
| Agribusiness | 156 | 218 |
| Nutrition and Energy | 96 | 117 |
| Corporate | (29) | (27) |
| Underlying EBITDA | 223 | 308 |
Agribusiness
In East Coast Australia (ECA), lower receivals (12.0mmt versus 13.3mmt) and below-average end-to-end margins weighed on the result.
The International result, excluding GrainsConnect Canada, was $25m higher year-on-year. It included record sales volumes, coinciding with a record Western Australian winter crop of 27.2mmt in 2025-26.
Nutrition and Energy
Animal Nutrition sales volumes reached a record 751kmt (FY25: 713kmt), the fifth successive year of growth. Human Nutrition earnings were lower, with the company citing edible oils sales volumes, while canola crush came in at 553kmt.
Agri-energy achieved record six-month sales volumes in 2H26, as volumes and margins recovered following a soft 1H26.
Understanding core cash and through-the-cycle earnings
Core cash is a measure management uses alongside net debt. The key points from the presentation were:
- Core cash is net cash/(debt) plus commodity inventory.
- Commodity inventory covers grain, oilseed, vegetable oil and animal fat commodities held, and is predominantly funded with specific short-term commodity inventory debt facilities.
- Net debt was $426m at 30 September 2026 ($102m a year earlier), partially due to higher commodity inventory funding.
- The value of commodity inventory fluctuates with seasonal grain purchases and underlying commodity prices, which is why core cash was $171m against that net debt figure.
Through-the-cycle (TTC) average earnings are a framework for GrainCorp’s earnings across a cycle of varied operating conditions. Management said it has confidence in TTC average earnings of $320 million.
Balance sheet, returns and growth strategy
Capital management
GrainCorp declared a 14cps final dividend, fully franked, bringing FY26 total dividends to 28cps, fully franked. The buy-back was extended for 12 months in February 2026, with $38m of the $75m completed to date.
Capex and investments were $80m, below depreciation and amortisation of $117m.
Strategy and transformation
The Business Transformation Program delivered $12m in early-stage run-rate benefits. Management is targeting a $20-30 million EBITDA uplift in average earnings through-the-cycle following program completion.
Expansion priorities included Animal Nutrition capacity, port utilisation through Bulk Materials, and the renewable fuels work with MoU partners Ampol and IFM Investors. The sale of GrainsConnect Canada was completed in 2H26.
The GrainsConnect Canada exit followed a strategic review launched in December 2025 and was agreed jointly with partner Zen-Noh, with the buyer being Parrish & Heimbecker.
What happens next for GrainCorp
The Australian Bureau of Agricultural and Resource Economics and Sciences (ABARES) estimated an ECA winter crop of 26.6mmt for the 2026-27 season. GrainCorp’s FY27 receivals stand at 2.1mmt, and FY27 export and crush margins are expected to improve from FY26 levels.
The dated items from the presentation are:
- Earnings guidance is to be provided at the AGM in February 2027.
- Release 1 (Nutrition and Energy) systems deployment has been deferred to 2Q CY27, with estimated remaining spend of $30-35m.
- The business-wide Transformation Program is on track to deliver run-rate benefits of $20-30 million by the end of FY28.
Want Alerts Like This on the Consumer Staples Stocks You Follow?
StockWire X Market Intelligence scores every announcement in our coverage for how significant it’s likely to be for investors, and which way it points. The first 1,000 founding members lock in 50% off for life: A$247 a year instead of the standard A$495. Join the founding waitlist today.