The US Dollar Index (DXY) has just printed a fresh 2026 high near 102.96, edging past October’s 102.94 peak. The odd part is that markets already treat a December Fed rate hike as close to certain. When the main driver is priced in, what is left to push the dollar higher?
The answer came from a convergence this week. Yesterday’s October CPI ran hot for a third straight month, and Fed officials leaned hawkish within hours. The index climbed for a second session on Wednesday, 11 November 2026, as traders reworked their December assumptions.
Whether this rally lasts matters well beyond currency desks. If you hold foreign shares, unhedged international funds, commodities or cash in another currency, the dollar’s direction feeds straight into your returns.
The sections below give you a working framework for that judgement. They link the inflation data, Fed pricing, the yield curve and the chart levels, so you can decide for yourself whether dollar strength has room to run.
How a hot October CPI turned a priced-in hike into a bigger debate
The miss was small. On 10 November, the Bureau of Labor Statistics (BLS) reported headline CPI up 0.4% month on month against a 0.3% consensus. Core CPI, which strips out food and energy, rose 0.3% against expectations of 0.2%.
| Measure | October (m/m) | Consensus | September (m/m) |
|---|---|---|---|
| Headline CPI | +0.4% | +0.3% | +0.6% |
| Core CPI | +0.3% | +0.2% | +0.3% |
Headline inflation actually slowed from September’s 0.6%. That detail barely mattered, because the print completed a pattern Fed Governor Christopher Waller had flagged in advance. Waller backed a 25 basis point hike in December regardless of the data, but said a 50 basis point move should be considered if core CPI came in around 0.3% or higher. A basis point is one hundredth of a percentage point.
Core landed exactly on his line. ING framed it as the third consecutive hot month.
With a 25 bp hike already the base case, the live question shifted to 25 versus 50. Pricing for the 8-9 December meeting now looks like this:
- OrderFlow Futures (11 November): 88.8% for 25 bp, 11.2% for 50 bp
- CME FedWatch, cited by FXStreet: 87.1% for 25 bp, 12.9% for 50 bp
- CNBC: odds of 50 bp rose from zero to 10.5% after the release
- No hike: priced at essentially 0% across sources
The supply-driven nature of recent inflation and a strong October payrolls print help explain why December Fed hike odds sit so high, and why a hold, not a hike, would now be the bigger surprise for currency markets.
The sources differ slightly, but the direction is identical. The lesson for you is that markets trade the change in the likely policy path, not the data itself. A 0.1 point beat matters when it drags a bigger hike from impossible to plausible.
When big ASX news breaks, our subscribers know first
Why bear-flattening yields lift the dollar, and how the index is built
That shift in odds showed up first in Treasury yields. According to CNBC on 10 November, the 2-year yield jumped more than 15 bp to 4.698%, while the 10-year rose more than 7 bp to 4.938%. That leaves the gap between them at about 24 bp, though intraday readings varied across sources.
This is a bear flattening. It means yields rise across the curve, but short-dated yields rise faster than long-dated ones, narrowing the spread between them. It typically lifts the dollar in four steps:
- It raises the expected return on dollar assets.
- It tightens US financial conditions.
- It weakens appetite for carry-sensitive and cyclical currencies.
- It draws safe-haven demand towards the dollar.
ING’s Chris Turner argued on 11 November that this favours the dollar most against “activity currencies” such as the Australian and New Zealand dollars and emerging-market currencies, which lean on global growth and risk appetite. ING expects the dollar to hold near its highs, pointing to a US jobs market that may be gathering pace, underlying inflation running far above target and a Fed prepared to raise rates again. The bank places near-term DXY resistance at 102.85-103.00.
A steep-front, flat-back yield curve has appeared only about 5.4% of the time since 1990, and it has tended to cluster around periods of economic stress, which tempers the dollar-bullish reading of higher front-end yields.
What is DXY actually measuring?
DXY tracks the dollar against six major currencies using geometric weighting, which means each exchange rate’s move is scaled by a fixed weight and the results are multiplied together rather than simply averaged.
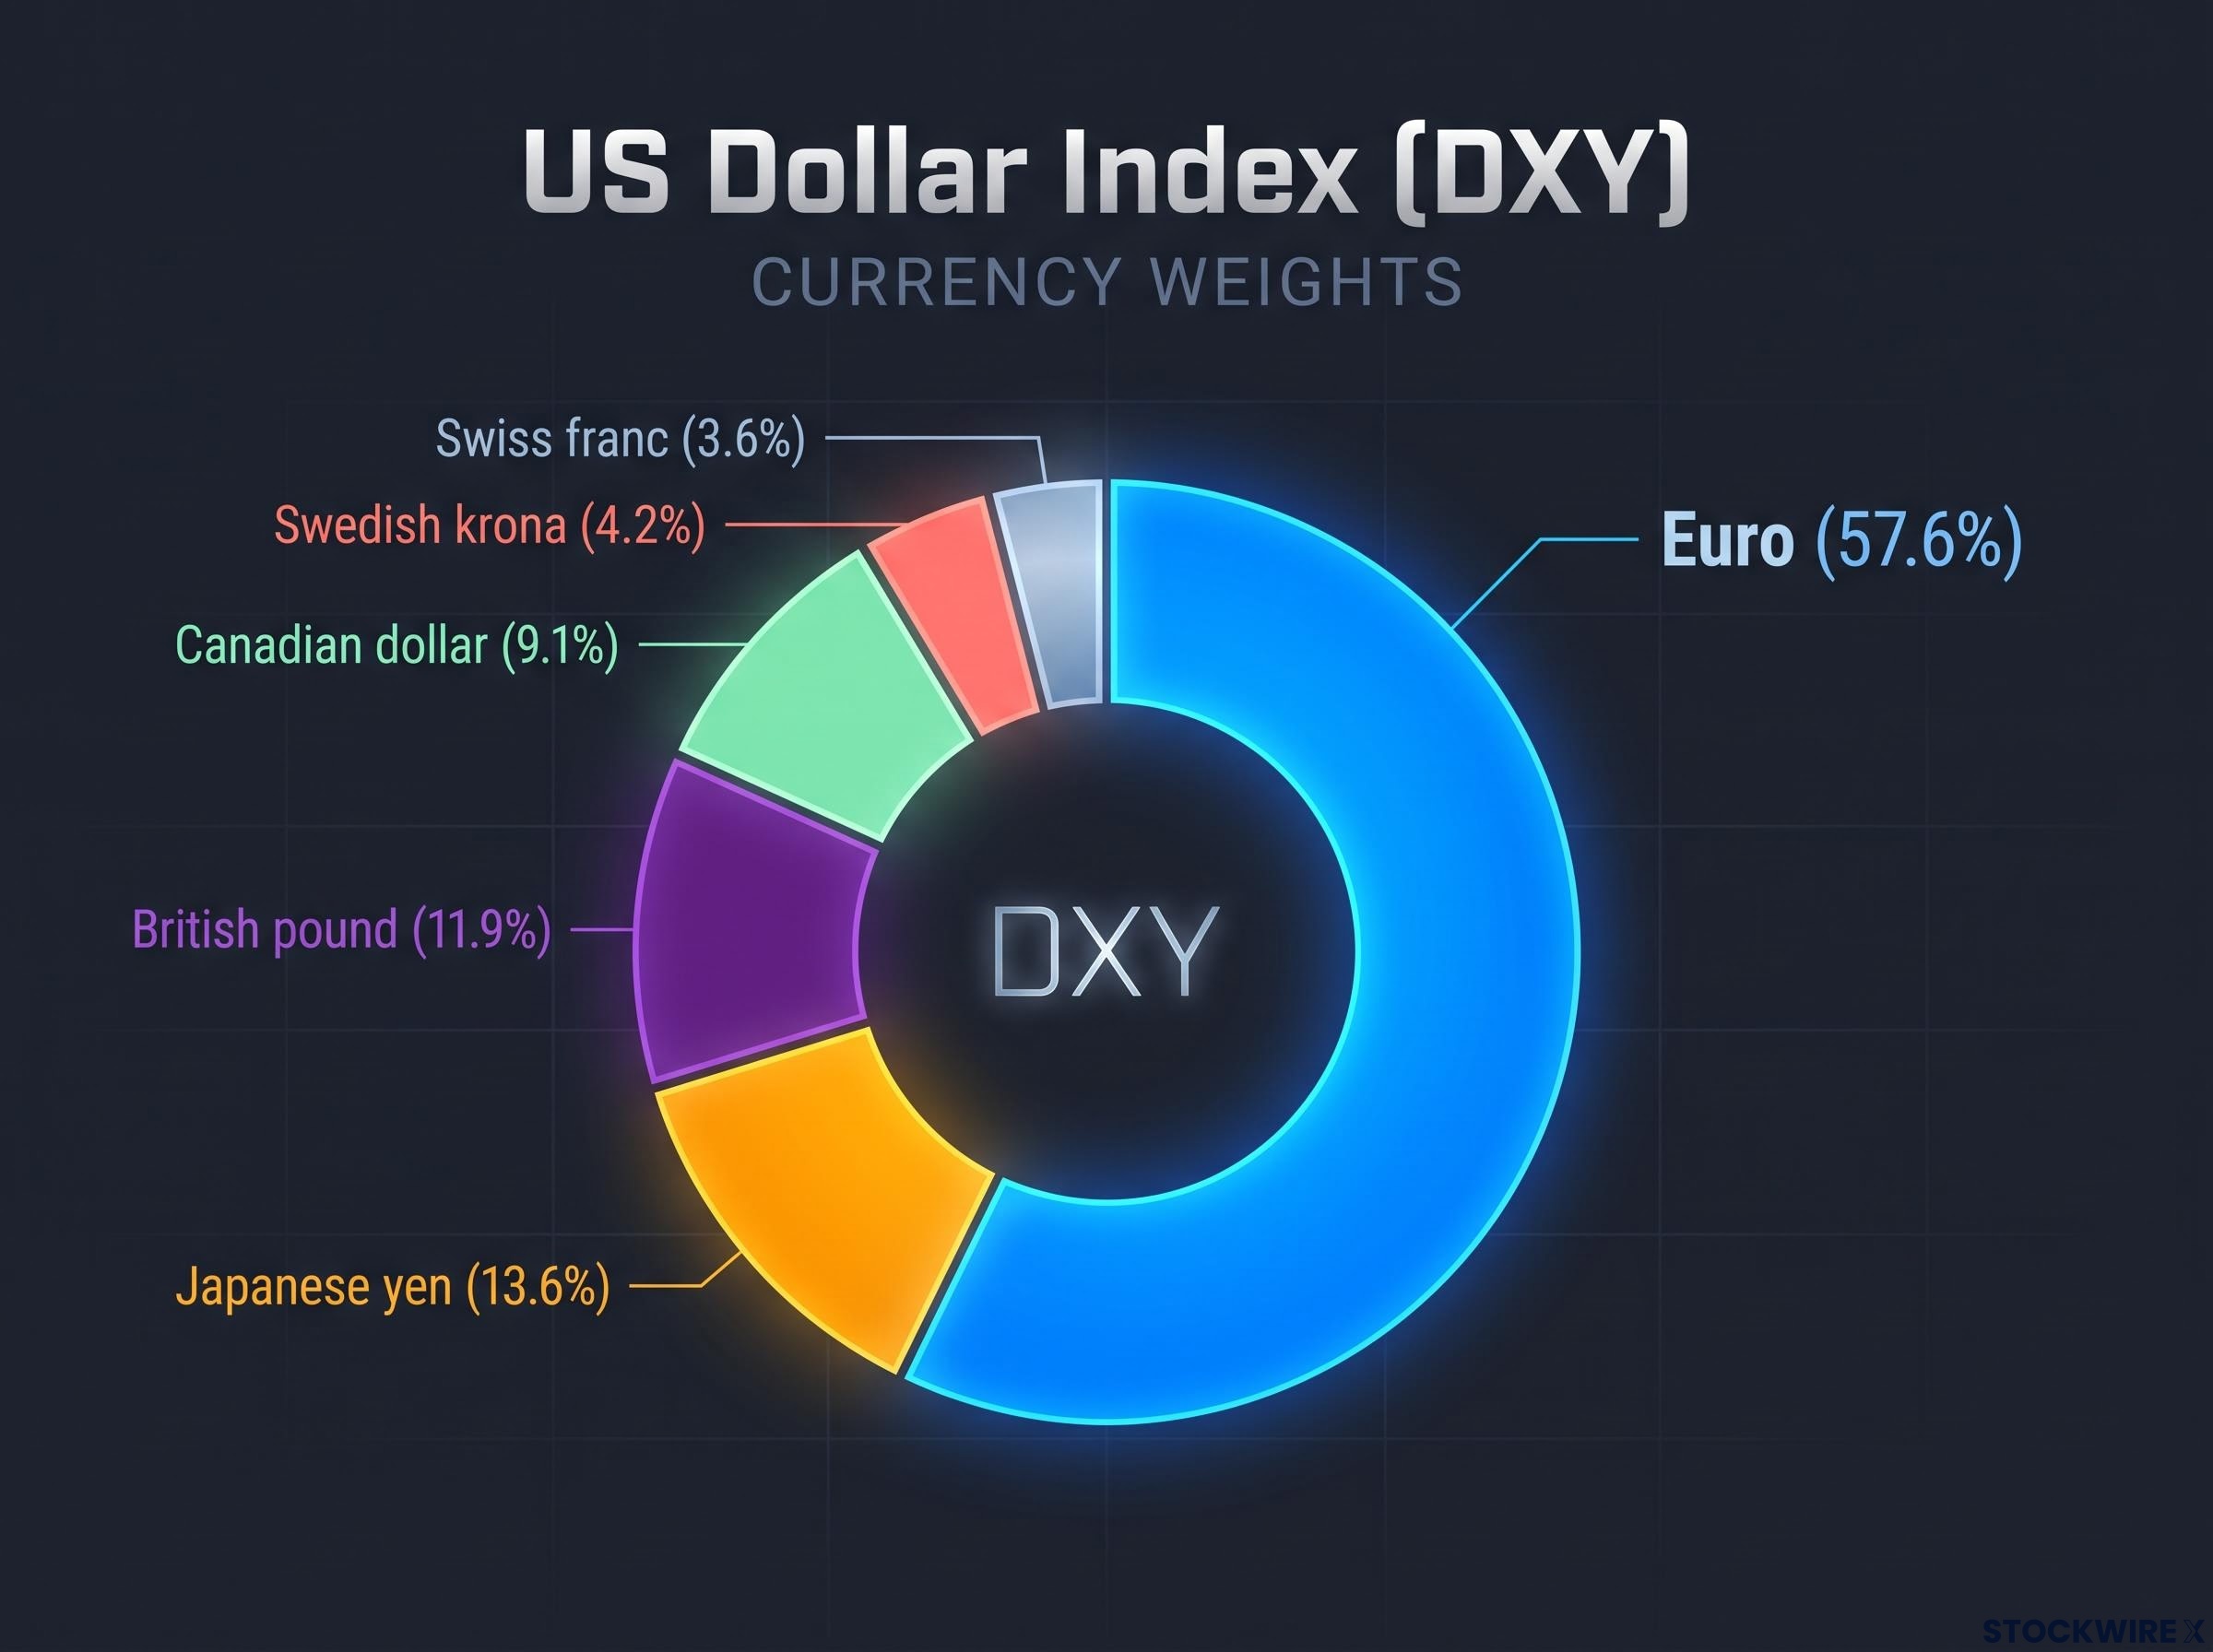
The Euro dominates the US Dollar Index, making up 57.6% of its total weighting against five other currencies.
| Currency | Weight in DXY |
|---|---|
| Euro | 57.6% |
| Japanese yen | 13.6% |
| British pound | 11.9% |
| Canadian dollar | 9.1% |
| Swedish krona | 4.2% |
| Swiss franc | 3.6% |
With the euro at 57.6%, a weaker EUR/USD mechanically pushes the index higher. On Wednesday the dollar gained 0.67% against the euro, 0.99% against the Swiss franc, 0.69% against the yen and 0.53% against sterling. Its 0.71% jump against the New Zealand dollar and 0.21% against the Australian dollar never touch DXY at all.
That is the index’s blind spot: it is not a broad trade-weighted measure. When you read a DXY headline, you are mostly reading a euro story, so check EUR/USD and the wider basket before concluding the dollar is strong everywhere.
The chart levels that decide whether 103 is a launchpad or a ceiling
The yield move has also reshaped the daily chart. DXY has broken out of a bullish flag, a pause pattern that often resolves in the direction of the prior trend, and sits above its 21-, 50- and 100-day simple moving averages.
Momentum supports the move without looking stretched. The Relative Strength Index (RSI), a 0-100 gauge of recent buying pressure, reads about 63, positive but short of overbought. The MACD, a trend-momentum indicator, has turned slightly positive.
| Level | Type | What it represents |
|---|---|---|
| 105 | Resistance | Second upside target |
| 104 | Resistance | First target after a close above 103 |
| 103 | Resistance | Round level, top of ING’s 102.85-103.00 zone |
| 102.20 | Support | Former upper flag boundary |
| 102 / 101.97 | Support | Round level and 21-day SMA |
| 101.24 | Support | 50-day SMA, near lower flag boundary |
| 100.77 | Support | 100-day SMA |
A daily close above 103 would clear both the round number and ING’s resistance band, opening 104 and then 105. On the way down, moving averages act as dynamic support, levels that rise with the trend where buyers have tended to step in.
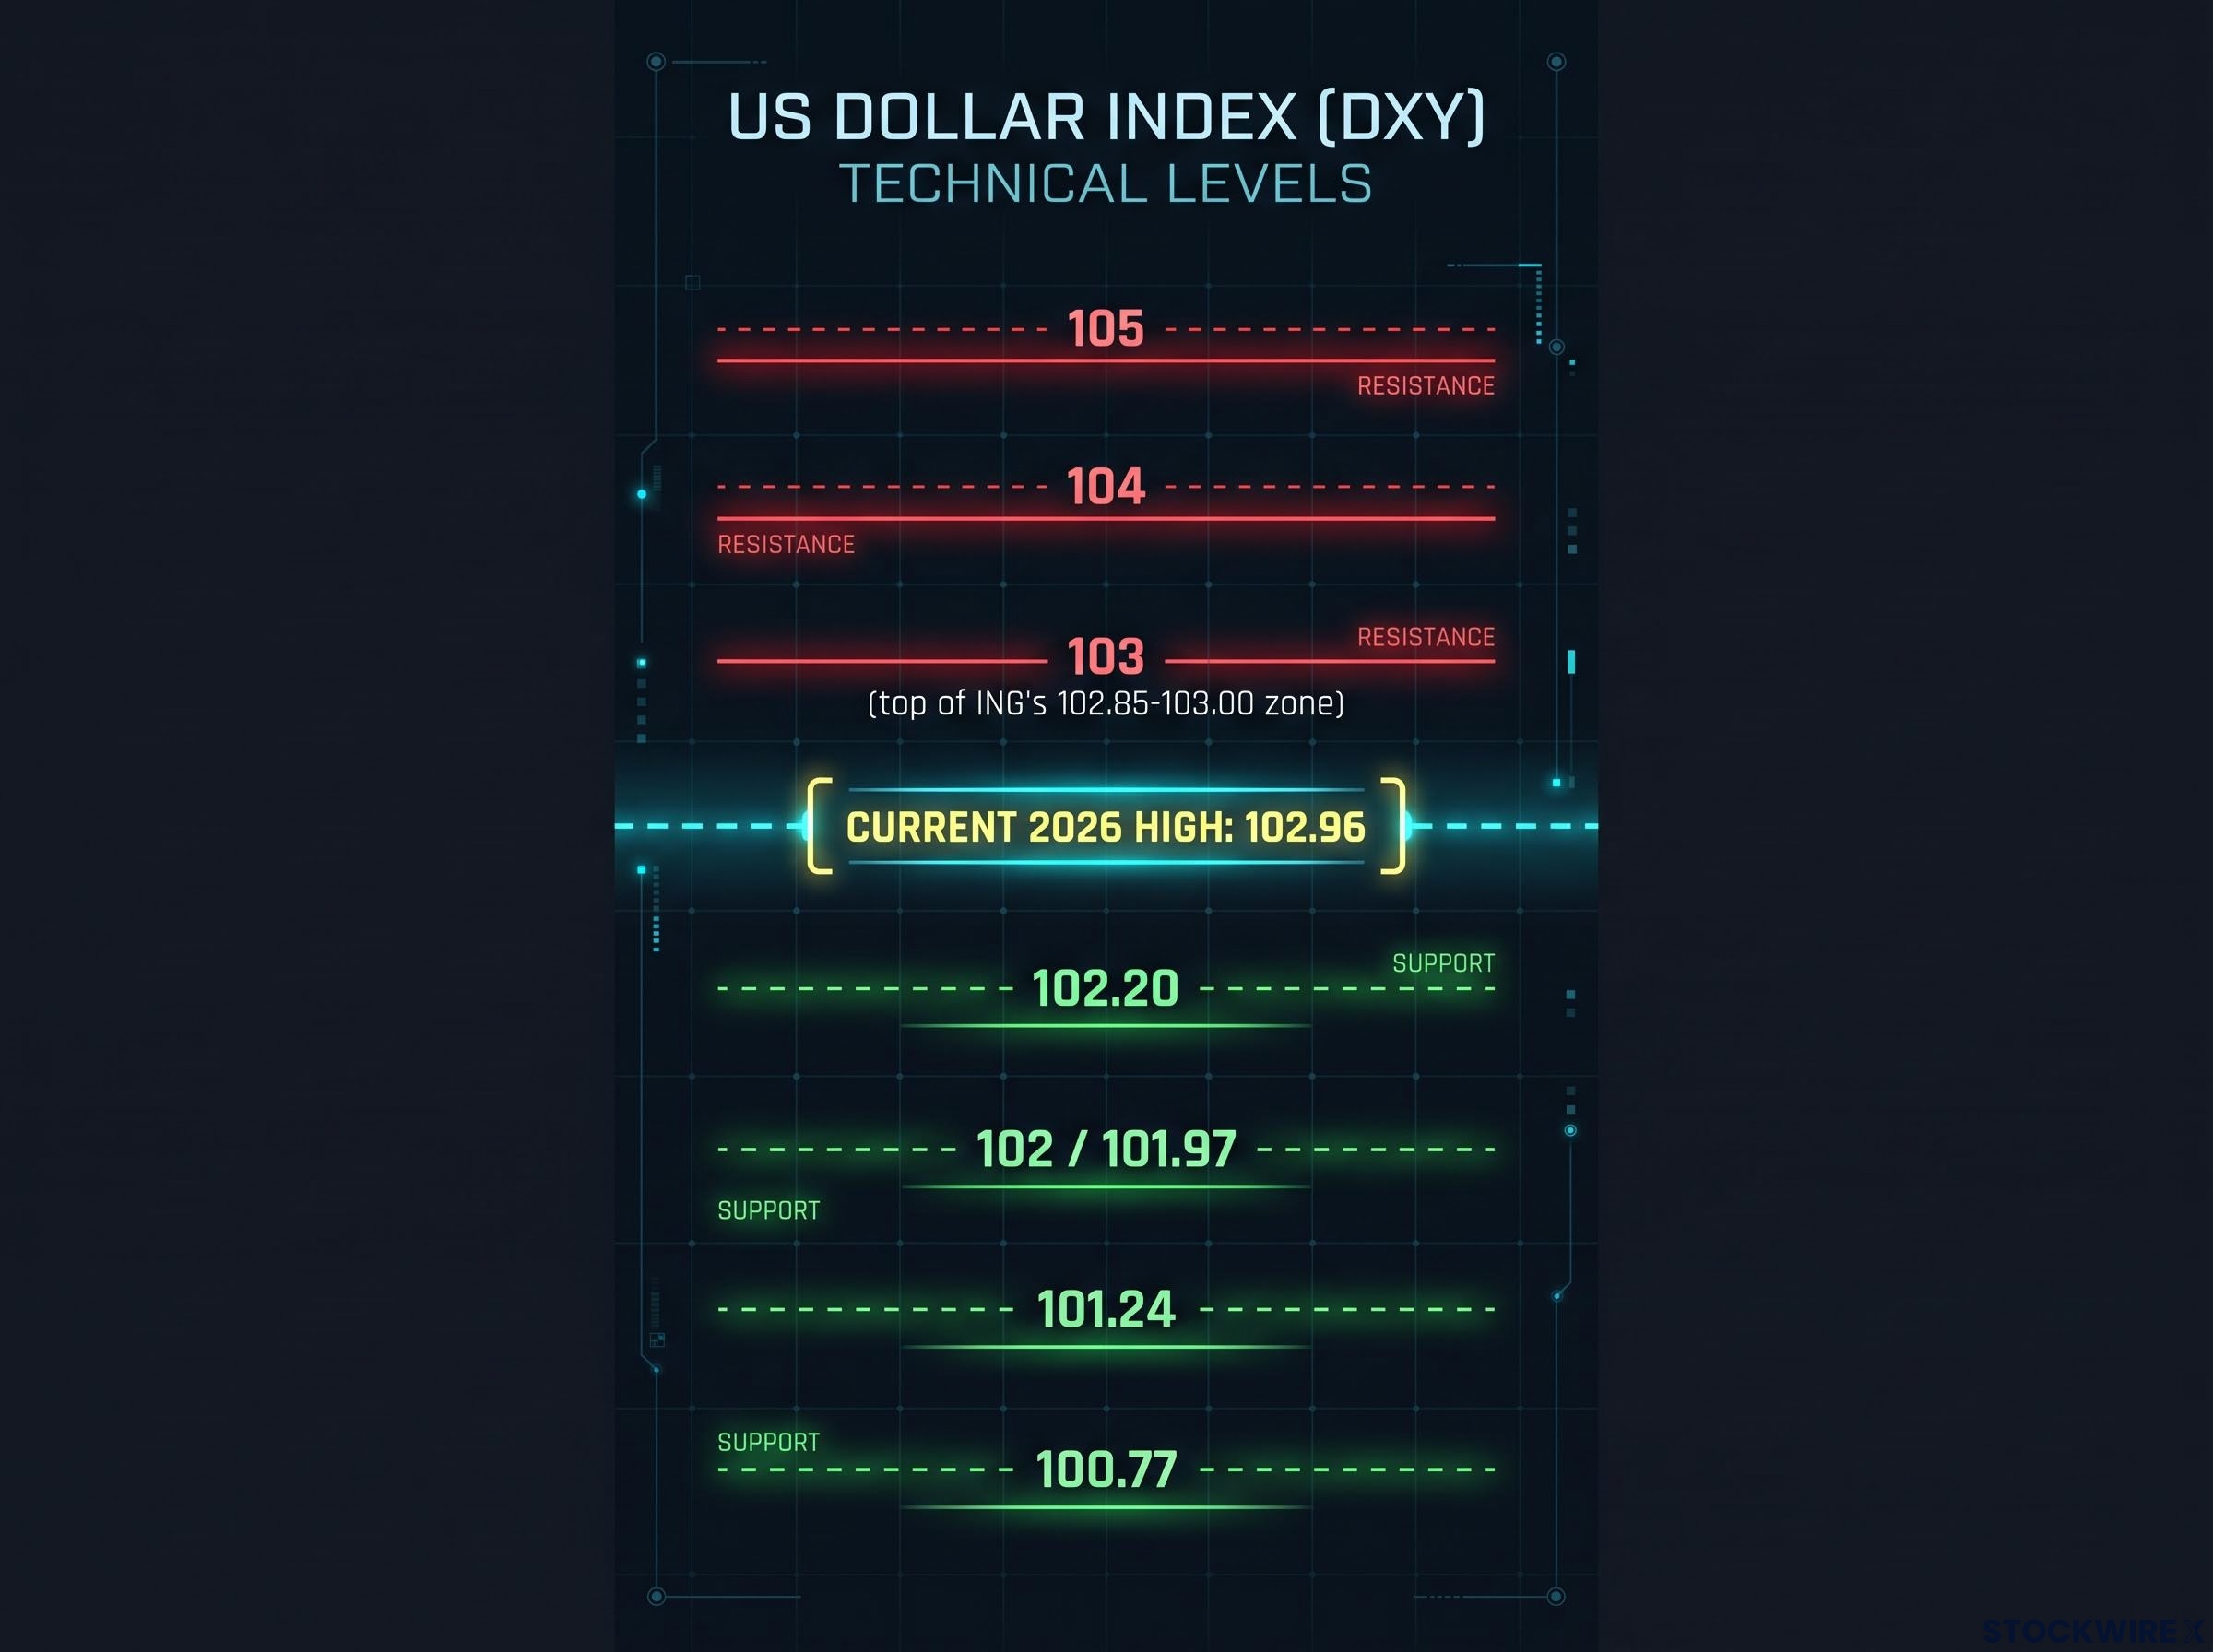
The US Dollar Index recently hit a 2026 high of 102.96, facing near-term resistance at 103 and 104.
Read together, an RSI of 63 says momentum has room before the index looks stretched. A close back below 102.20 would be your signal that the breakout is failing.
Levels guide risk, they do not predict outcomes Technical signals describe price behaviour, not causes. A CPI release, Fed communication, currency intervention or geopolitical shock can overwhelm any pattern.
What 2022 and the rate-hike cycles say about how long dollar strength lasts
History offers a sharper test than the chart. In September 2022, DXY hit a two-decade high of 111.63 after a 75 bp Fed hike, driven by the same chain now in play: hot inflation, rising front-end yields and a flattening curve. The data reactions that year ran both ways:
- Hot August 2022 CPI: DXY rose roughly 1.035%
- Hot September 2022 CPI: DXY rose about 0.44%
- Soft October 2022 CPI: DXY fell roughly 2.2%-2.4%, and the euro gained more than 2%
The single cool print erased more than the two hot ones had added. Strategists at the time blamed lower hike expectations, stretched valuations and crowded long-dollar positioning, and Scotiabank’s Shaun Osborne had warned that sustained gains were not guaranteed.
The longer pattern is just as uneasy. Across the previous four hiking cycles, the dollar rose an average of 2.2% in the 12 months before the first hike. In three of those four, it then fell an average of 1.4% between the first and final hike. Reuters has pointed out that much tightening gets priced before hikes arrive, and that a growth slowdown can pull forward expectations of easing.
The yen leg of the index has already shown its volatility: a Bank of Japan rate check forced carry-trade unwinds earlier this year and knocked the DXY down 0.58% in a single session.
| Risk or view | Source | Implication |
|---|---|---|
| Near-term strength near highs | ING | Test of the top of recent ranges |
| Euro rebound to 1.1200 (Q4 2026), 1.1800 (Q3 2027) | MUFG | Weighs on DXY given euro dominance |
| USD/JPY 160 hard to break | MUFG | Intervention risk caps the yen leg |
| Policy already priced | Reuters | Hot prints may fade faster |
| Growth slowdown | Reuters | Earlier easing bets undercut the dollar |
MUFG’s figures are forecasts. Past performance does not guarantee future results, and projections are subject to market conditions and various risk factors.
The key difference from 2022 is durability. The mechanism lifting the dollar now is the same one that eventually marked its peak, so treat the next CPI print as a two-way event: a cool reading could reverse gains as sharply as a hot one extended them.
What to watch between now and the 8-9 December Fed meeting
The rally rests on three supports: persistent inflation, a jump in front-end yields and a hike the market considers settled. Its limits are equally clear. The euro’s outsized weight, yen intervention risk and crowded positioning can each pull the index back.
Your watch list before the Fed decides:
- The next CPI and labour market releases
- Fed commentary on 25 versus 50 bp
- EUR/USD, which drives most of the index
- A daily close above 103, or a break below 102.20
If inflation keeps running hot without denting growth, ING’s case strengthens. If the data cools, 2022 suggests the unwind can be fast. Your exposure to foreign assets should reflect which of those you think is more likely.
This article is for informational purposes only and should not be considered financial advice. Investors should conduct their own research and consult with financial professionals before making investment decisions.