NZD/USD has climbed off 0.5580, its weakest level since April 2025, and the screen looks like a turn. The US Dollar Index, however, still sits close to an 18-month high, and the week’s biggest scheduled risk has not yet printed.
That gap matters. September US consumer price index (CPI) data lands tomorrow, Wednesday 14 October 2026, at the point where oil prices, Federal Reserve hike expectations and safe-haven flows all meet.
Treat the rebound as a trend change too early and a hot inflation reading could hand the move straight back. Dismiss it entirely and a soft print could leave you on the wrong side of a broader dollar retreat.
You will come away knowing which variables decide whether the bounce holds, which hourly levels confirm or reject it, and how each CPI scenario is likely to show up on the chart.
Why is the Kiwi bouncing while the dollar stays near an 18-month high?
On the screen, the session looked constructive. CNBC and FXStreet put NZD/USD at 0.5582 in Asian trading on 13 October, with FXStreet marking 0.5580 as the low. Later in the day, FXStreet’s Ghiles Guezout reported the pair near 0.5610, up roughly 0.42%.
The two spot figures likely reflect different times of day, so the 0.5580-0.5610 band is the zone that counts:
- 0.5580: intraday low, weakest since April 2025
- 0.5610: later-session rebound area
- 102.61: DXY peak on 12 October
- 102.26: DXY after its pullback, per Reuters
The DXY, a measure of the US dollar against a basket of six major currencies, did most of the work here.
Why the dollar retreated Reuters linked the slide from 102.61 to two forces: falling oil easing US inflation worries, and hopes the Middle East conflict stays contained.
Oil had jumped on 12 October, with WTI up 2.1%, before reversing the next day. The Kiwi itself brought little to the move; MUFG noted it was the weakest G10 currency in September.
What this tells you is that the bounce is borrowed from US-side conditions. A rally that depends on the dollar easing can reverse just as quickly once the dollar finds a reason to firm.
The bounce arrives after a six-week slide driven by oil, inflation fears and Fed hike pricing rather than New Zealand’s own economy, which is why the pair now responds more to US-side shifts than to domestic news.
When big ASX news breaks, our subscribers know first
How could the September US CPI print move NZD/USD?
Start with the chain the print sets in motion:
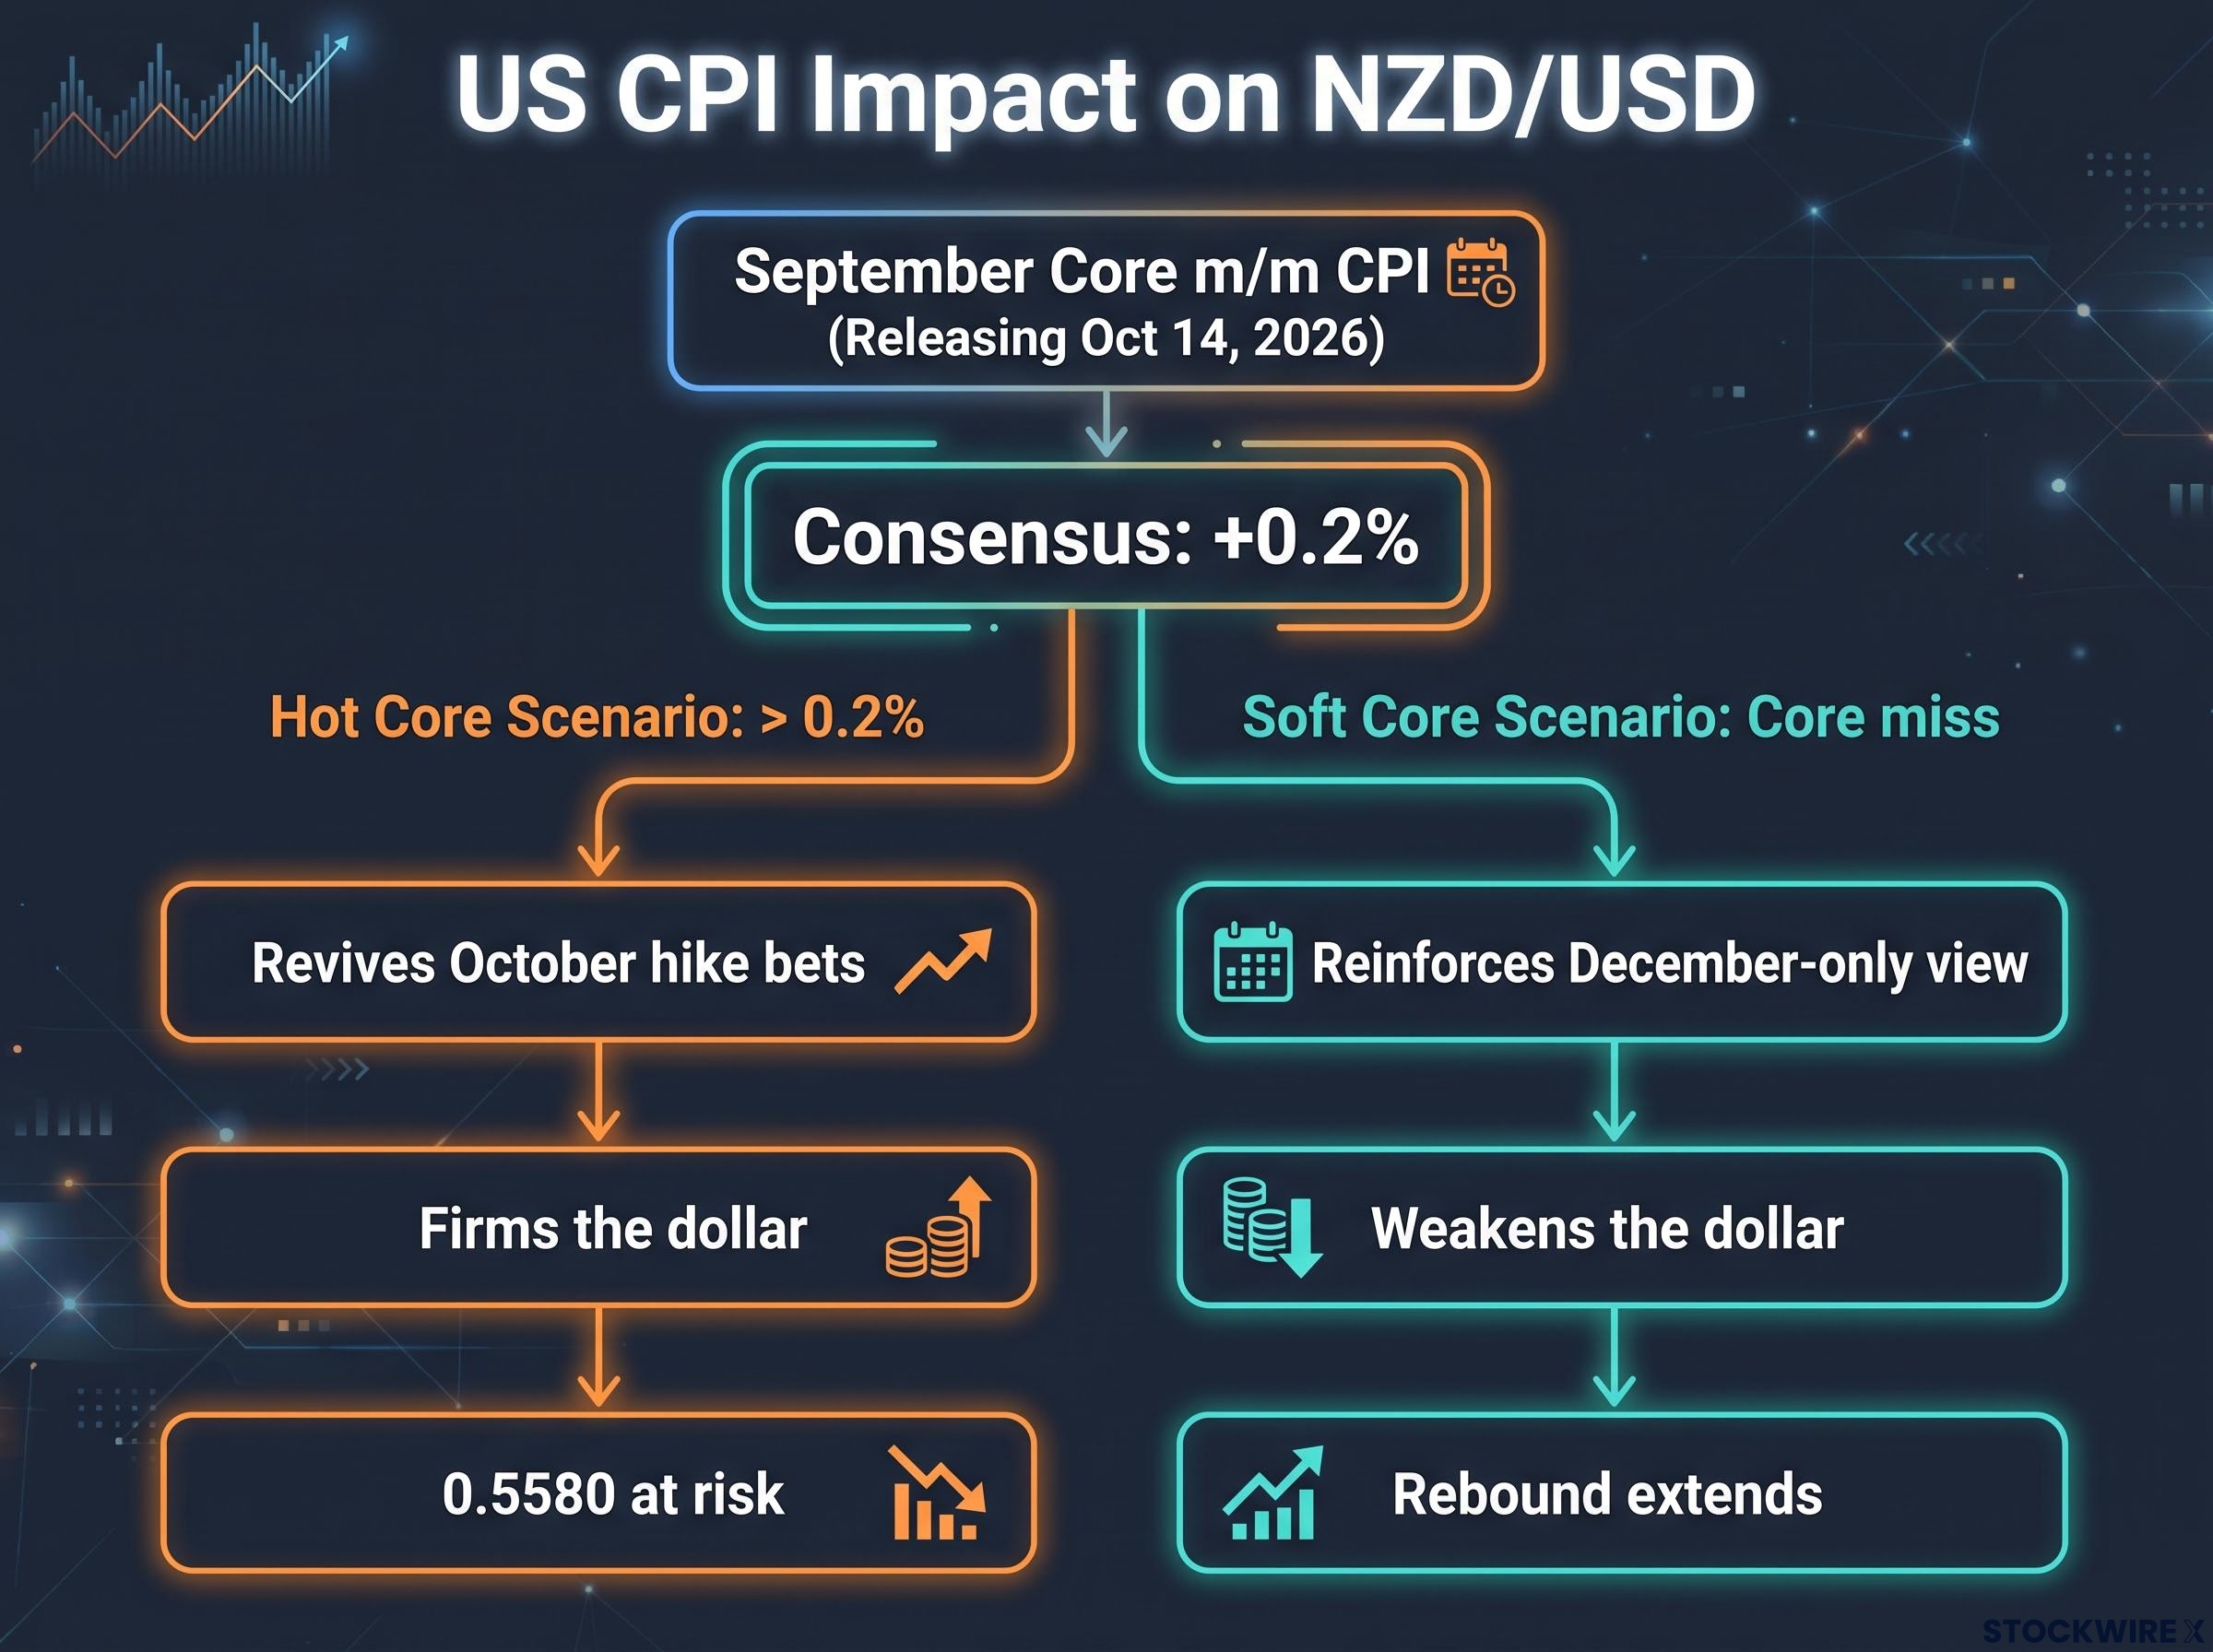
- Core CPI comes in stronger than expected.
- Markets raise the odds of a Fed rate hike.
- Treasury yields climb.
- The dollar strengthens on a wider rate advantage.
- NZD/USD falls.
A soft print runs the same chain in reverse. No verifiable historical event studies were found linking specific CPI surprises to this pair, so the framework rests on mechanism rather than precedent.
The detail that matters most is the split between headline inflation, which includes volatile energy prices, and core inflation, which strips out food and energy to show broader price pressure.
| Measure | Consensus | August prior | Why it matters |
|---|---|---|---|
| Headline m/m | +0.6% (Bloomberg); +0.5% (FactSet) | +0.4% | Lifted by gasoline, largely expected |
| Headline y/y | +3.6% (some 3.7%) | +3.4% | Energy-driven, less hawkish signal |
| Core m/m | +0.2% | +0.3% | The cleanest read on Fed pressure |
| Core y/y | +2.5% (Morningstar 2.4%) | +2.4% | Confirms or questions the trend |
Markets currently price roughly 17%-20% odds of a 25 basis point (0.25 percentage point) hike in October, and 81%-85% odds of at least one by December. That expectation drifted later after September payrolls added only 29,000 jobs.
Your focus belongs on core month-on-month. A gasoline-driven headline beat is mostly priced in; a core surprise is what could drag hike pricing forward.
Hot core scenario
A core reading above 0.2% could revive October hike bets, firm the dollar and put 0.5580 at risk.
Soft core scenario
A core miss would reinforce the December-only view, weaken the dollar and give the rebound room to extend.
What else could override the data: oil, geopolitics and the RBNZ?
CPI is not the only force in play, and the others do not always point the same way. Zelensky has accused Russia of breaching an energy ceasefire announced by President Trump, while the Saudi-led coalition in Yemen reported fresh Houthi drone and missile attacks. Headlines like these draw money into the dollar and away from risk-sensitive currencies such as the NZD.
Yet the opposite reading is just as live. If oil keeps falling and tensions ease, both the oil premium and safe-haven dollar positions could unwind at once, which favours the Kiwi.
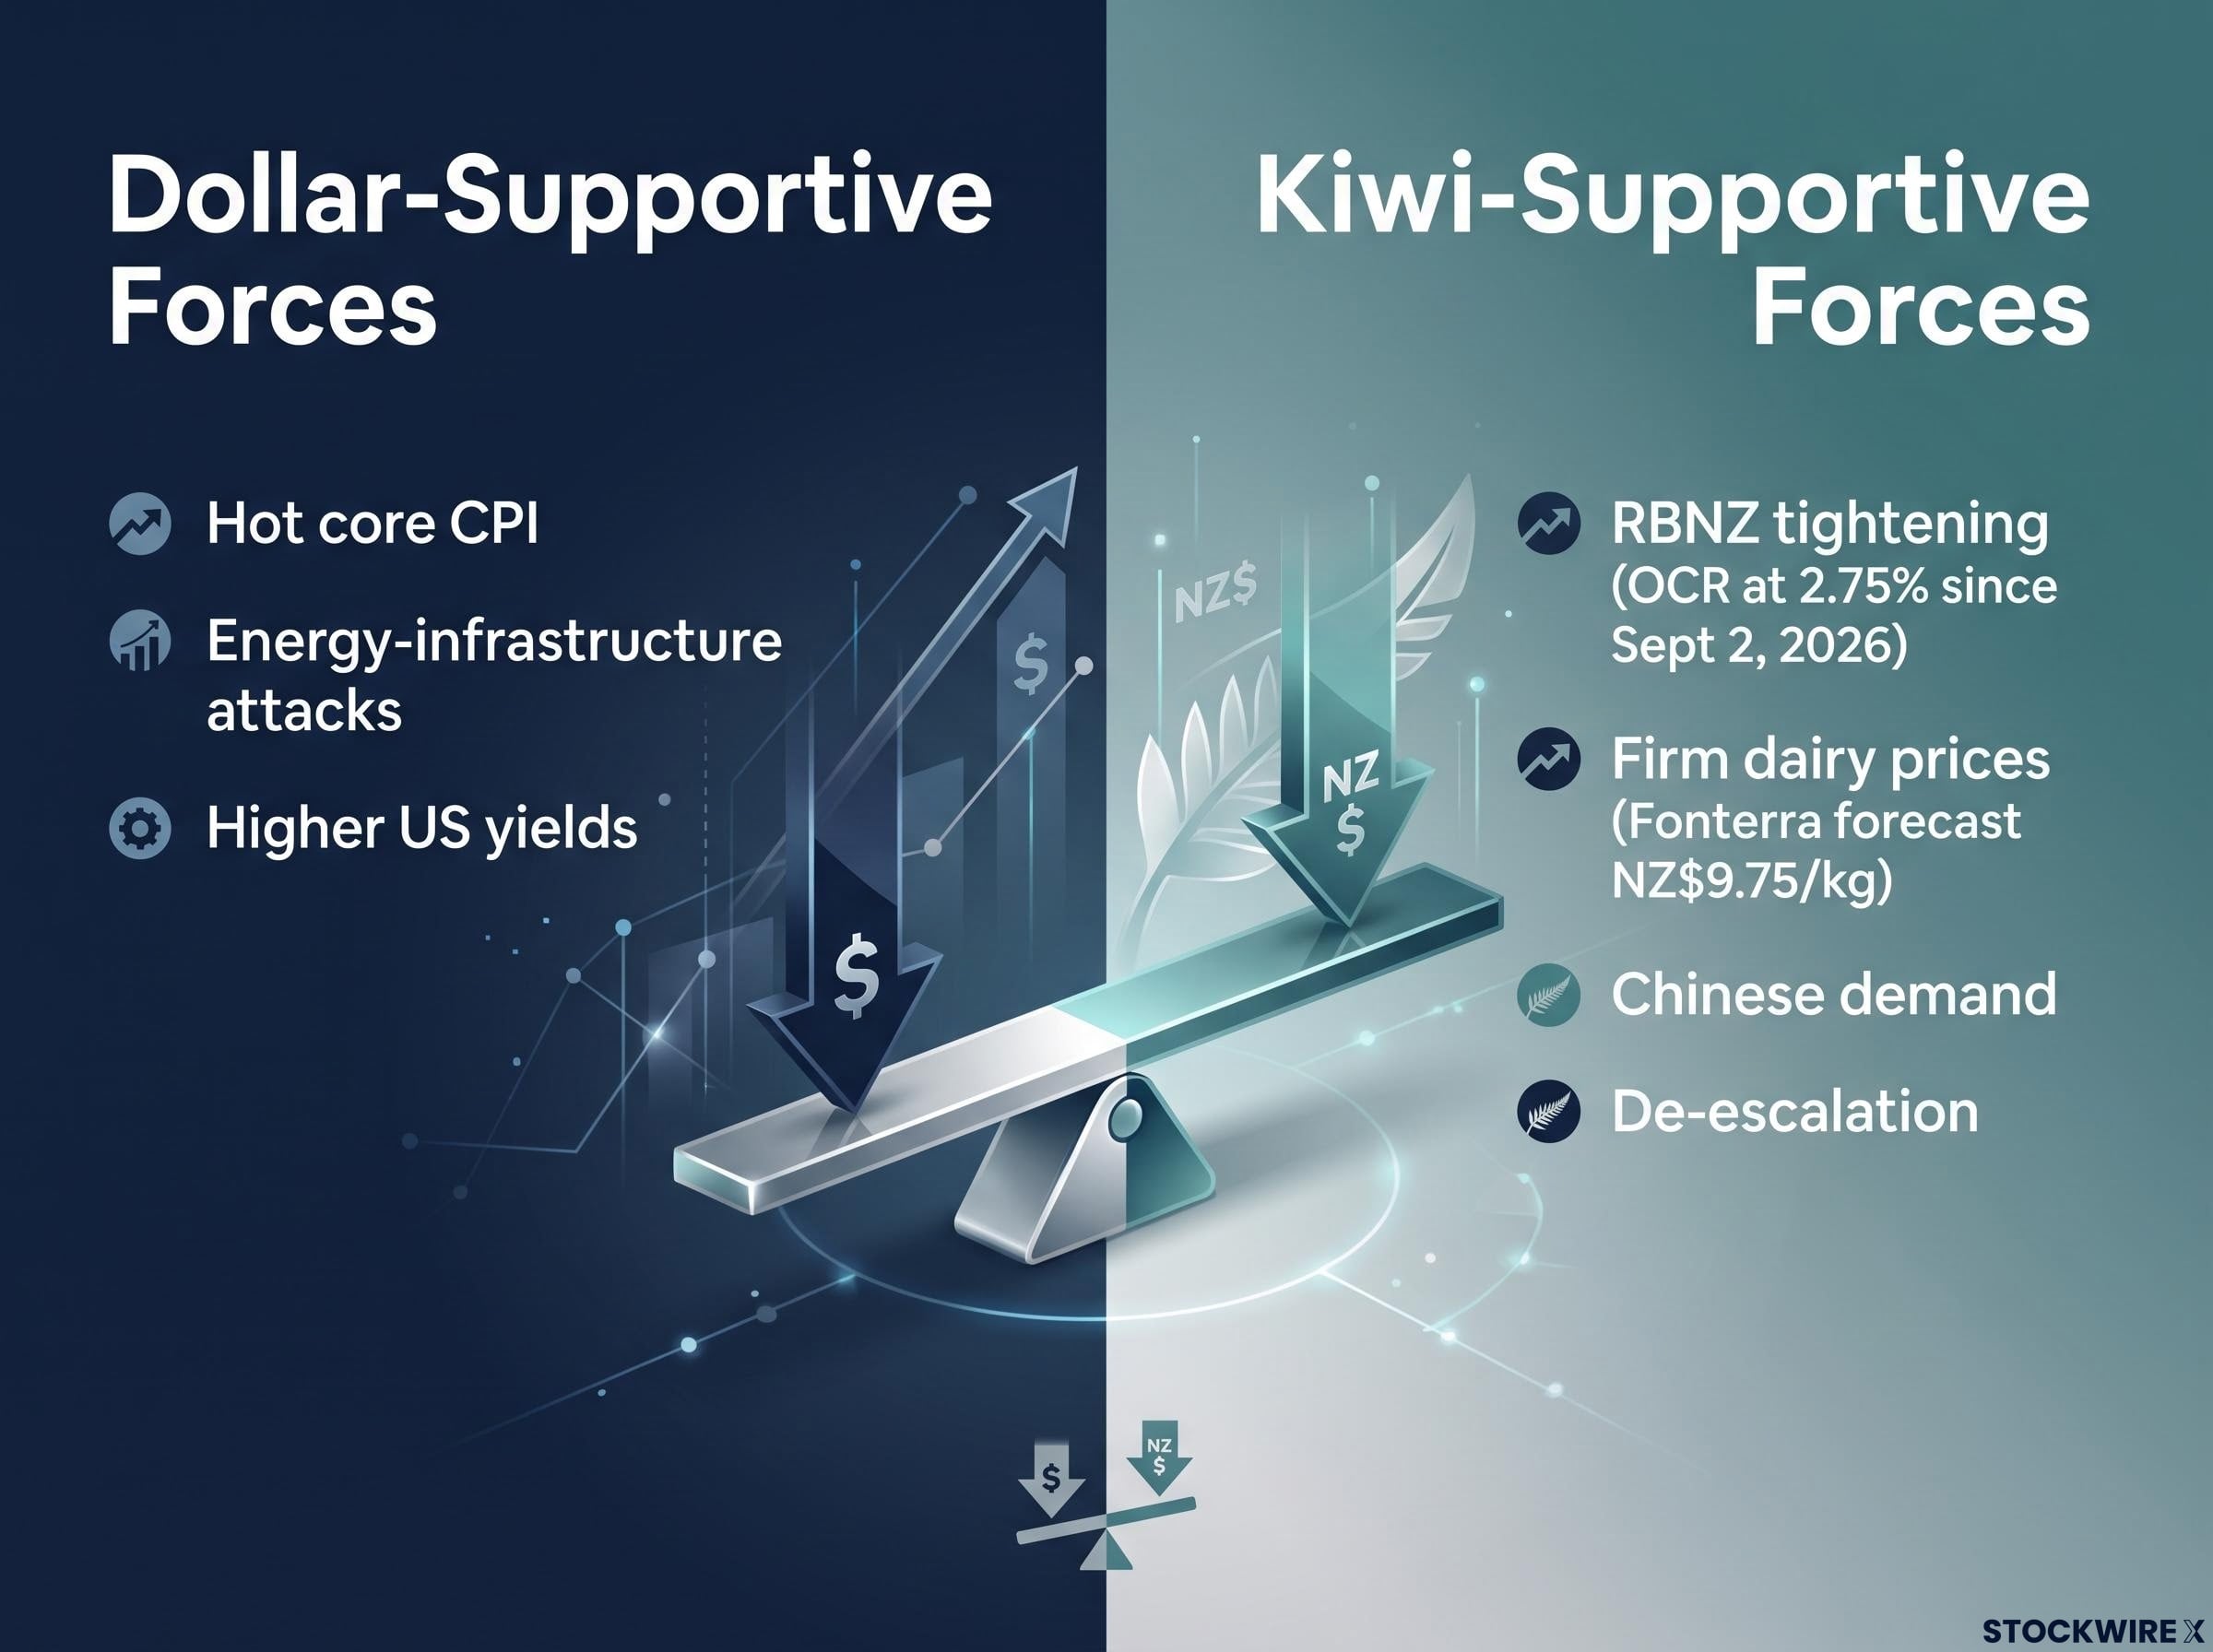
- Dollar-supportive: hot core CPI, energy-infrastructure attacks, higher US yields
- Kiwi-supportive: RBNZ tightening, firm dairy prices, Chinese demand, de-escalation
New Zealand has its own counterweights. The Reserve Bank of New Zealand (RBNZ) unanimously raised its official cash rate (OCR), the country’s benchmark interest rate, by 25 basis points to 2.75% on 2 September 2026. Westpac also reported milk-powder prices holding up better than expected, alongside a higher Fonterra 2026/27 milk-price forecast of NZ$9.75/kg.
The RBNZ’s projected rate path runs toward a terminal rate near 3.30% by early 2027, which helps explain why Kiwi support from tightening depends on inflation staying sticky enough to justify the December step.
| Institution | Date | View |
|---|---|---|
| Westpac | 12 Oct | RBNZ hold in October, hike in December, two more in early 2027; pair technically stretched |
| Westpac (secondary coverage) | 9-13 Oct | 0.61 in three months, 0.65 in 12, if the RBNZ turns more hawkish; not verified against the primary note |
| BNZ | 5-13 Oct | Support near 0.5580; positive medium-term bias |
| MUFG | 9-13 Oct | One more hike to 3.00%; pricing for a 4.00% OCR excessive |
| IC Markets | 13 Oct | Short-term bearish while USD firm; RBNZ and exports could support |
The takeaway for you: a geopolitical headline can swamp the CPI signal in either direction. Size any position around the release with room for volatility that has nothing to do with the data.
What do the hourly levels say about whether the rebound holds?
FXStreet’s hourly chart puts price near 0.5612, just above the 100-period simple moving average (SMA) at 0.5602 and the 200-period SMA at 0.5604. An SMA is the average closing price over a set number of periods. The relative strength index (RSI), a 0-100 momentum gauge, sits near 62: firm, not overbought.
| Level | Type | What it signals |
|---|---|---|
| 0.5735 | Resistance | Extended recovery, soft-CPI territory |
| 0.5686 | Resistance | Rebound gaining real traction |
| 0.5630 / 0.5649 | Resistance | First tests of follow-through |
| 0.5602-0.5604 | SMA support | Close below suggests the bounce is failing |
| 0.5580 | Support | Break fits the hot-core scenario |
| 0.5540 / 0.5490 | Support | Westpac flags 0.5490, a decade low, if 0.5580 gives way |
The SMAs are bunched tightly just under price, so the bullish bias is thin. An hourly close back below that cluster would tell you the rebound is losing its grip.
A caveat on hourly signals These levels guide short-term positioning only. They do not establish a durable fundamental floor.
Further out, Westpac sees 0.5800 by year-end as plausible, while BNZ targets a sustained move above 0.60 by early 2027.
Educational note: how inflation data, safe-haven flows and technicals interact in a major pair
Think of NZD/USD as a rope in a three-way tug of war. Because the pair measures how many US dollars one New Zealand dollar buys, any dollar strength mechanically pushes the price down.
The NZD is also risk-sensitive and tied to commodities. New Zealand relies heavily on dairy exports and Chinese demand, so worries about global growth tend to weigh on it.
Each force tends to dominate on a different timeframe:
- Economic data (weeks to months): sets direction, as this week’s CPI may
- Safe-haven flows (hours to days): add sudden shocks, as the oil and conflict headlines did
- Technical levels (minutes to hours): mark where reactions cluster, such as 0.5580
Check the data first, since it sets the trend. Then watch for shocks, and use levels to time your read. The same sequence works on almost any currency pair.
For readers wanting to read the dollar’s chart more confidently, our dedicated guide to DXY technical analysis explains how the 20-day EMA and RSI frame trend strength.
What the rebound proves, and what only tomorrow’s CPI can settle
The bounce off 0.5580 reflects a dollar pullback, not a change in regime. Whether it lasts depends on tomorrow’s core CPI reading, plus oil and the geopolitical tape.
Your checklist is short. Watch core month-on-month rather than the headline, hold the SMA cluster near 0.5602 as the line for the bounce, treat 0.5630 and 0.5686 as confirmation, and read a break of 0.5580 as the hot-core outcome.
Beyond this week, the December Fed and RBNZ meetings are the next structural tests of the pair’s direction.
This article is for informational purposes only and should not be considered financial advice. Investors should conduct their own research and consult with financial professionals before making investment decisions. Past performance does not guarantee future results. Financial projections are subject to market conditions and various risk factors.