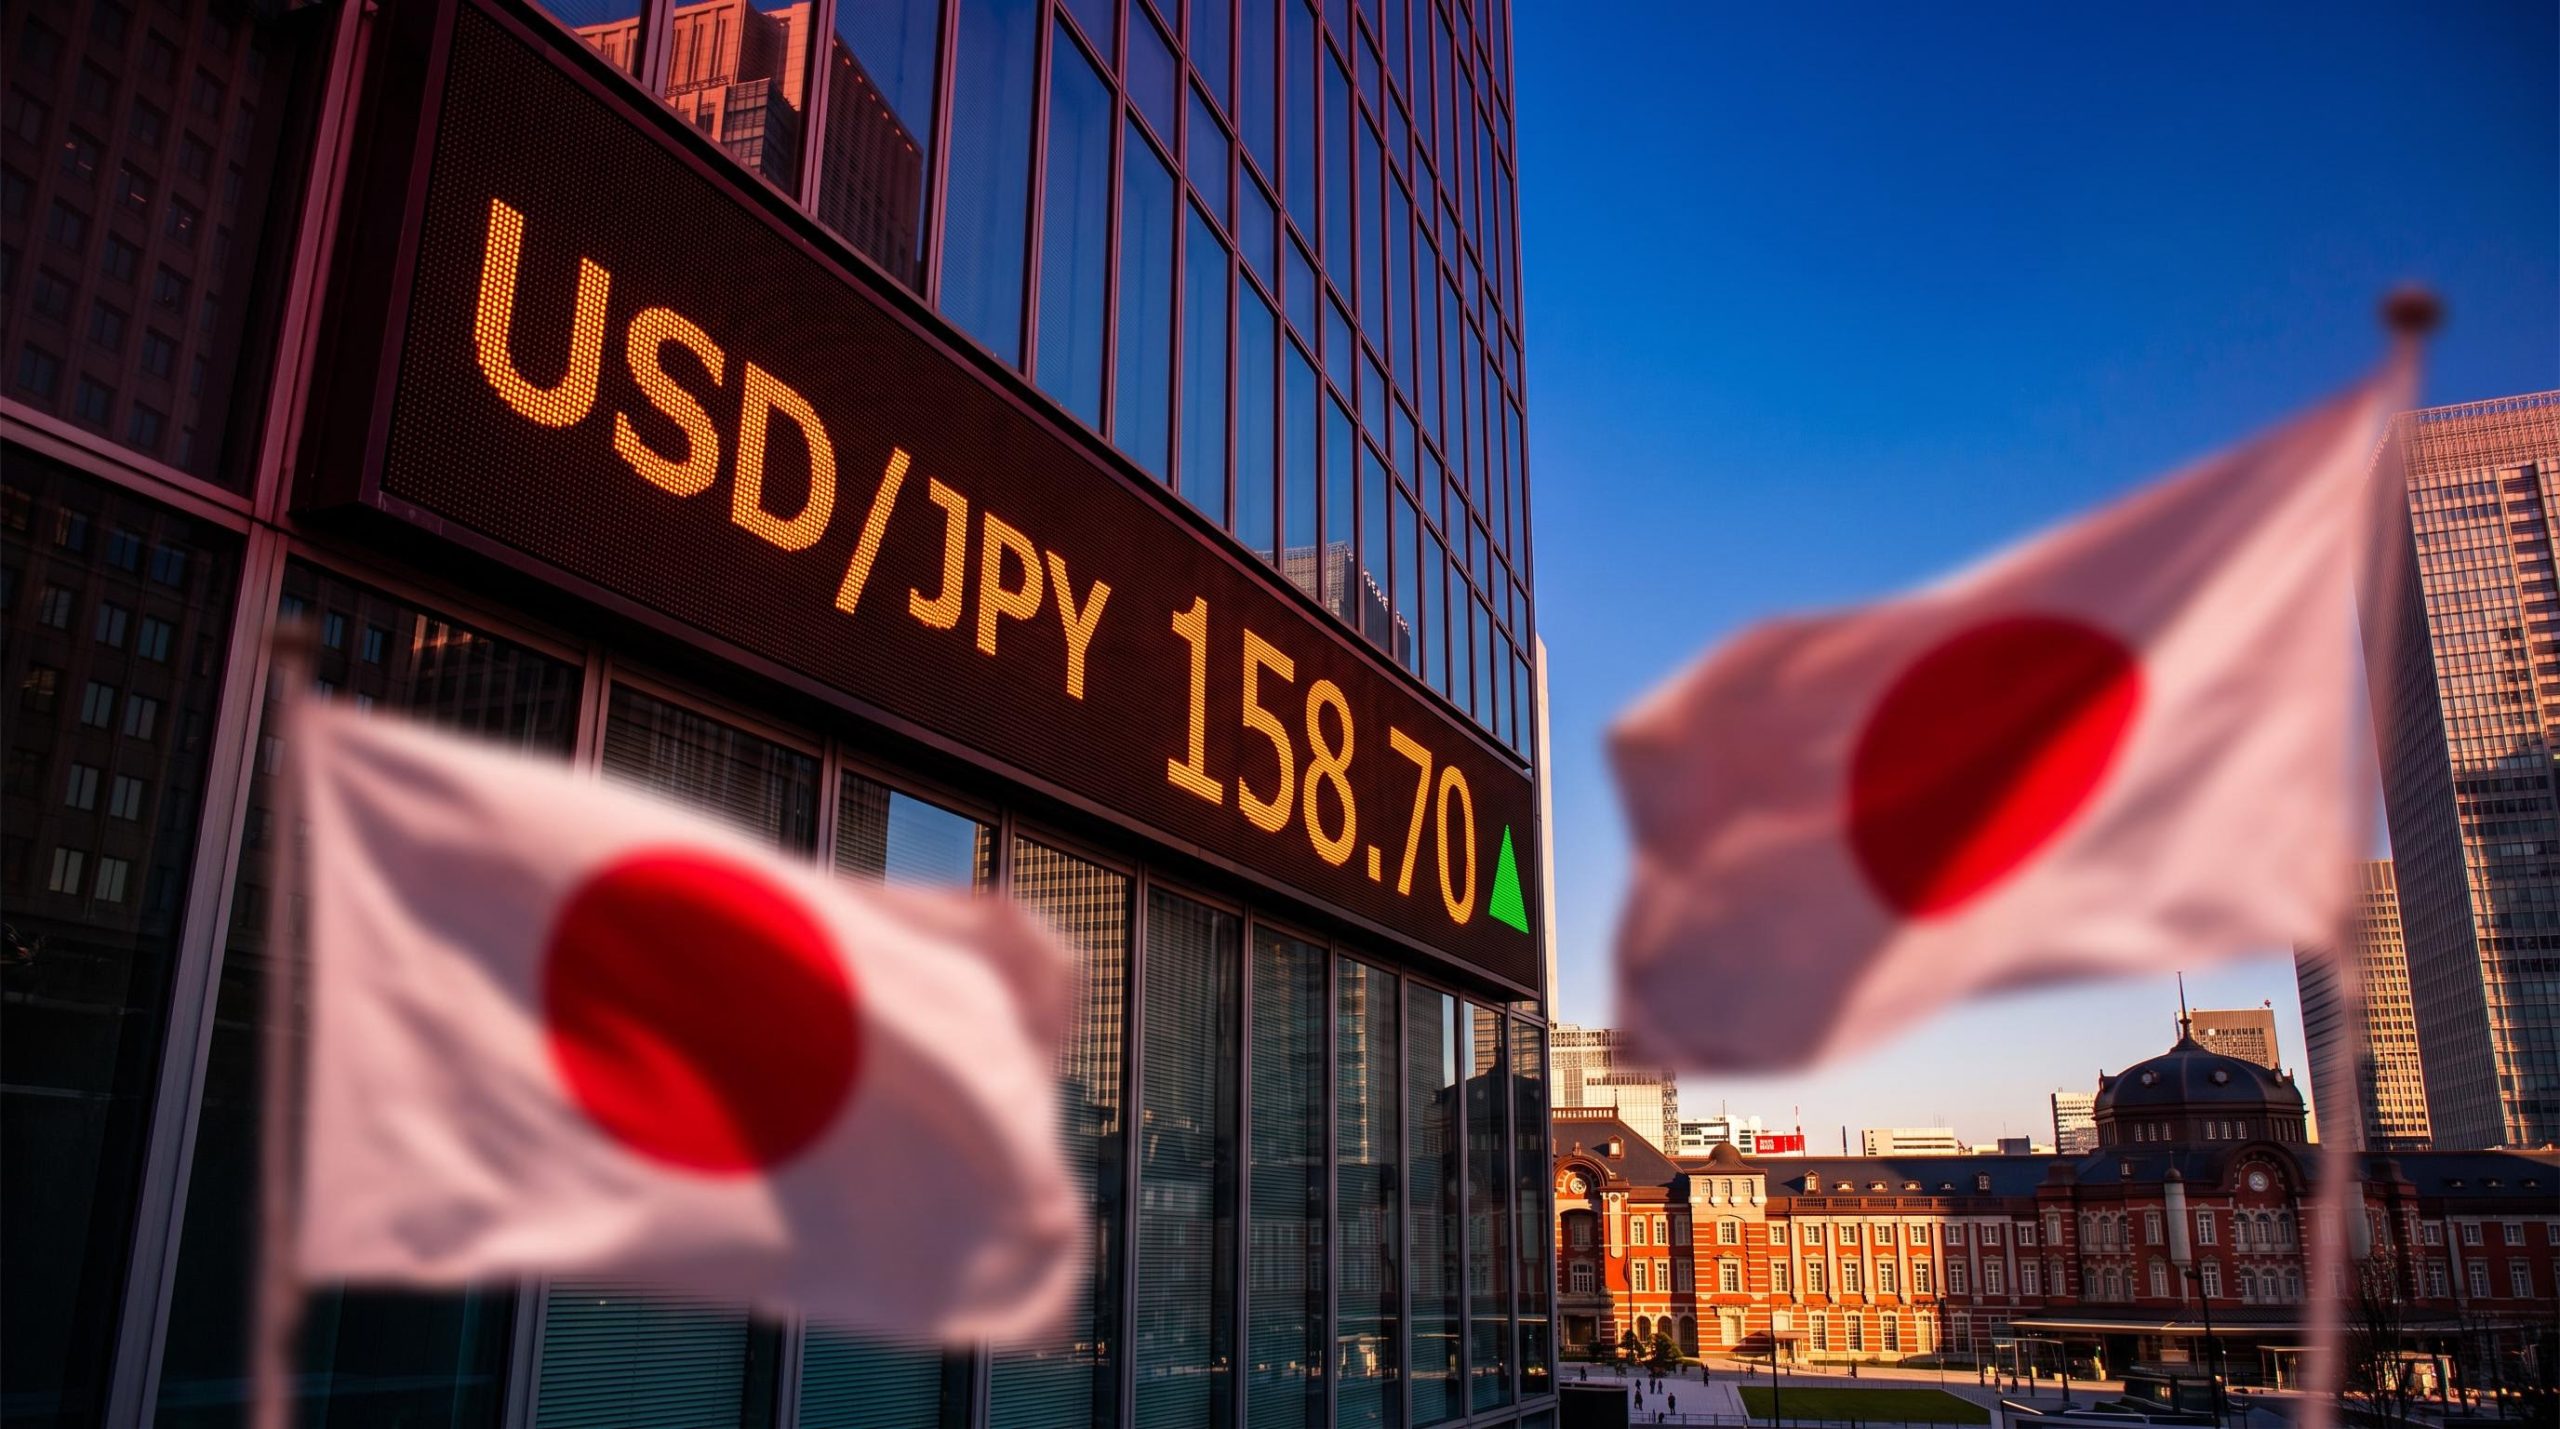
USD/JPY climbed about 0.28% to roughly 158.70 on Monday, 12 October 2026, bringing the pair within about 130 pips of the ¥160 level where Tokyo has stepped in before. A pip is the smallest standard price increment in a currency pair. The move came even as Japanese officials issued explicit warnings that they were ready to intervene.
For anyone weighing a USD/JPY forecast, the question is whether the pair is heading for ¥160 or has run too far, too fast.
The rally did not hold at its peak. A later FXStreet update the same day showed the pair below 158.50, which makes 158.70 the session high rather than a settled level.
You will come away with a clear read on which forces are pushing the pair higher, which ones are capping it, and which price levels are likely to decide the next move.
Why is USD/JPY rising: oil, a firm dollar and fiscal doubts?
Monday’s move came from three pressures arriving at once:
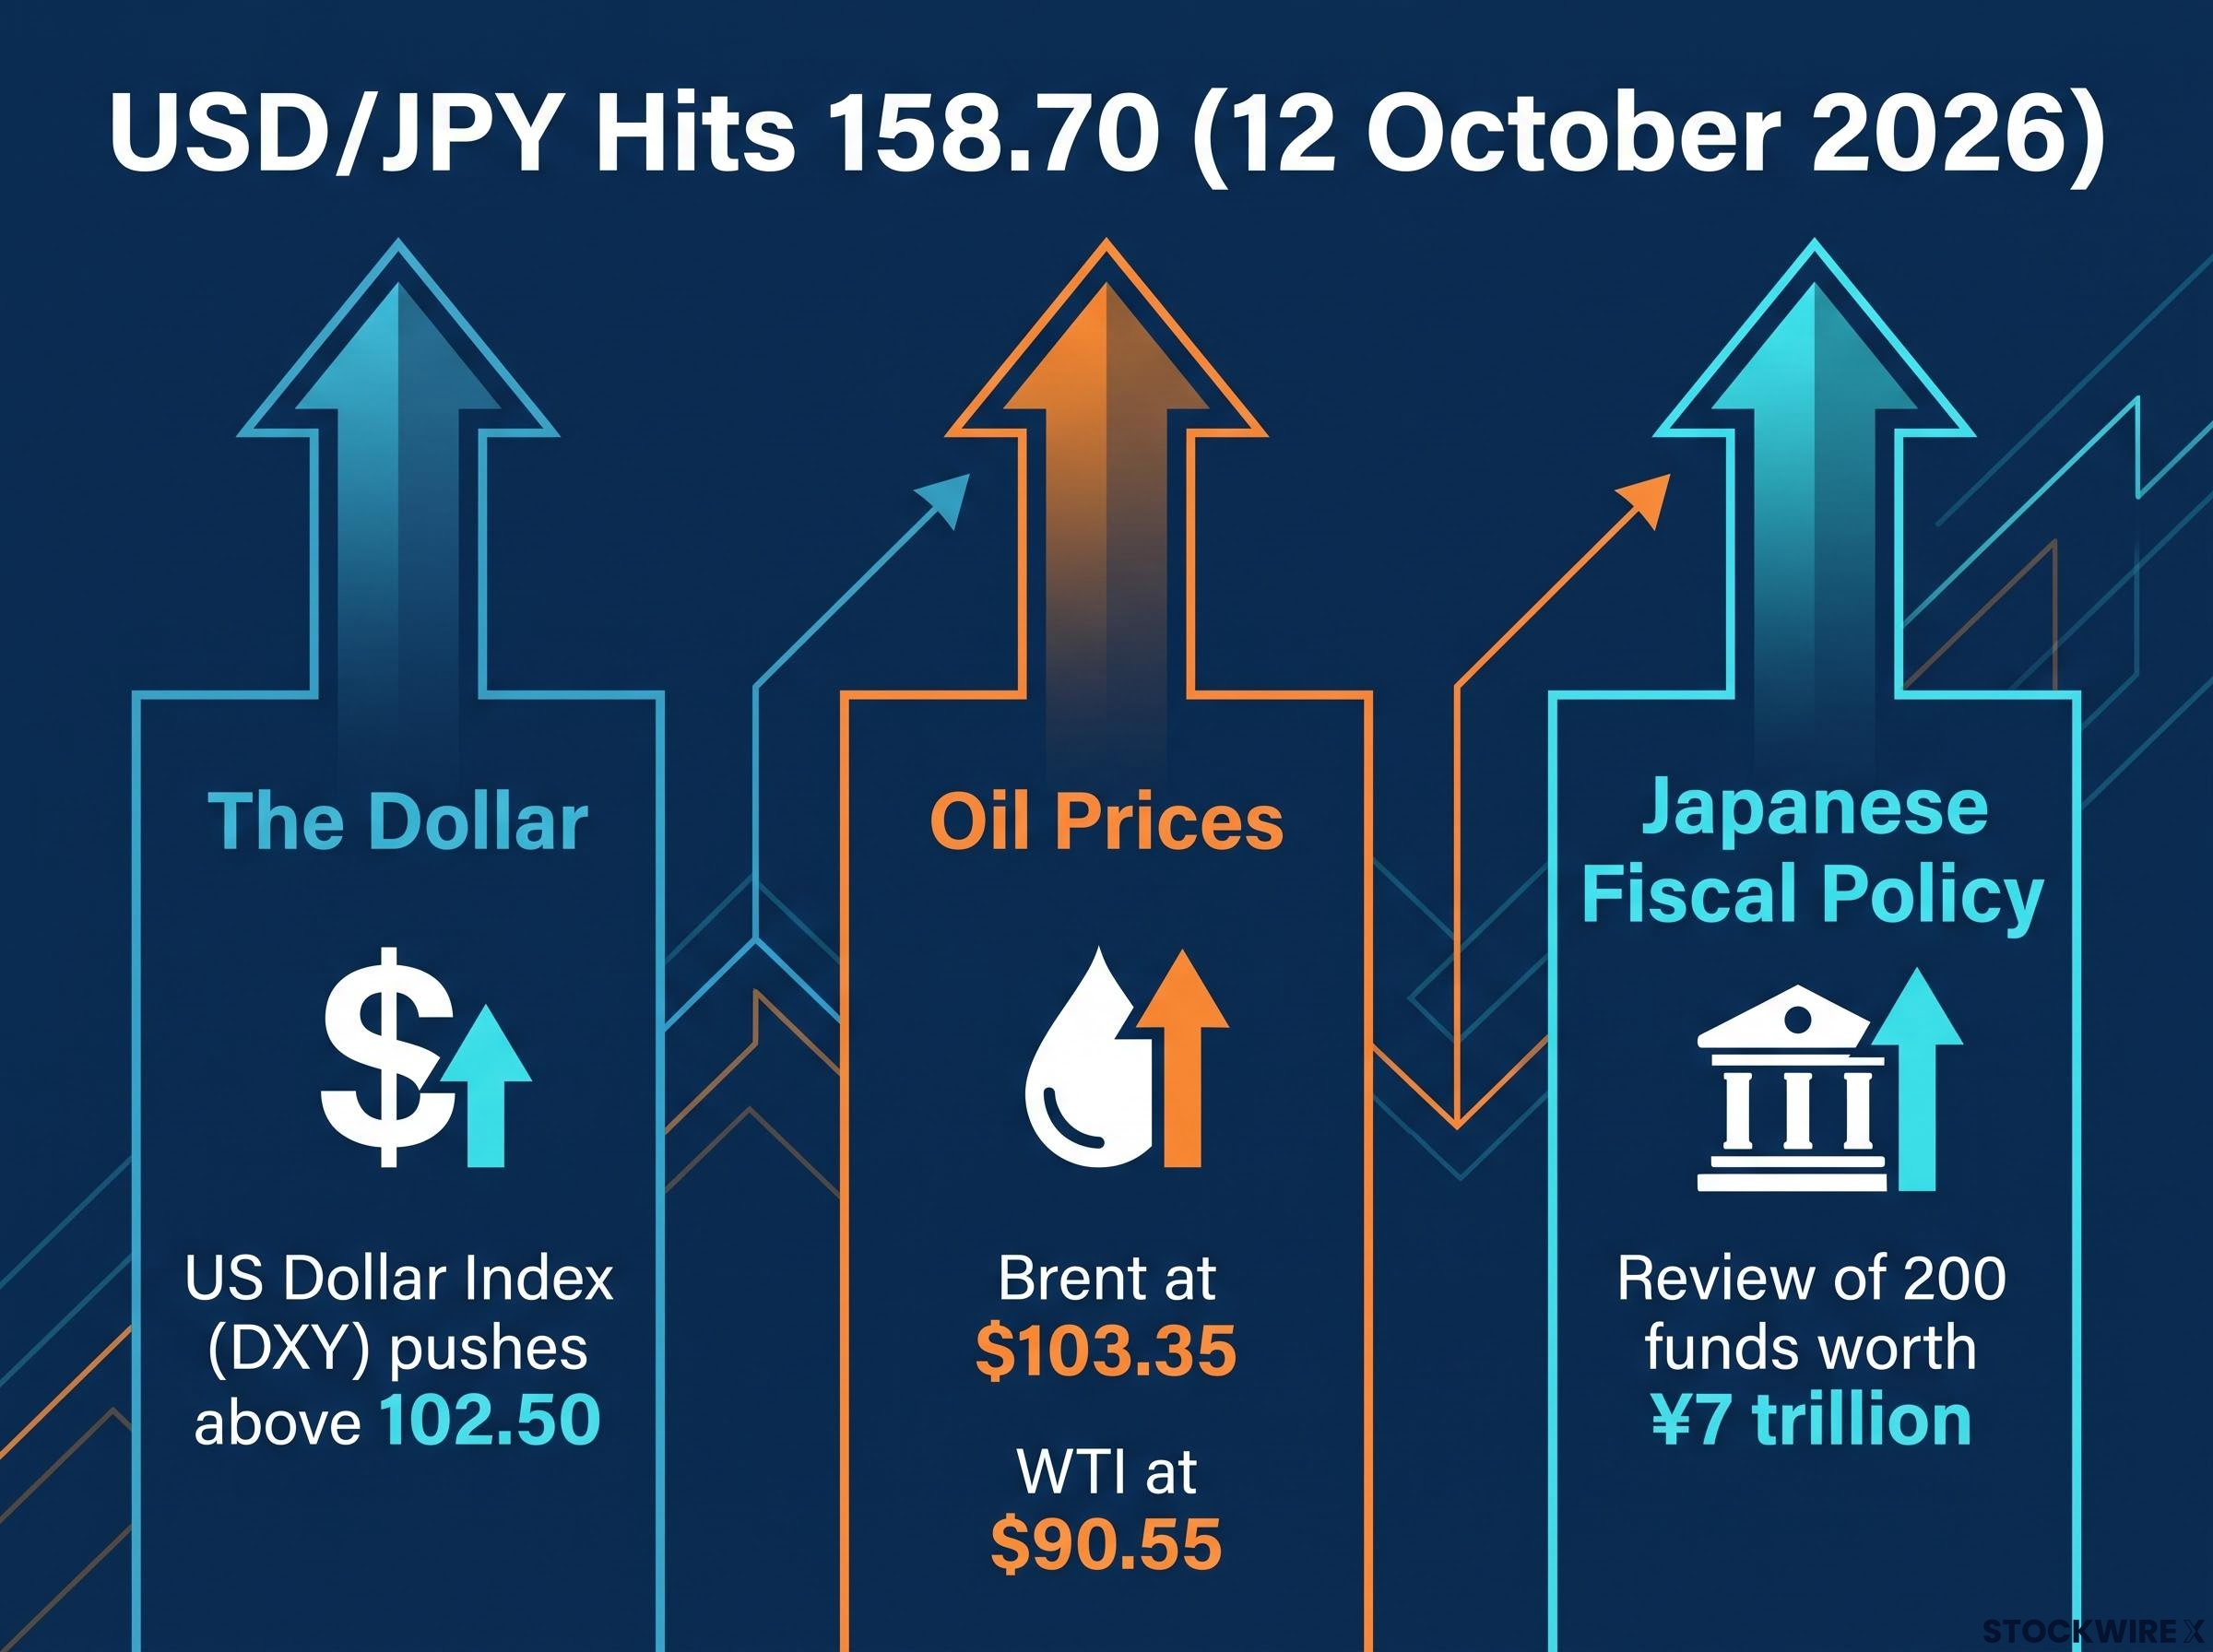
- The dollar: The US Dollar Index (DXY), which measures the dollar against a basket of major currencies, pushed above 102.50, its strongest level since April 2025, before easing to near 102.20.
- Oil: Attempts to pause strikes on energy infrastructure in Russia and Ukraine appeared to fail. Iran’s Revolutionary Guards also claimed a third supertanker attack in the Strait of Hormuz.
- Japanese fiscal policy: Investors are uneasy about Prime Minister Sanae Takaichi’s spending plans.
Why the warnings are struggling Reuters-linked analysis found that high US yields, safe-haven demand for the dollar and oil above $100 were overpowering Japanese official rhetoric.
How oil feeds into yen weakness
Japan imports most of its energy, and that energy is priced in dollars. When oil rises, importers sell yen to buy dollars, the trade balance weakens and Japan’s terms of trade worsen. Terms of trade compare what a country earns on its exports with what it pays for imports. Brent eased to $103.35 (down 1.31%) and WTI to $90.55 (down 1.42%) on Reuters figures. Both remain well above where they started before the surge.
The pressure is structural, so verbal warnings on their own are unlikely to turn the yen around while oil stays above $100. There is a counterpoint: a geopolitical shock can still trigger safe-haven buying of the yen if investors unwind carry trades. A carry trade involves borrowing in a low-yielding currency to invest in a higher-yielding one.
The carry trade remains central to the yen story, since borrowing cheap yen to buy dollar assets still pays, and an unwind would hit global equities, bonds and emerging markets at once, as August 2024 showed.
The Takaichi fiscal question
The concern is that food-consumption tax cuts and expansionary spending could add to Japan’s already high public debt. Takaichi says the measures will be funded without additional bonds, partly through a review of about 200 government-controlled funds worth roughly ¥7 trillion. Whether markets accept that will depend on the final size, funding and duration of the package.
Can BoJ rate hikes stop the yen’s slide?
A policy rate at a 31-year high sounds like enough to defend a currency. The market is not convinced.
The Bank of Japan (BoJ) raised rates by 25 basis points to 1.25% on 17 September, on a 7-2 vote. A basis point is one hundredth of a percentage point. Governor Kazuo Ueda has taken a pre-emptive tone and did not rule out consecutive hikes or a 50 bp move.
The gap in one line The policy rate sits at 1.25%, its highest in 31 years, yet markets price only about a 20-25% chance of a hike in October.
Overnight index swap (OIS) pricing, which reflects market bets on future central bank rates, implied about 20% odds on 1 October and roughly one in four by 5 October, according to InvestingLive. Nomura Research Institute sees a low probability of an October move. Bloomberg reported on 6 October that Ueda’s conditional language left those expectations intact.
Wages make the strongest case for tightening. Real cash earnings rose 1.5% year-on-year in August, the eighth straight monthly gain, and nominal base pay rose 3.8%, the Japan Times reported, citing the labour ministry.
| Supports yen recovery | Limits yen recovery |
|---|---|
| Rate at a 31-year high of 1.25% | US-Japan rate gap remains large |
| Pre-emptive stance on inflation | 25 bp steps may be too small |
| Sustained real wage gains | Hikes may come slower than priced |
| Higher JGB yields narrow the differential | Oil and fiscal doubts can offset tightening |
The takeaway for you is that BoJ hikes build a floor over months rather than capping USD/JPY this week. A surprise October hike is the exception, and it is a genuine risk for anyone holding long-dollar positions.
Even at 1.25%, the BoJ would need roughly ten more quarter-point moves to close the rate gap with the Fed, which is why the carry trade stays profitable and the yen’s structural weakness persists.
USD/JPY forecast: levels, ¥160 intervention risk and analyst views
Key levels traders are watching
On the one-hour chart, spot at 158.71 sits above the 100-period simple moving average (SMA), an average of recent prices, at 158.21, and the 200-period SMA at 158.03. The Relative Strength Index (RSI), a momentum gauge, is near 70, the point where a move is usually considered overbought. FXStreet noted that this technical section was written with AI assistance, so treat the levels as indicative.
| Level | Type | What to watch |
|---|---|---|
| 159.00 | Resistance | A sustained break opens the path towards ¥160 |
| 158.45 | Support | First test if momentum fades |
| 157.85 | Support | Sits just below the moving averages |
| 157.00 | Support | Deeper pullback, with 156.50 and 155.50 below |
Intervention history and analyst views
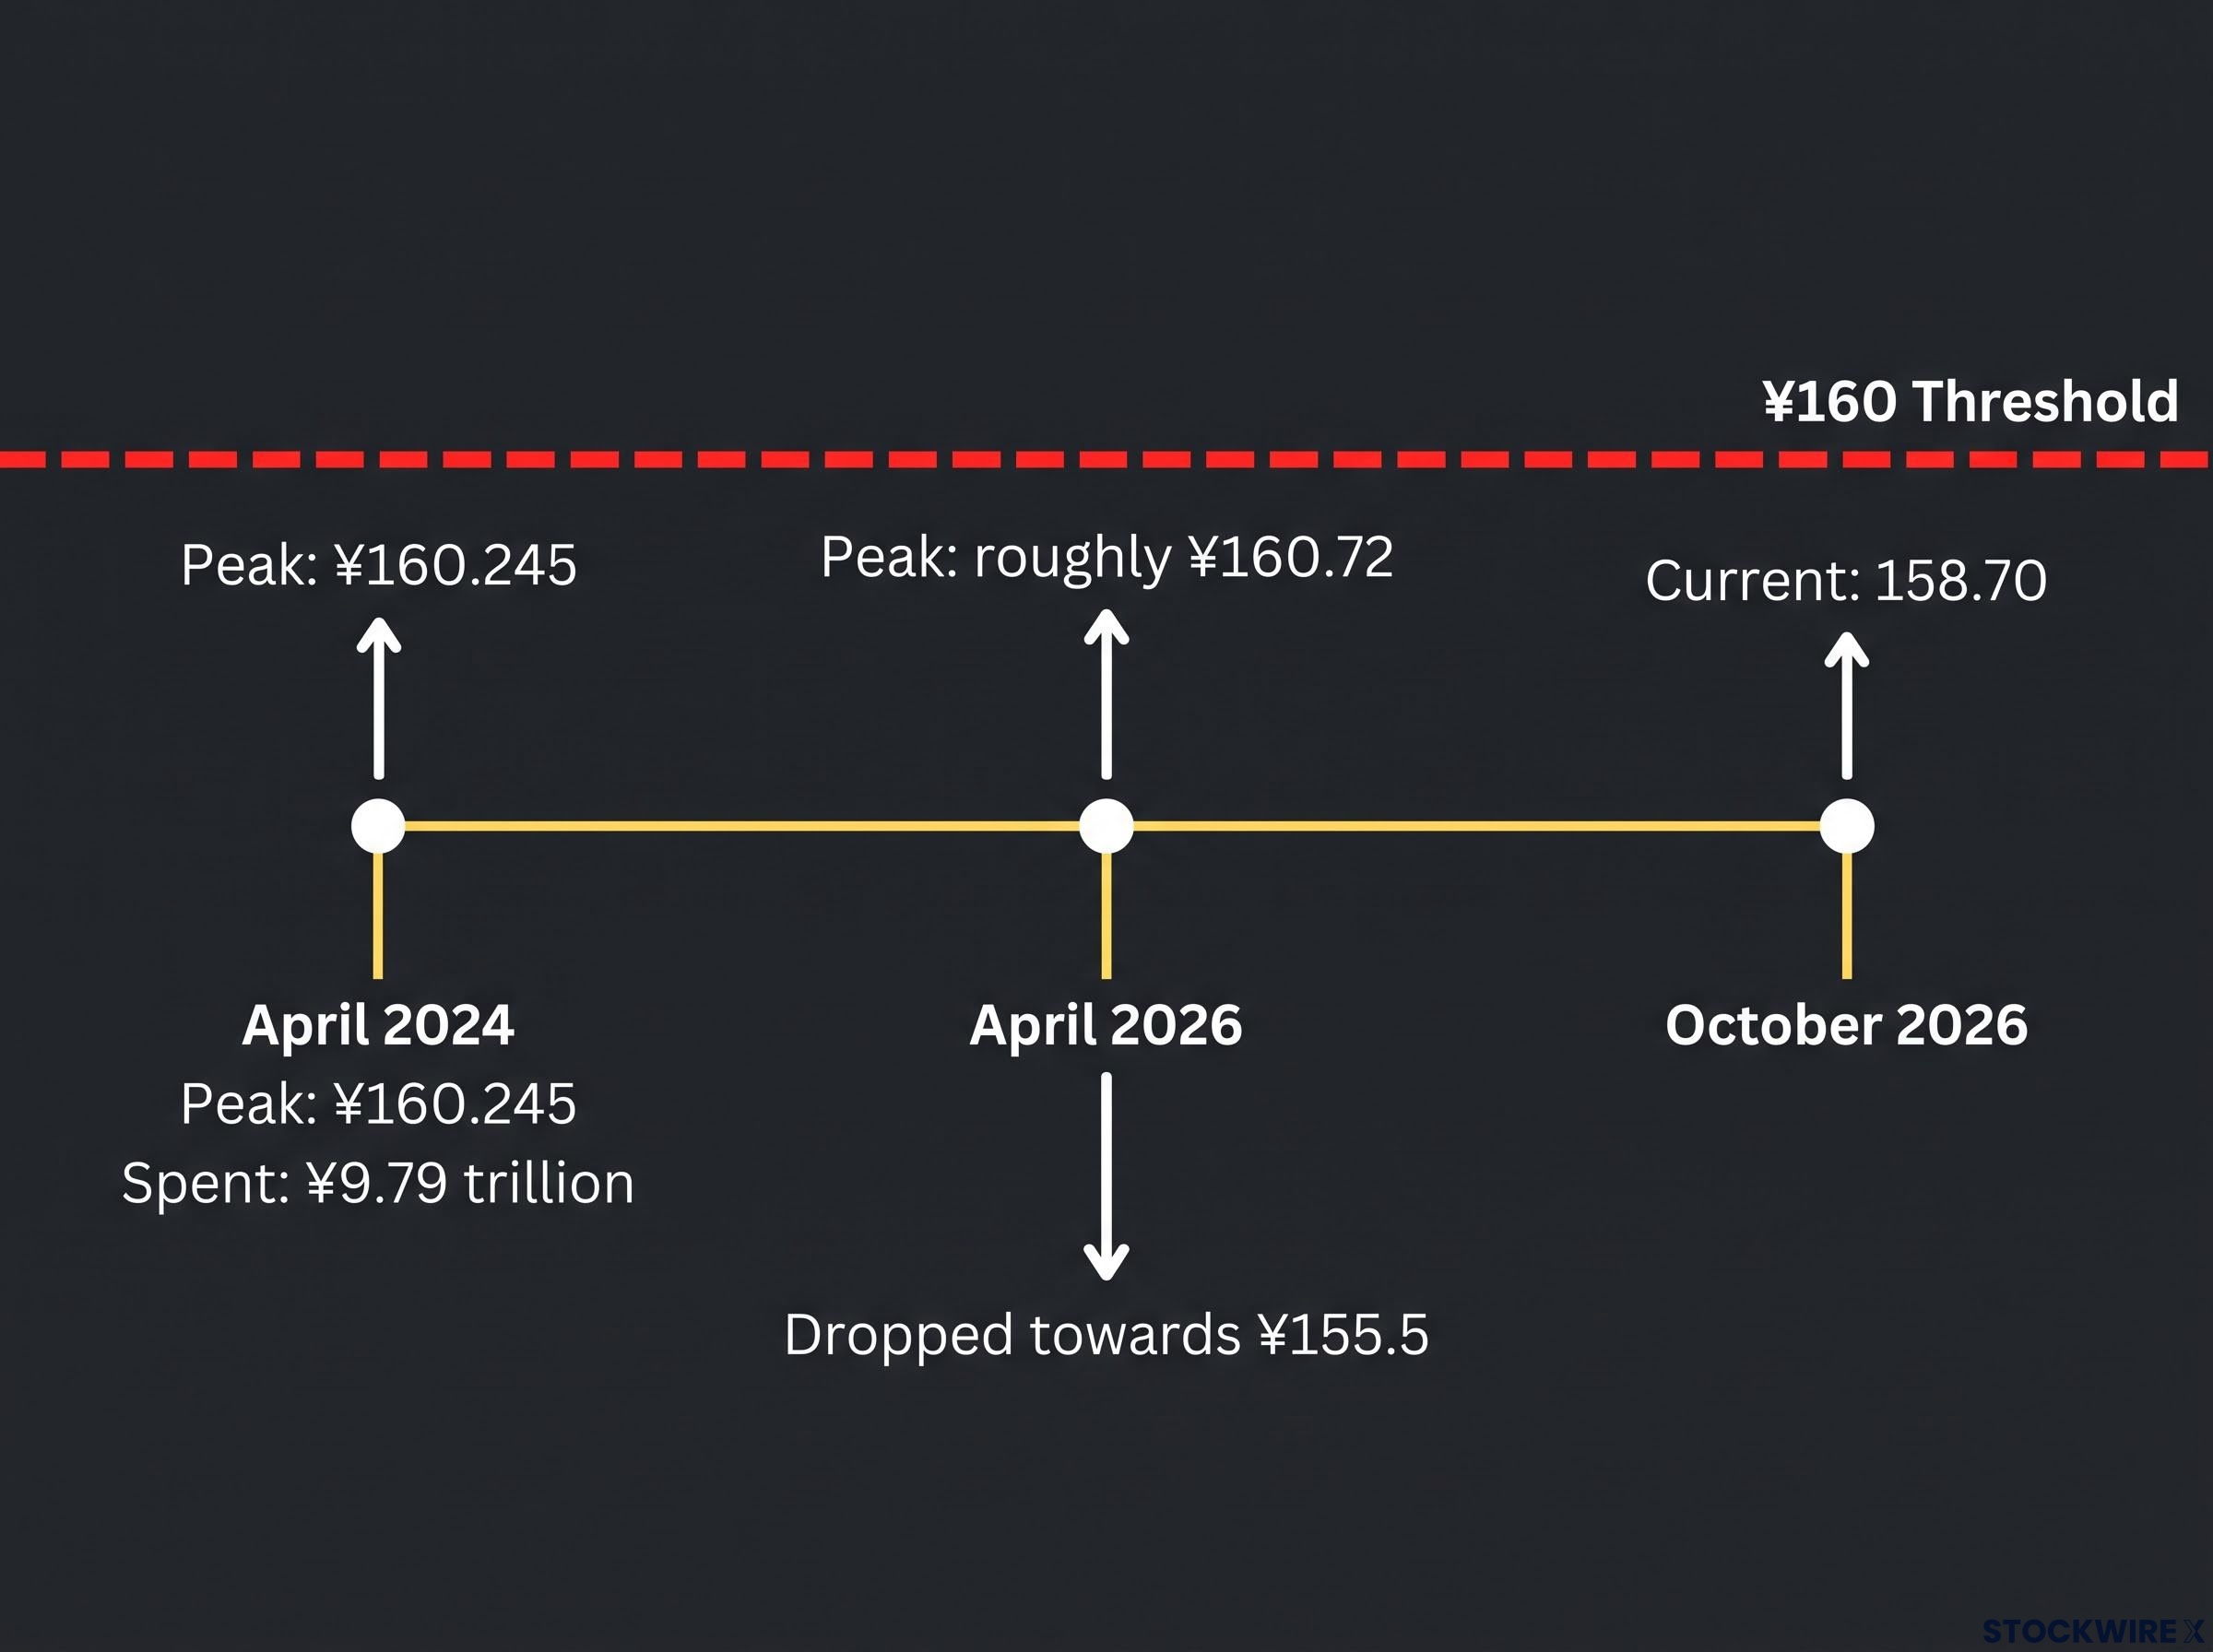
The technical ceiling and the policy line are in the same place. Finance Minister Satsuki Katayama has said Japan and the US are prepared to act decisively against excessive volatility, and top currency diplomat Atsushi Mimura has declined to rule out intervention. In April 2024 the yen hit ¥160.245, and Japan spent about ¥9.79 trillion defending it. In April 2026 the pair reached roughly ¥160.72 before dropping towards ¥155.5. On both occasions intervention brought temporary relief, but the trend held because the rate gap between the US and Japan did not change.
Tokyo’s reaction function appears to hinge on the velocity of the move rather than the absolute price level, so a slow grind towards 160 may draw a different response than a sudden spike.
Analysts disagree on which side wins:
- Reuters analysis (October 2026): USD/JPY may have peaked below ¥160, with risks tilting towards yen strength.
- MUFG (5 October): A move above ¥160 would likely bring stronger warnings. MUFG modestly lowered its forecast range.
- Nomura (6 October): Year-end target of ¥165.5, the most bearish yen view in the surveyed panel.
The risk runs both ways. A break above 159.00 is possible, but long-dollar positions are crowded, and a sharp reversal could erase those gains quickly. That makes position sizing more important than calling the direction.
What the next move hinges on, and what would change the picture
Oil, US yields and fiscal doubts are pushing the pair higher, while BoJ tightening and intervention risk act as the brakes. ¥160 is where those forces meet. Three variables are likely to decide which side gives way:
- Oil prices and developments in the Middle East and Ukraine
- US economic data and expectations for the Federal Reserve’s rate path
- The BoJ’s October and December meetings, along with the details of Takaichi’s budget
If oil eases or US yields fall, the case for a pullback strengthens. If neither happens, Tokyo’s resolve becomes the main test.
This article is for informational purposes only and should not be considered financial advice. Investors should conduct their own research and consult with financial professionals before making investment decisions. Past performance does not guarantee future results. Forecasts are speculative and subject to change based on market developments.