AUD/USD is trading near 0.6985, a whisker under the 0.70 mark, after a soft US consumer sentiment reading knocked the greenback lower. The bounce looks encouraging until you check the chart: the pair was sitting in the 0.71-0.72 area in mid-to-late September 2026, and a single weaker dollar day has not reversed that slide.
That raises a fair question for anyone watching the AUD/USD forecast. Is this a turn, or just noise inside a downtrend?
The timing matters. The Reserve Bank of Australia (RBA) releases its meeting minutes on Tuesday, the US Federal Reserve is still viewed as hawkish, and iron ore prices are hovering near multi-year lows.
Each of those forces pulls the pair in a different direction. Here is a framework for reading them: the rate signals that carry weight, the levels that frame the range, and the scenarios that would change the picture before and after the minutes land.
Why are rate bets pulling AUD/USD in opposite directions?
On paper, Friday’s data looked like good news for the Australian dollar. The University of Michigan consumer sentiment index fell to 46.3 in its preliminary October reading, down from 48.1 in September and below the 47.6 forecast.
A gloomier American consumer usually means a softer dollar. This time, the detail beneath the headline told a different story.
Inflation expectations rose. One-year expectations climbed to 4.7% and five-to-ten-year expectations reached 3.5%, both slightly above the prior month. Inflation expectations are what households think prices will do in future, and the Fed watches them closely because they can become self-fulfilling. Rising expectations give the Fed a reason to keep tightening, whatever consumers feel about the economy.
The September Fed rate hike to 3.75%-4.00% arrived without forward guidance, which is why inflation prints and expectations data now carry outsized weight in repricing the path of US policy.
Markets have absorbed that message. CME FedWatch shows the odds of a Fed hike of at least 25 basis points this month easing to 17.7%, from 24.4% a week earlier, but the probability of a December hike sits at 84.1%. Across the Pacific, money markets price only about a 20% chance of an RBA hike in November, according to LSEG data cited by TMGM on 4 October 2026.
| Central bank | Current policy rate | Near-term hike odds | Market read |
|---|---|---|---|
| US Federal Reserve | 3.75%-4.00% | 17.7% October; 84.1% December | At least one more hike, then a prolonged plateau |
| Reserve Bank of Australia | 4.60% | About 20% November | Largely priced to hold, near terminal rate |
The RBA’s cash rate is higher, but the direction of travel favours the Fed. Ian Harper, reported to be a former RBA board member (his current role has not been independently confirmed), called another Australian hike this year plausible but not necessarily likely.
St Louis Fed President Alberto Musalem supplied the dollar’s backbone. He argued that further tightening will be required to bring inflation back to 2%, and that elevated real yields, underpinned by heavy demand for capital and AI-related investment, could keep policy restrictive for an extended period.
Musalem on the US economy He described the economy as “pretty strong” and the labour market as balanced and stable, while saying he keeps an open mind.
FXStreet’s Speechtracker scored his remarks 7.3/10 against a 7.2 historical average, and the FXS Fed Sentiment Index slipped 0.25 points to 138.33, still far above the neutral 100. What this tells you is simple: a dollar dip on soft sentiment is a low-conviction move when inflation expectations are rising alongside it.
When big ASX news breaks, our subscribers know first
What are bond calm and iron ore weakness telling you about risk appetite?
If rate differentials explain the pressure on the pair, the bond market explains why the selling has not turned into a rout.
Treasury calm and the carry trade
Strong US 10-year and 30-year auctions on back-to-back days suggested that buyers emerge once yields reach a certain point. OCBC strategists say steady auction demand and lower bond volatility should help stop risk-sensitive currencies from falling further.
The mechanism runs through the carry trade, which means borrowing in a low-yielding currency to hold a higher-yielding one. The MOVE index measures expected volatility in US Treasuries. When it falls, leveraged traders face looser Value-at-Risk limits (internal caps on how much they can lose), credit spreads tend to tighten, and high-yielders like AUD attract flows. The MOVE has recently ceded the spotlight to French government bond volatility as the main source of global rate jitters.
The carry trade mechanism is only as stable as the rate map beneath it, and diverging central bank policy across the Fed, BoJ and SNB has narrowed the margin of safety for leveraged positions that high-yielders like AUD depend on.
Calm bonds, however, are open to interpretation:
- High yields with falling volatility are ideal for carry, favouring AUD and other high-beta currencies.
- High yields still tighten financial conditions, which could eventually hurt global growth and commodities, leaving AUD to underperform.
- Calm may reflect expectations of slower nominal growth and “higher for longer” real rates, which could favour USD if US growth outpaces China and Australia.
Iron ore and the China question
The commodity side is weaker. The Mysteel SEADEX 61% fines index stood at US$89.6/dmt on 10 October, with the 62% low-alumina index at US$94.55/dmt. The most-traded Dalian contract closed down 3.12% at 682.5 yuan/ton, its lowest since April 2025, while the November SGX contract traded around US$91.3/ton.
China’s manufacturing sector returned to growth in September, briefly lifting futures back above CNY 700. The bounce was modest, and some reports describe prices at roughly 18-month lows, a claim not independently confirmed. Lower seaborne prices would typically erode Australia’s terms of trade, meaning what the country earns for its exports relative to what it pays for imports.
The China stimulus debate Bulls read the PMI improvement as stimulus gaining traction, with iron ore and AUD recovering as construction stabilises. Bears point to property-sector strain and weak private investment, arguing the uptick is temporary and iron ore remains in a cyclical downswing.
Put together, calm bonds give AUD a floor while weak iron ore removes the lift that usually powers its rallies. Unless China’s data change, you should expect range trading rather than a breakout.
What drives the Australian dollar over the long run?
If the pair seems to react to everything, from a Michigan survey to a Dalian futures contract, there is a structural reason.
The Australian dollar is a high-beta, commodity-linked currency. High-beta means it tends to move more than the market around it, rising faster in risk-on periods and falling harder in risk-off ones. That explains why both Chinese data and global volatility move it.
The RBA targets 2-3% inflation. When its rates are high relative to other central banks, AUD tends to strengthen; tightening is AUD-positive and quantitative easing (central bank bond buying to push down yields) is AUD-negative. China is Australia’s largest trading partner, and iron ore exports were worth about $118 billion a year based on 2021 data.
| Driver | Direction of effect | Current reading | Impact now |
|---|---|---|---|
| Rate differential | Relative RBA hikes lift AUD | Fed hike odds far above RBA’s | Negative |
| Iron ore | Higher prices lift AUD | Dalian at lowest since April 2025 | Negative |
| China growth | Stronger growth lifts AUD | PMI back in expansion, durability doubtful | Mixed |
| Risk sentiment | Risk-on supports AUD | Firm auctions, calmer bond volatility | Supportive |
History suggests how these drivers have played out, though the following precedents have not been independently confirmed:
- Unexpectedly hawkish RBA minutes have tended to spark short-term AUD rallies, while dovish minutes have often triggered selling.
- In 2022-2023, hawkish Fed repricing typically weakened AUD against USD, even when Australian data were solid.
- During MOVE spikes, AUD sold off with other high-beta currencies, usually recovering once volatility subsided, depending on China and commodities.
Right now, the rate differential is the dominant driver. That tells you which headlines to prioritise: Fed speakers and US inflation data over secondary releases.
Where are the key levels and what would change the AUD/USD forecast?
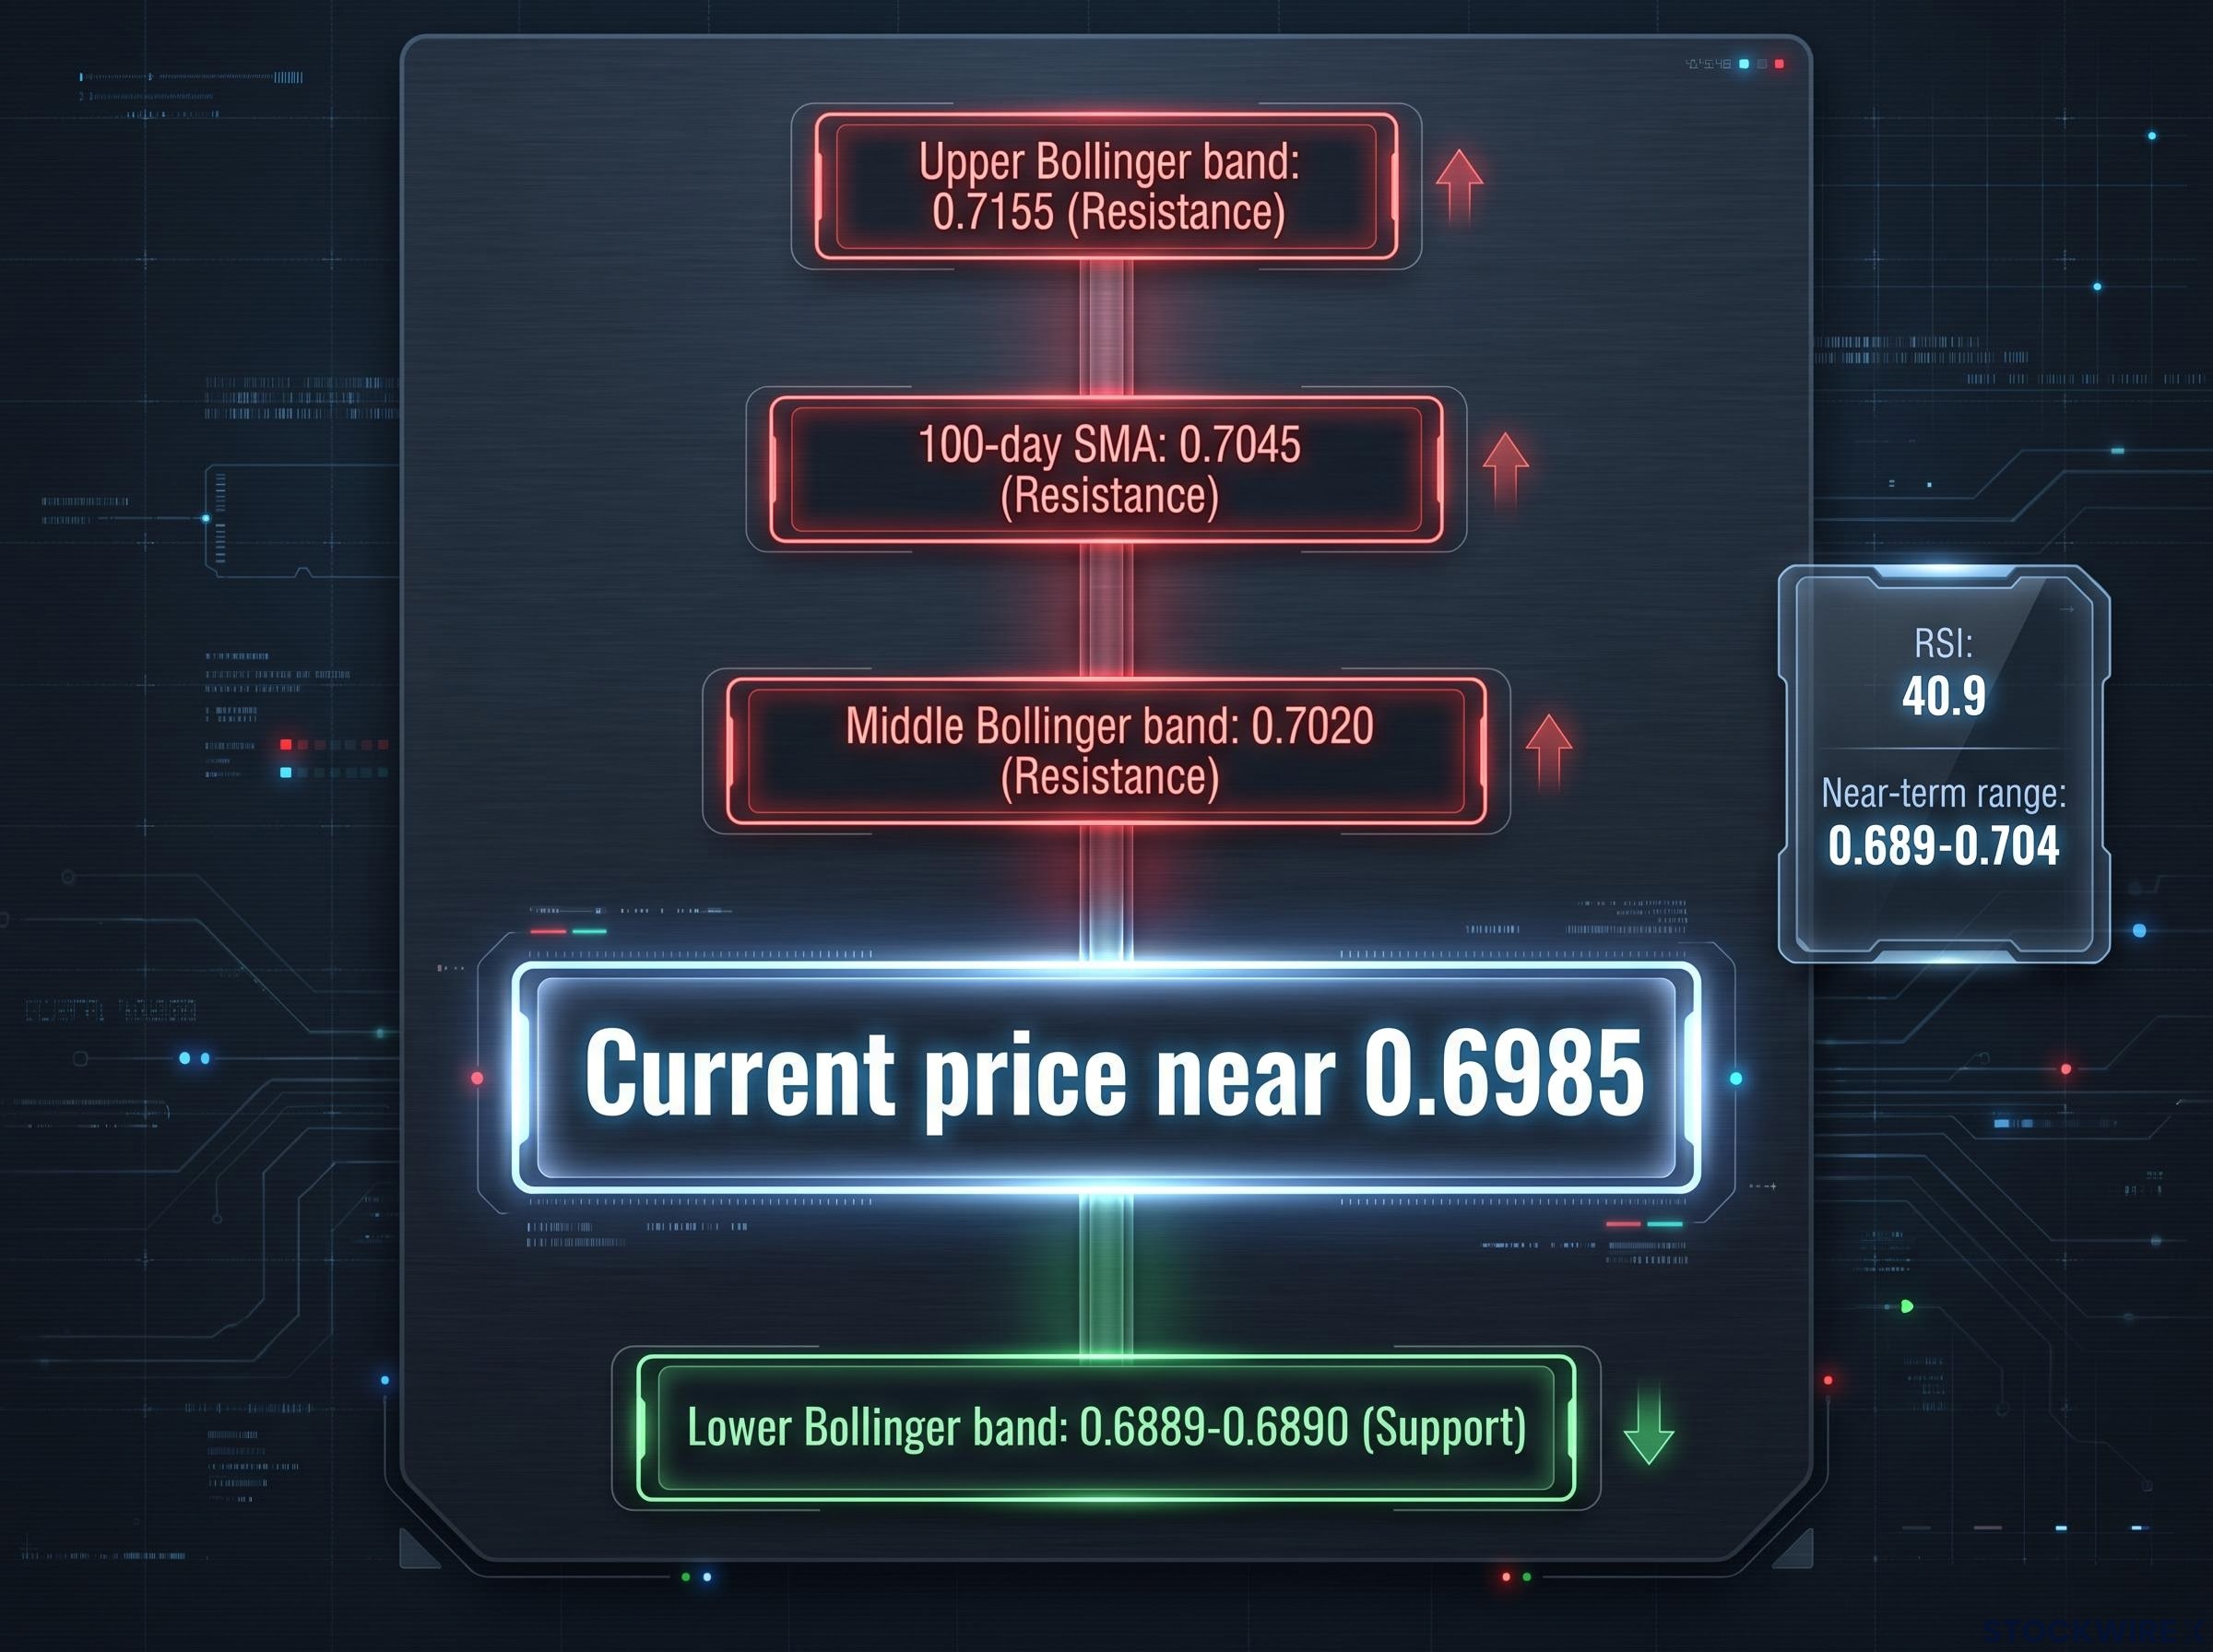
Start at the top of the chart and work down. On FXStreet’s daily analysis (written with AI assistance), the upper Bollinger band sits near 0.7155, the 100-day simple moving average (the average closing price over 100 sessions) near 0.7045, and the Bollinger middle band around 0.7020. Price is trading below all three.
Below, the lower Bollinger band near 0.6889-0.6890 marks support. The relative strength index, a momentum gauge running from 0 to 100, reads 40.9: under the midline, so pressure persists, but well short of oversold.
| Level | Price | Type | What it signals |
|---|---|---|---|
| Upper Bollinger band | 0.7155 | Resistance | Stretch target if the bias flips |
| 100-day SMA | 0.7045 | Resistance | A close above suggests the bias has changed |
| Middle Bollinger band | 0.7020 | Resistance | First test for any rally |
| Lower Bollinger band | 0.6889-0.6890 | Support | A break opens deeper losses |
The base case The near-term outlook in the research points to a 0.689-0.704 range, with asymmetric downside risk.
Three scenarios could test that range:
- Hawkish Fed repricing: stronger US data or higher inflation lifts yields and pushes flows into USD, pressuring AUD.
- Benign bond backdrop: firm auctions and a low MOVE support AUD through carry, though iron ore caps the upside.
- RBA surprise: sticky services inflation or wages force a hike despite low pricing, giving AUD a short-term boost.
Bulls argue AUD is already discounted, and that a stabilising China and peak Fed hawkishness could drive a grind through 0.7045. Bears cite weak iron ore, US growth exceptionalism and an RBA that may lag the Fed. One view in the research favours selling rallies toward 0.7045-0.71; treat that as a perspective, not a recommendation. The signal to watch is a break below 0.689 or a close above 0.7045. Past performance does not guarantee future results, and these projections are subject to change with market conditions.
Investors exploring how momentum and support levels interact with US yields will find our detailed coverage of AUD/USD technical analysis, including a worked look at the RSI and moving average confluence.
What the RBA minutes can and cannot change for AUD/USD
The argument comes down to three forces. Rate differentials and a hawkish Fed hold the pair under pressure, calm bond markets offer a floor, and weak iron ore caps rallies.
After Tuesday’s release, three variables deserve your attention:
- The RBA’s tone on services inflation and wages
- US inflation expectations and Fed speakers
- China data and the direction of iron ore
The minutes matter only if they shift the rate-differential story. A hawkish surprise could lift the pair briefly, but without help from China or a softer Fed, the base case remains a range with a downside skew.
This article is for informational purposes only and should not be considered financial advice. Investors should conduct their own research and consult with financial professionals before making investment decisions.