
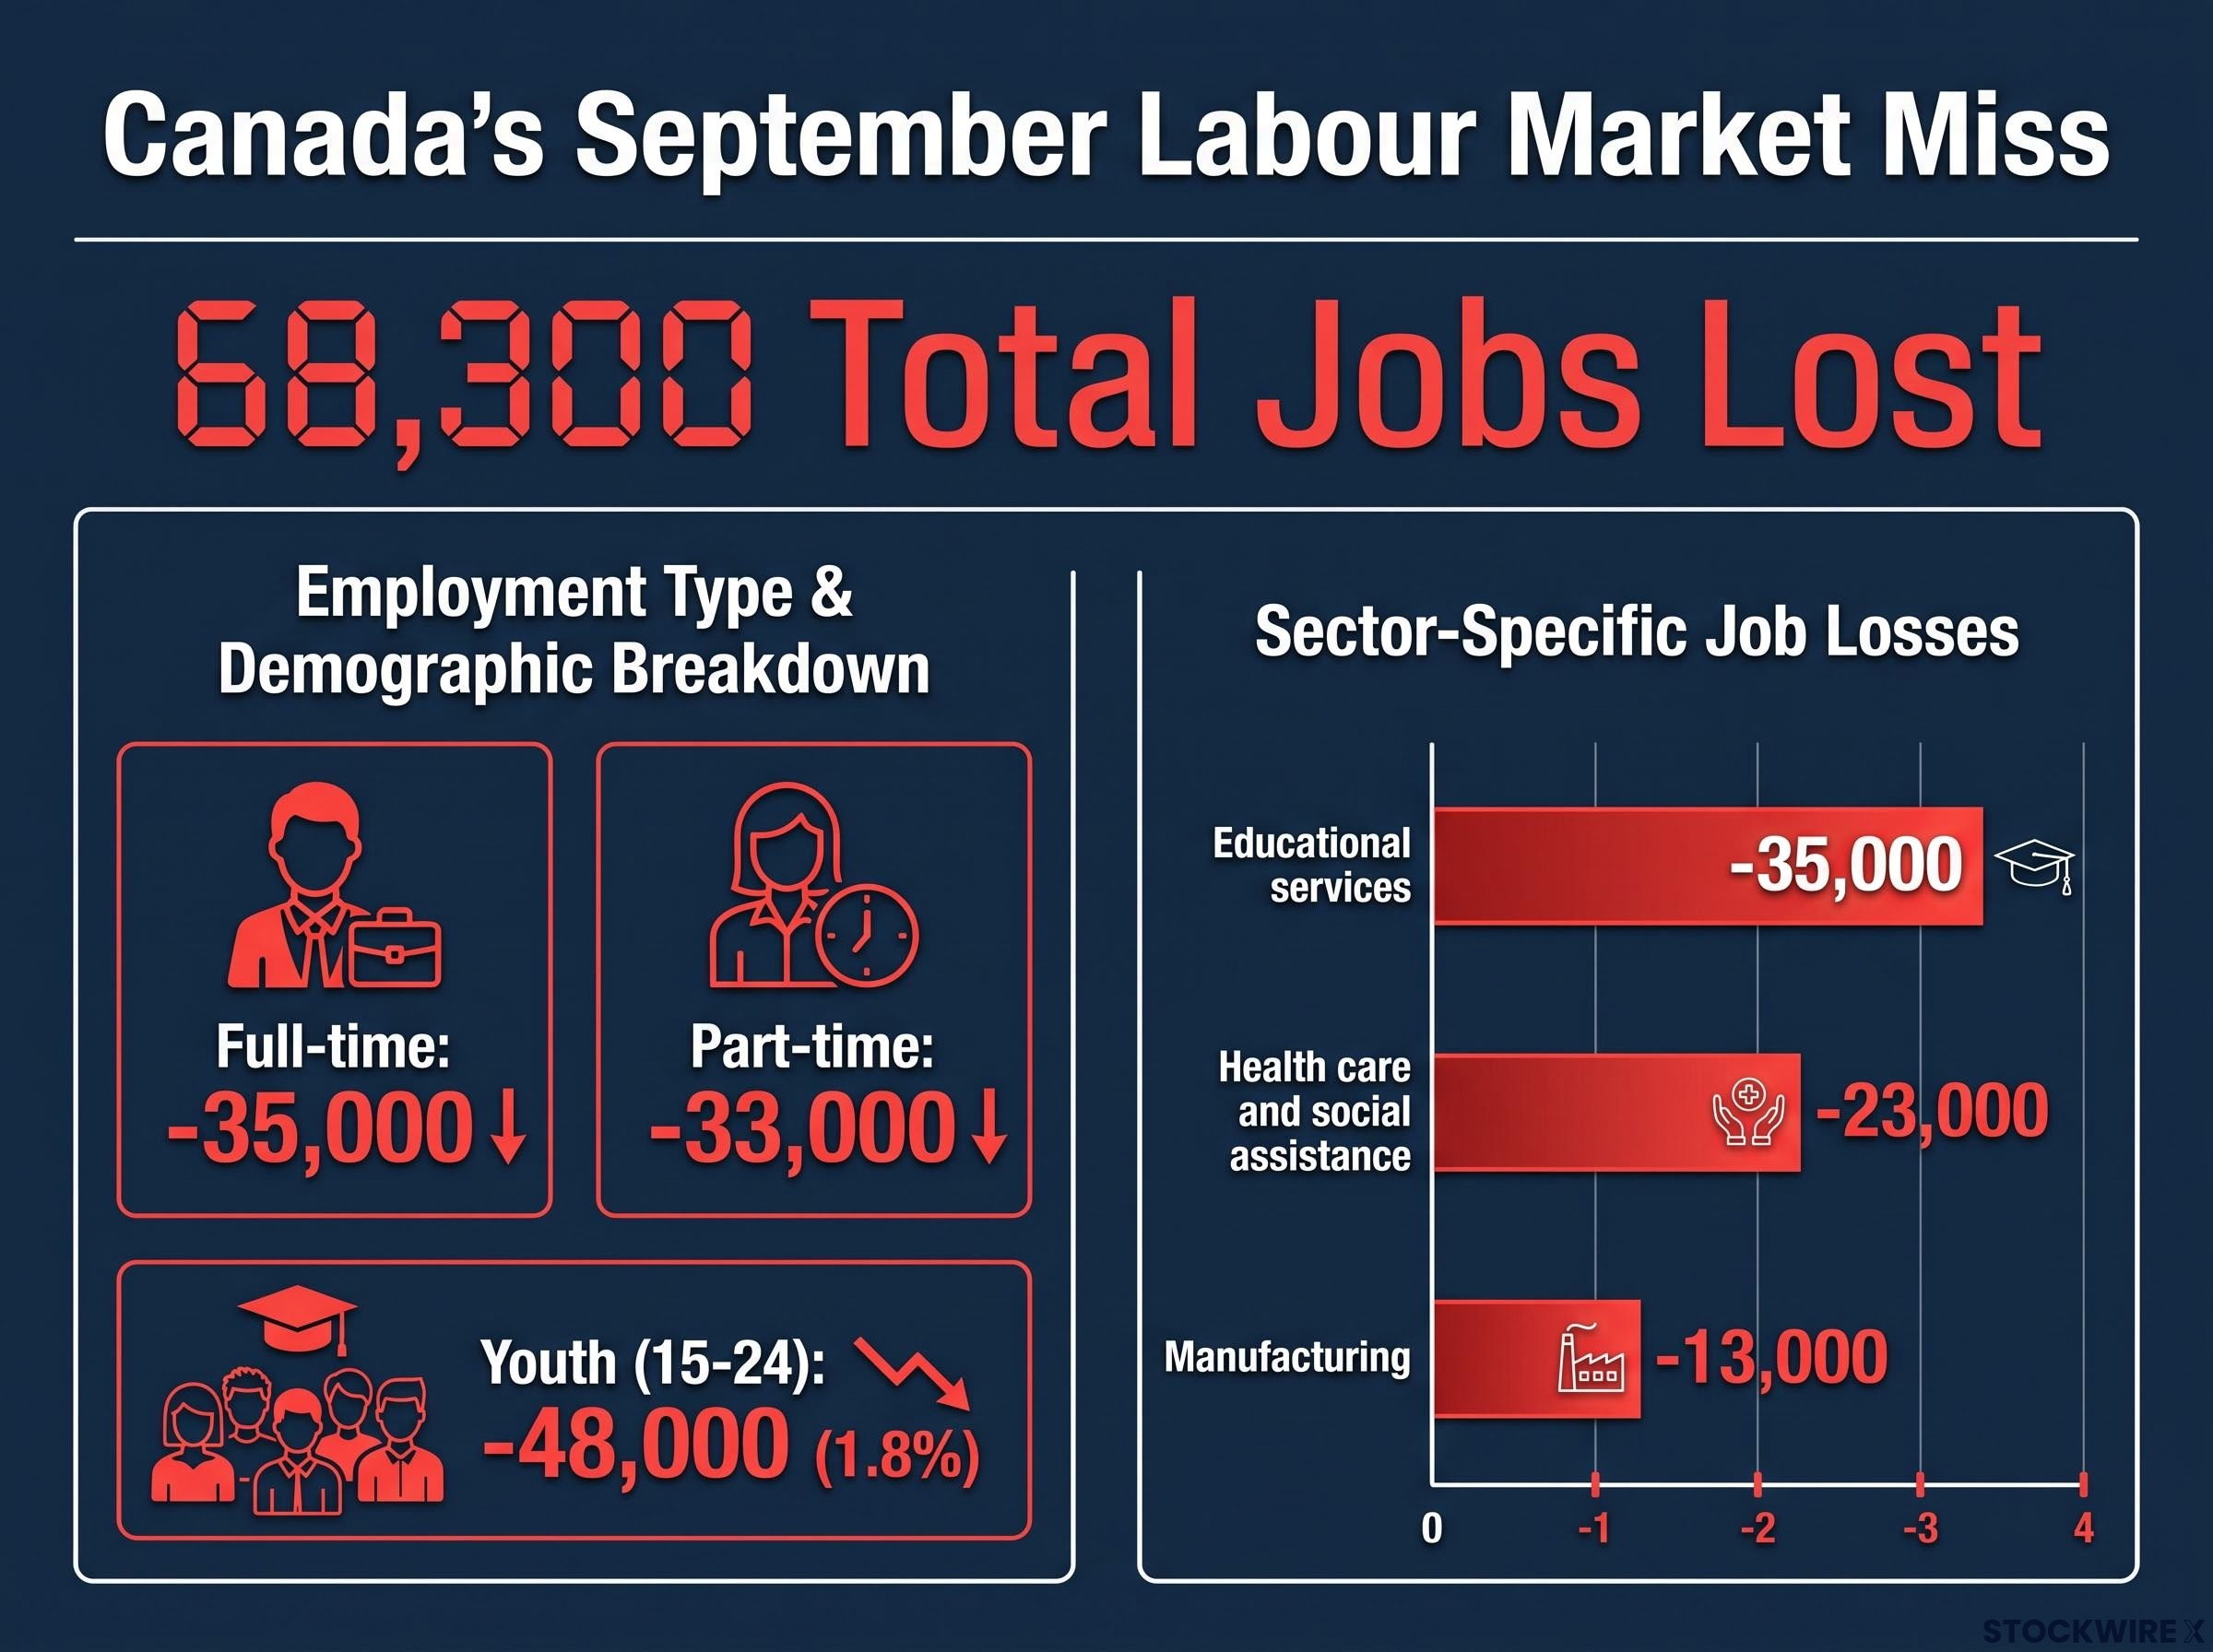
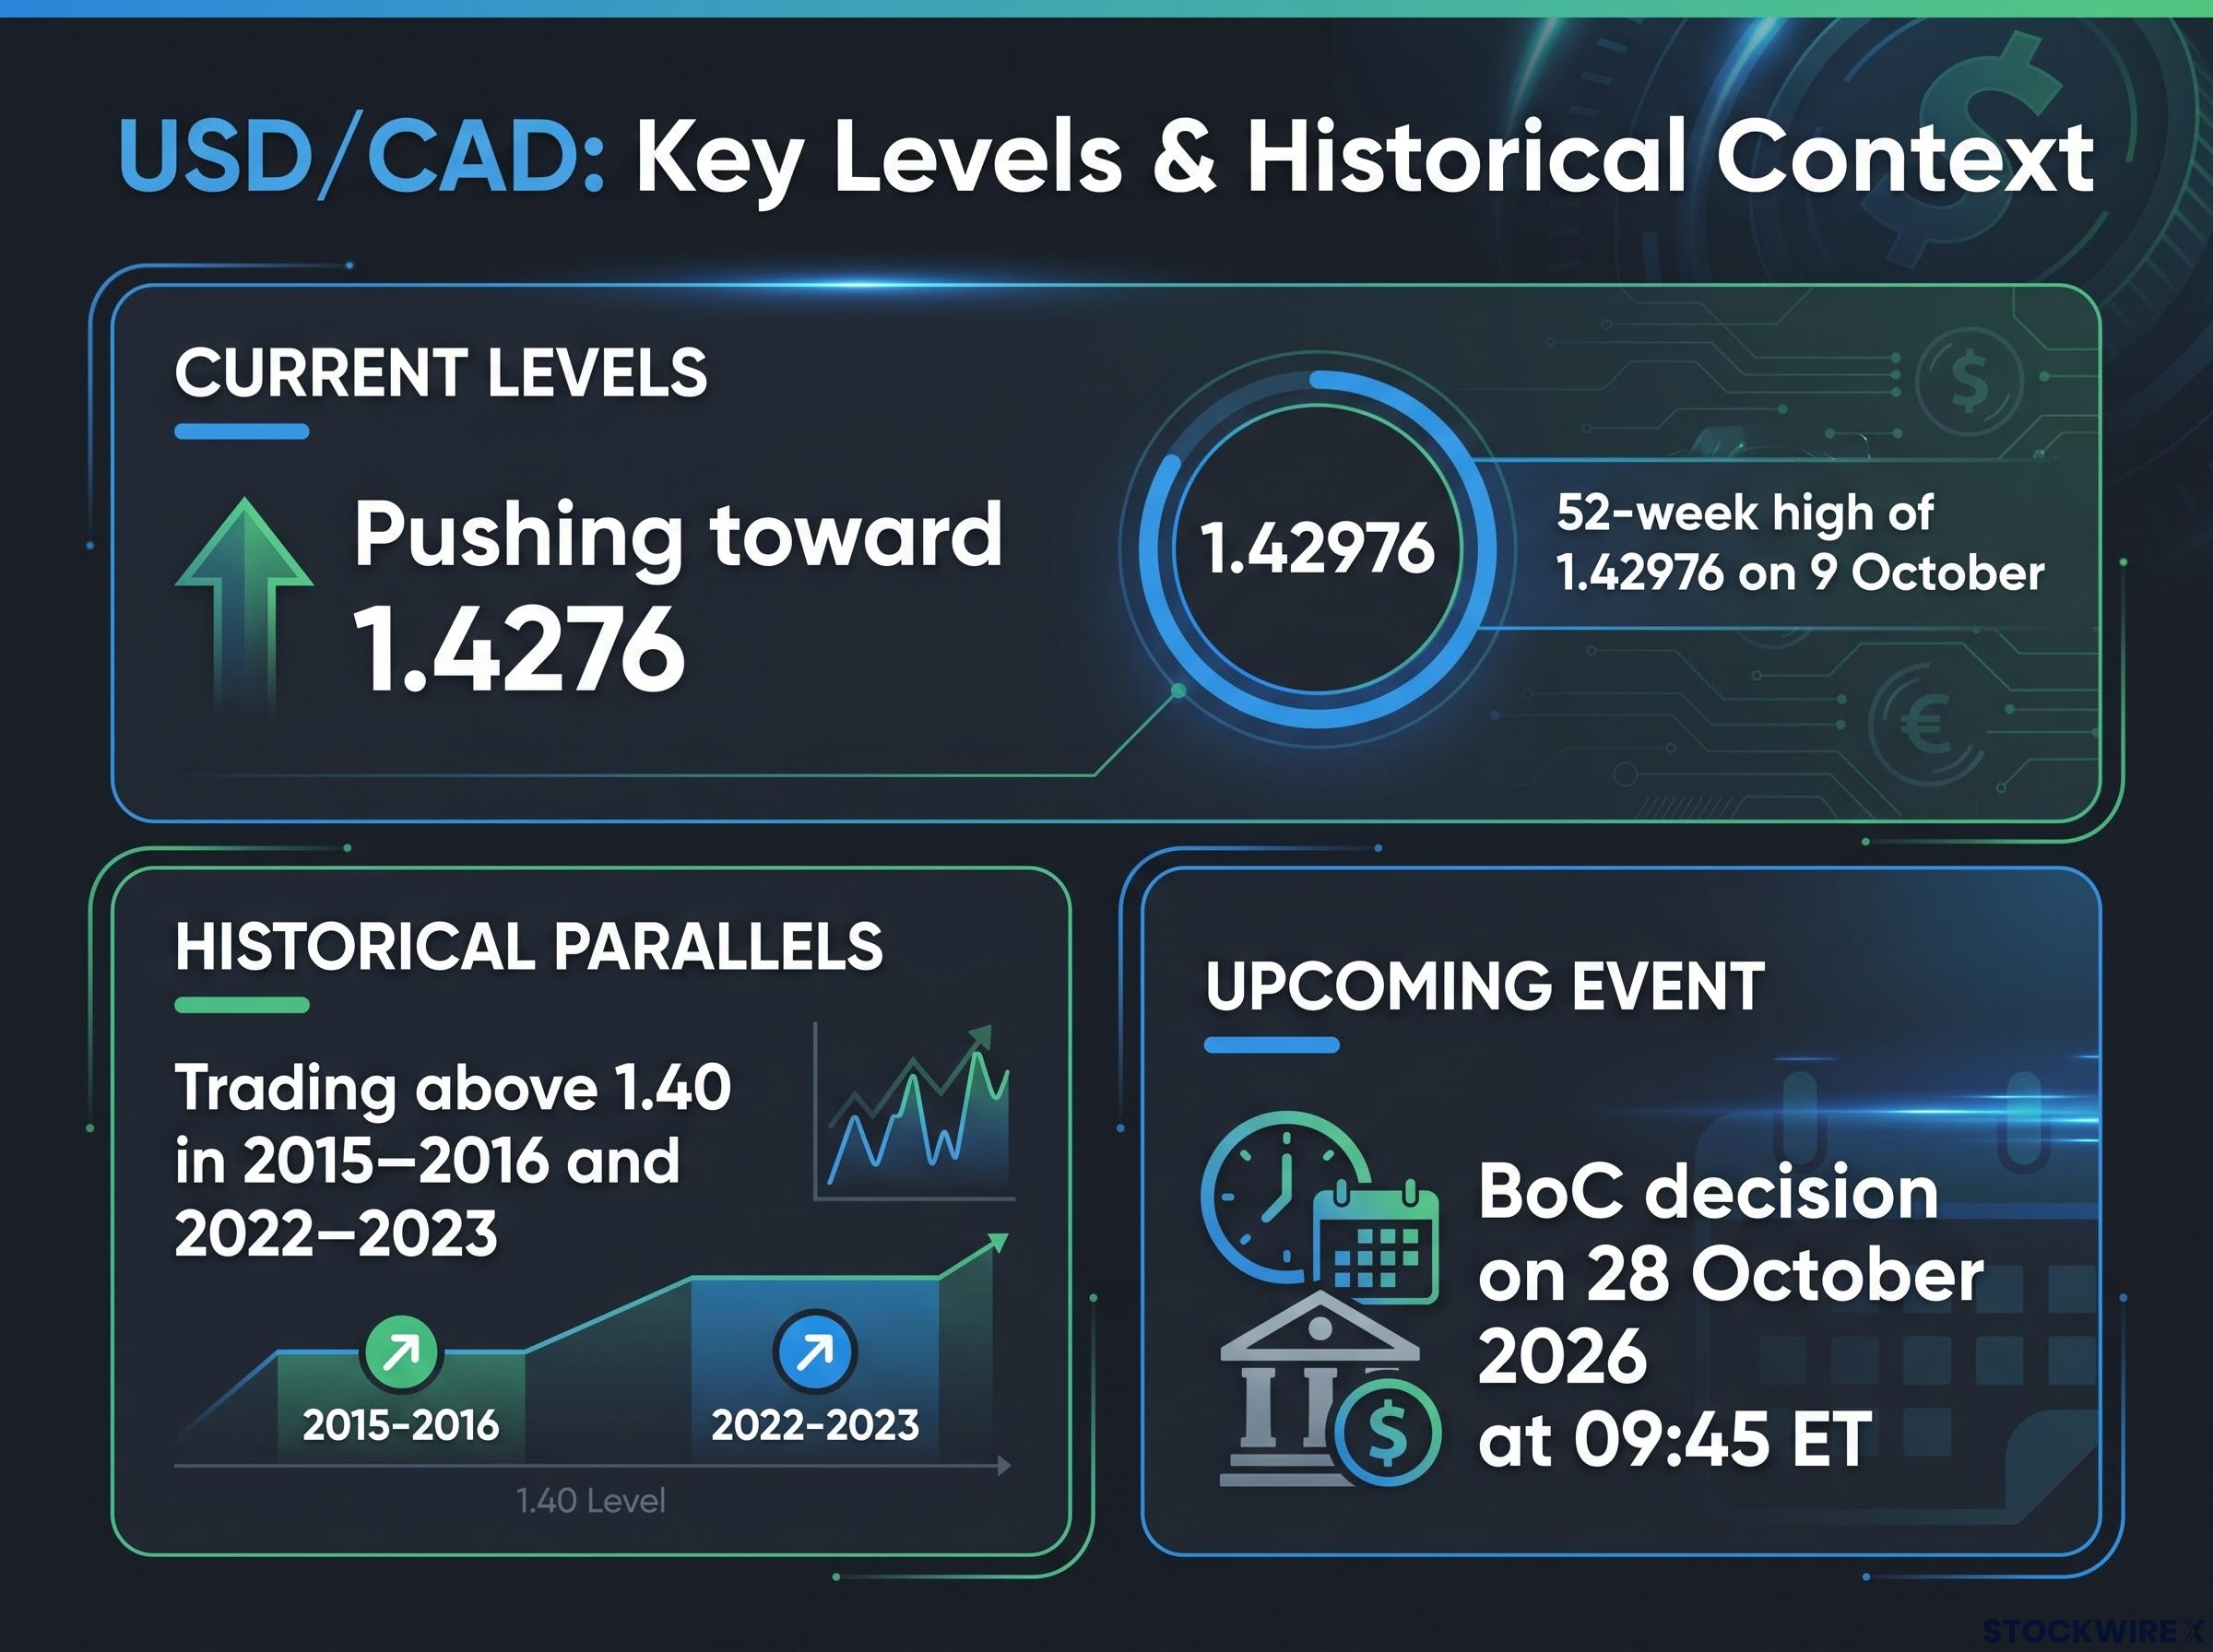
The US dollar climbed to its highest level against the Canadian dollar since April on Friday, with USD/CAD pushing toward 1.4276 and the loonie sinking to an 18-month low. The trigger was a report showing Canada lost 68,300 jobs in September, when economists had pencilled in a small gain, which reshaped the near-term forecast for the pair within hours.
The move reflects more than one bad data print. The Federal Reserve and the Bank of Canada (BoC) are heading in opposite directions, and the gap between their interest rates is now the main force behind any view on where USD/CAD goes next.
Yesterday’s jobs data widened that gap further.
Here is what is pushing the pair higher, which levels and dates matter next, and what could reverse the trend before the BoC meets later this month.
Why the CAD is under pressure: the data behind the 18-month low
Forecasters expected Canada to add somewhere between 7,000 and 10,000 jobs in September, depending on whose consensus you read. Statistics Canada reported a loss of 68,300 instead. That is a miss of roughly 75,000-80,000 jobs.
Scotiabank summed up the surprise in a note titled “A Turkey of a Canadian Jobs Report,” saying the print “blew all forecasters away.”
It was also the second monthly fall in a row, following a 41,700 decline in August. The unemployment rate rose to 6.5% from 6.4%, matching expectations. The participation rate, which measures the share of working-age people either employed or actively looking for work, fell to 64.8%, its lowest since December 1997 outside the pandemic. The employment rate slipped to 60.6%.
The Statistics Canada Labour Force Survey for September also showed the participation rate falling to 64.8% and the employment rate slipping to 60.6%, with the sharpest losses concentrated in educational services, health care and manufacturing.
The losses were spread widely:
- Full-time: down 35,000
- Part-time: down 33,000
- Educational services: down 35,000
- Health care and social assistance: down 23,000
- Manufacturing: down 13,000
- Youth (15-24): down 48,000, or 1.8%
There is a caveat. RBC Economics pointed out that the losses were driven largely by public-sector education and health care, and that they mostly reversed gains made over the summer.
Even so, two straight monthly declines and a near three-decade low in participation tell you the Canadian labour market is losing momentum. That is why currency traders treated the report as a policy signal rather than a one-month anomaly, and sold the loonie across the board.
| Currency pair | Move | Direction for CAD |
|---|---|---|
| USD/CAD | +0.38% | Weaker |
| EUR/CAD | +0.28% | Weaker |
| GBP/CAD | +0.32% | Weaker |
| CAD vs AUD | -0.65% | Weaker |
| CAD vs NZD | -0.44% | Weaker |
| CAD vs CHF | -0.39% | Weaker |
| CAD vs JPY | +0.14% | Stronger |
The yen was the only major currency the loonie managed to beat on Friday.
Why the Fed and BoC gap keeps USD/CAD bid, and what traders should watch next
The jobs miss mattered because of what it did to interest-rate expectations. The chain runs in four steps:
- Weak labour data lowers the odds of a BoC rate hike.
- Canadian bond yields fall as traders reprice.
- US yields stay high, supported by a hawkish Fed.
- The yield gap widens, making the US dollar more attractive to hold.
After the release, market-implied odds of an October BoC hike fell to about 25%, with the next potential hike now seen in December, according to TMGM. Canada’s two-year yield dropped more than 8 basis points (a basis point is one hundredth of a percentage point).
| Metric | Canada | United States | Gap |
|---|---|---|---|
| Policy rate | 2.25% | 3.75-4.00% | At least 1.5 percentage points |
| 2-year yield | About 3.199% | About 4.797% | About 160 bp |
| 10-year yield | Above 5.25% |
On the US side, St. Louis Fed President Alberto Musalem said on Thursday that further tightening is needed to bring inflation back to target, while Fed Governor Christopher Waller signalled more hikes if the data evolve as expected. The US Dollar Index (DXY), which tracks the dollar against a basket of major currencies, sat near 102.30, close to an 18-month high. USD/CAD touched a 52-week high of 1.42976 on 9 October.
Higher oil prices tied to Middle East supply risks would usually help the loonie, given Canada’s role as a major exporter. Some research suggests the yield gap is overwhelming that link, though this has not been independently confirmed.
The practical point for you is simple. A roughly 160 bp two-year yield gap means holding US dollars pays far more than holding Canadian dollars, so unless Canadian data or the Fed’s path changes, the pull on USD/CAD stays upward.
The Bank of Canada schedule confirms the next rate announcement and Monetary Policy Report for 28 October at 09:45 ET, the first formal chance for policymakers to respond to two straight months of falling employment.
What to watch next
- University of Michigan data: Preliminary October sentiment came in at 46.3 against 47.6 expected, the second-lowest reading on record, yet USD/CAD rose because one-year inflation expectations hit 4.7%.
- The BoC decision on 28 October 2026 at 09:45 ET, alongside its Monetary Policy Report.
- Fed speakers and US data that shift expectations for further tightening.
Could USD/CAD reverse? Risks to the bullish view
The case for a higher USD/CAD looks strong, but it rests on conditions that can change.
Several scenarios could pull the pair lower, while others could push it further up:
- Labour rebound: RBC and Morningstar note that monthly jobs data is volatile; a stabilisation could temper BoC easing bets.
- Softer US inflation: Weaker US data could narrow the yield gap.
- Hotter US data: Stronger inflation or growth could widen the differential further.
- BoC communication risk: If slack deepens, markets may price more easing than the Bank signals.
- Trade and tariffs: New US tariffs could weigh on Canadian growth, though this risk is more speculative.
Morningstar argues that rising slack makes it more likely the BoC signals caution or eventually eases rather than tightens, pointing to a softer outlook for the Canadian dollar.
RBC describes a labour market that is deteriorating but not collapsing, consistent with a cautious-to-neutral BoC.
History offers indicative, unverified parallels. In 2015-2016 and again in 2022-2023, periods when the Fed was tighter than the BoC reportedly coincided with USD/CAD trading above 1.40. These episodes suggest the pattern can persist, but they are not a template.
The bullish case relies on policy divergence persisting. You should treat any shift in BoC or Fed pricing, not the jobs number alone, as the signal that the trend is changing.
Past performance does not guarantee future results. These statements are speculative and subject to change based on market developments.
What the jobs shock changes for USD/CAD, and what it does not
September’s jobs collapse cemented the policy gap between Canada and the US. It did not settle the outlook on its own. The pair’s next leg now depends on what the BoC says on 28 October and how markets reprice the Fed.
The idea to carry forward is that rate differentials, not any single data release, set the direction. Currency markets can move sharply around scheduled data, so the dates on the calendar matter as much as the numbers themselves.
This article is for informational purposes only and should not be considered financial advice. Investors should conduct their own research and consult with financial professionals before making investment decisions.