
Japanese 10-year government bond yields have climbed to roughly 30-year highs near 3.15%, and UK gilt yields have reached their highest since 2007. Yet GBP/JPY has barely moved, holding between 207 and 210 since early September.
That quiet price is the puzzle any GBP/JPY forecast has to solve. On 9 October 2026, the pair sat near 209.2, with several forces pulling against each other: a UK-Japan yield gap of about 243 basis points, the risk of Japanese currency intervention with USD/JPY near 158, and the UK Autumn Budget due on 28 October.
If you read the range as calm, you may miss how much pressure is stored inside it. A coiled range tends to end suddenly, and the direction depends on which force gives way first.
Here is how the pieces fit together: which forces hold the pair in place, which ones could break it, and where the chart marks the decision points.
Why has GBP/JPY gone nowhere since early September?
On the surface, the last month looks uneventful. GBP/JPY has stayed inside a 207-210 band, with a 30-day high near 210.39, a low near 207.77 and an average near 208.93. Spot traded around 209.16 on Friday, up 0.14% on the day.
Underneath that flat line, both bond markets have been under strain at the same time.
Japan’s 10-year government bond (JGB) yield touched 3.153% this week, its highest in roughly three decades. The UK 10-year gilt peaked at 5.527% on 8 October, the highest since 2007. That October peak is separate from an earlier spike to 5.25% on 1 September, which Reuters described as the highest since 2008.
Because yields rose on both sides, the gap between them barely shifted. On 1 October, gilts yielded 5.439% against 3.092% for JGBs.
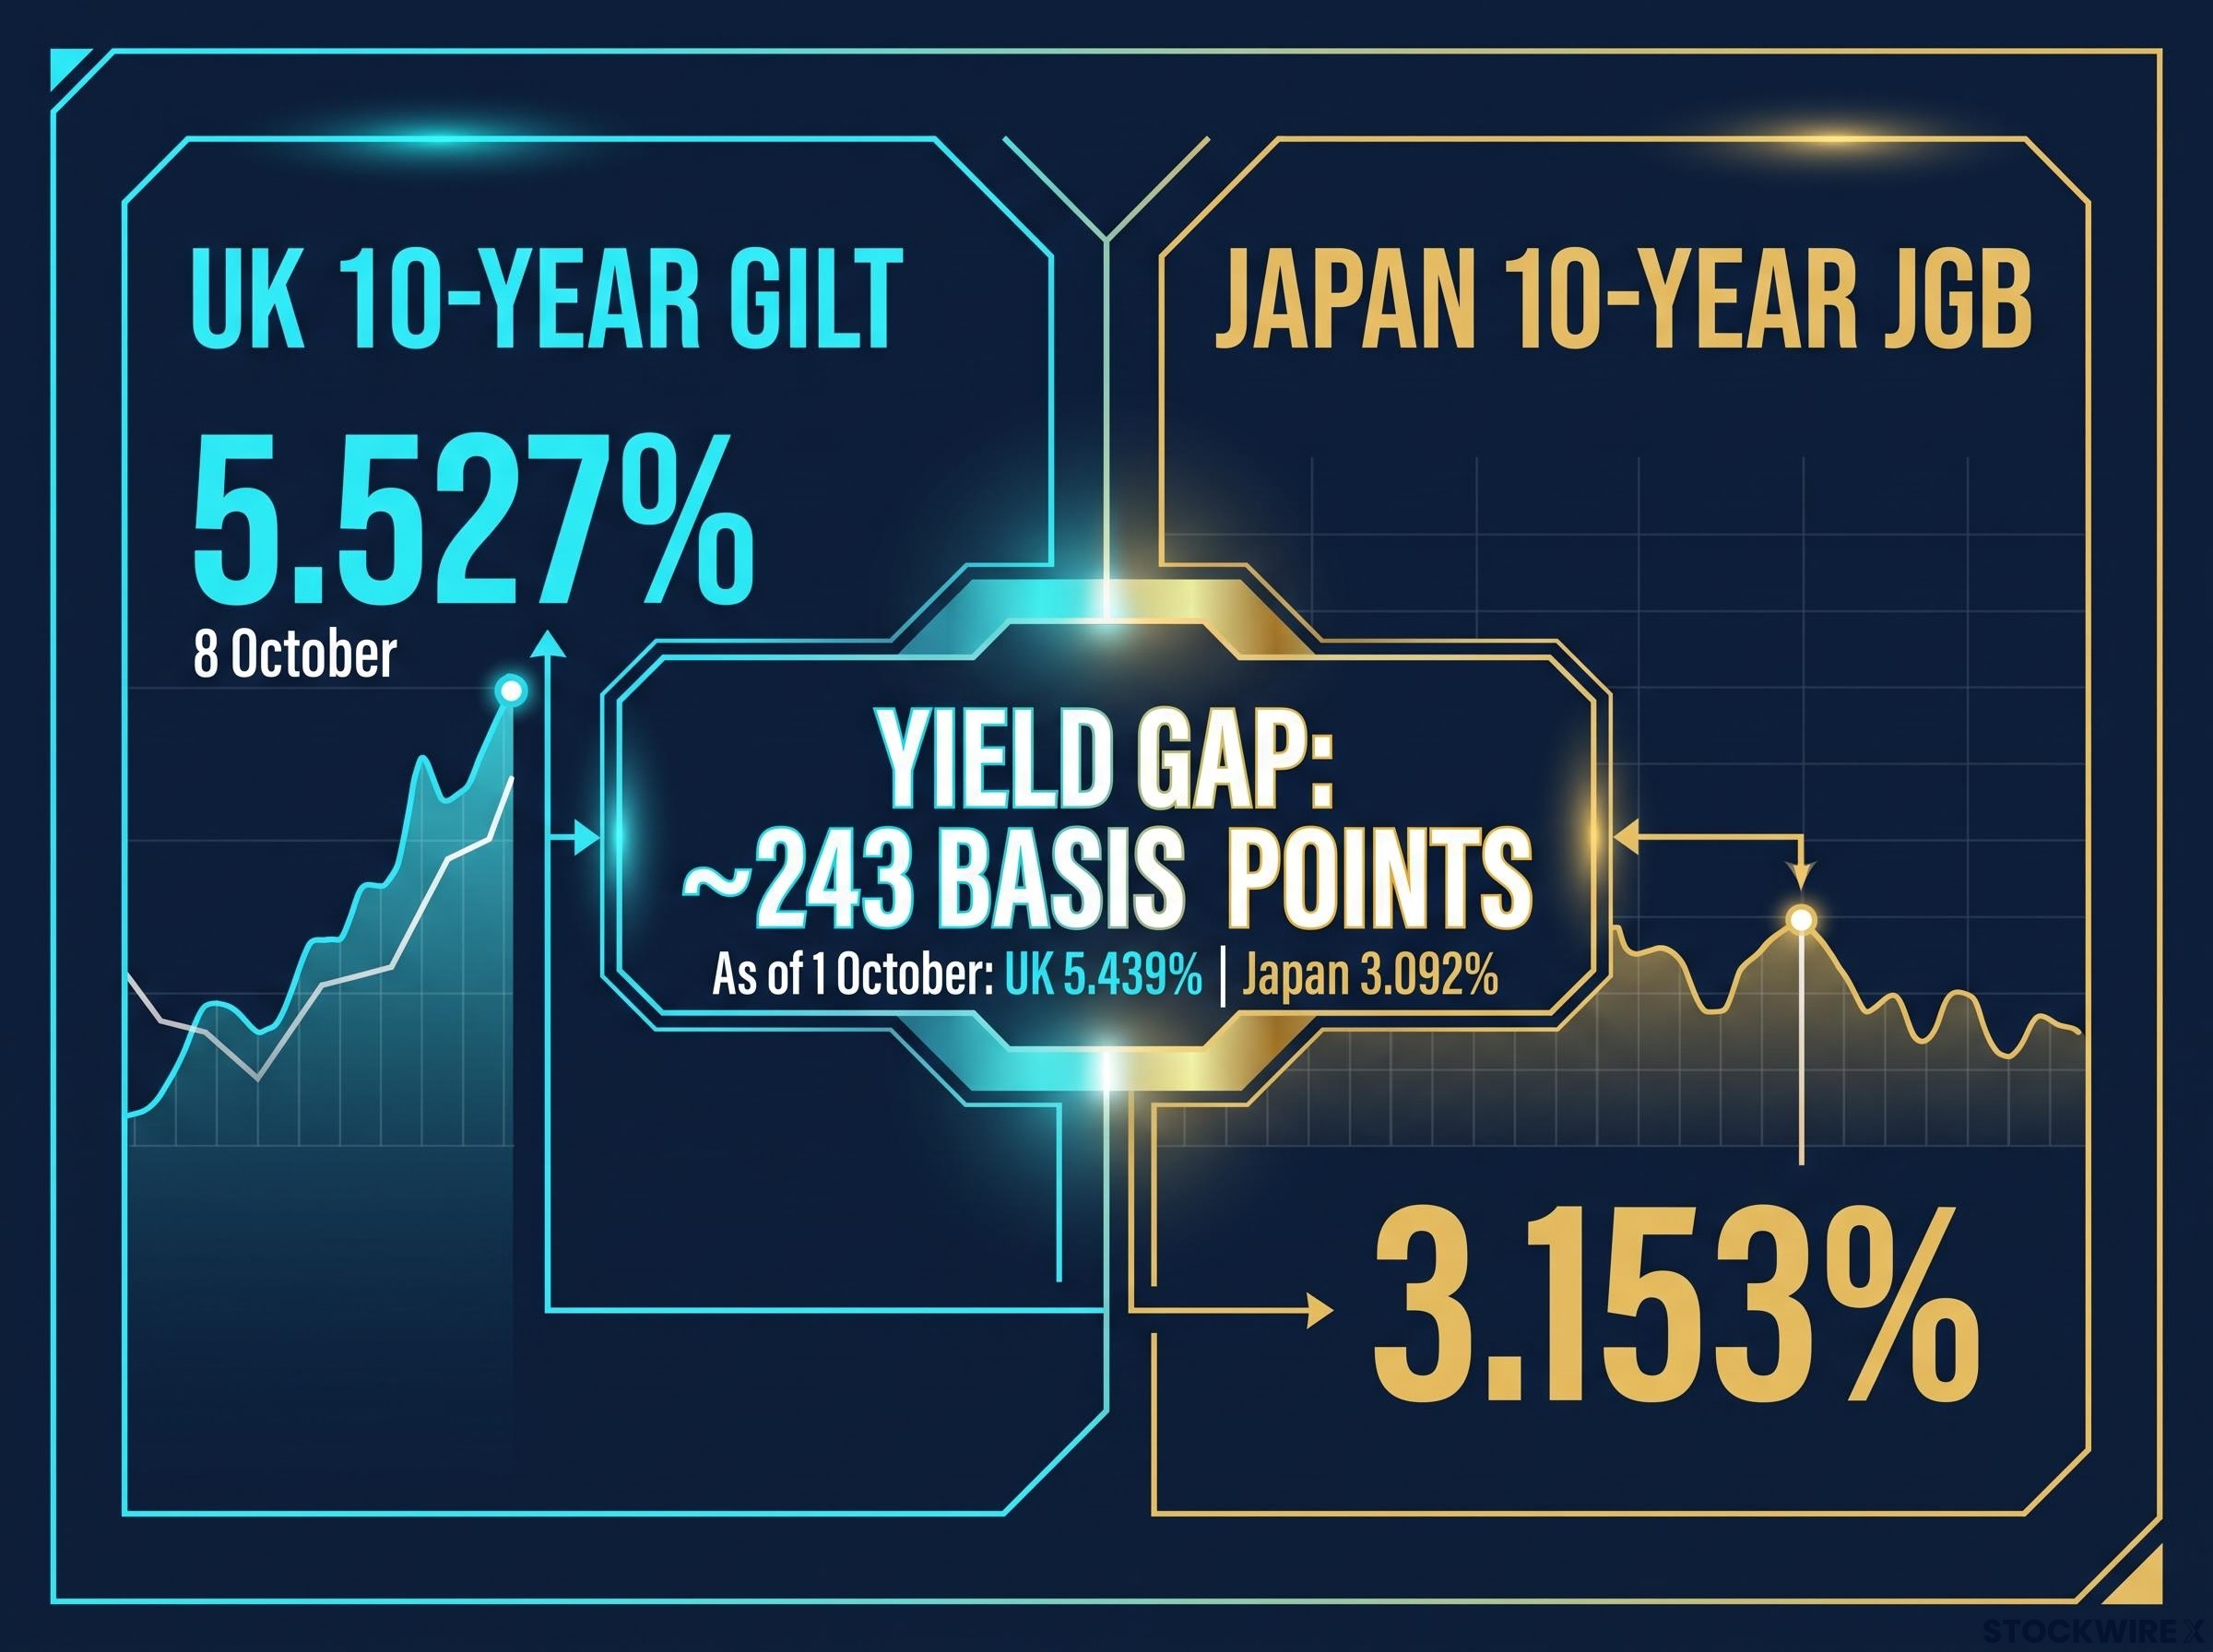
The number holding the pair up The UK-Japan 10-year yield gap stood at about 243.7 basis points on 1 October, and still near 243 bp on 9 October. A basis point is one hundredth of a percentage point.
| Indicator | Latest level | Context |
|---|---|---|
| GBP/JPY spot | 209.16 | Inside the 207-210 band since early September |
| UK 10-year gilt | 5.432% | Below the 5.527% peak on 8 October, highest since 2007 |
| Japan 10-year JGB | Near 3.00% | Eased after hitting 3.153%, a roughly 30-year high |
| Yield gap | About 243 bp | Little changed despite stress in both markets |
Friday showed how the balance works day to day. Global bond selling eased off for a spell and yields dropped, though Japan’s fell by a wider margin than Britain’s. The yen slipped 0.13% against sterling as a result.
The range does not mean nothing is happening. It suggests the market is pricing the carry advantage and the event risks as roughly equal, so a break will probably need a new input rather than more of the same.
When big ASX news breaks, our subscribers know first
How does a yield gap drive a yen cross, and why hasn’t BoJ tightening closed it?
To see why that 243 bp gap matters, start with the carry trade. A carry trade means borrowing in a currency with low interest rates and investing in one with higher rates, keeping the difference as profit.
- A trader borrows yen at Japan’s low rates.
- The trader converts it into sterling and holds UK assets that pay more, which adds buying pressure to GBP/JPY.
- If the yen rises sharply, the loan becomes more expensive to repay, so traders sell sterling and buy back yen at once. That rush to close positions is called an unwind.
The gap is the incentive. As long as it stays wide, the yen remains the cheaper currency to borrow.
Even after the BoJ lifted rates to multi-decade highs, the carry trade persists because the spread against higher-yielding currencies still rewards yen borrowing, which is why the incentive survives each incremental hike.
Why the yen stays weak despite rate hikes
A JGB yield above 3% sounds high for Japan, and it is. It is still far below UK and US levels, so the incentive survives. The Bank of Japan (BoJ) has been raising rates in quarter-point steps spaced months apart, and low absolute rates plus fiscal worries keep weighing on the yen.
Yields everywhere are elevated for shared reasons. Reuters links the global bond rout to stubborn inflation, higher oil and gas prices, mounting public debt and heavy government bond issuance, which together have lifted the extra return investors demand for holding long-dated debt. Commentators disagree on whether this is a lasting shift or a cyclical surge that could reverse quickly.
Forecasts have struggled to keep up. DBS expected the 10-year JGB yield to reach 2.85% by year-end, a level already passed.
What breaks the pattern
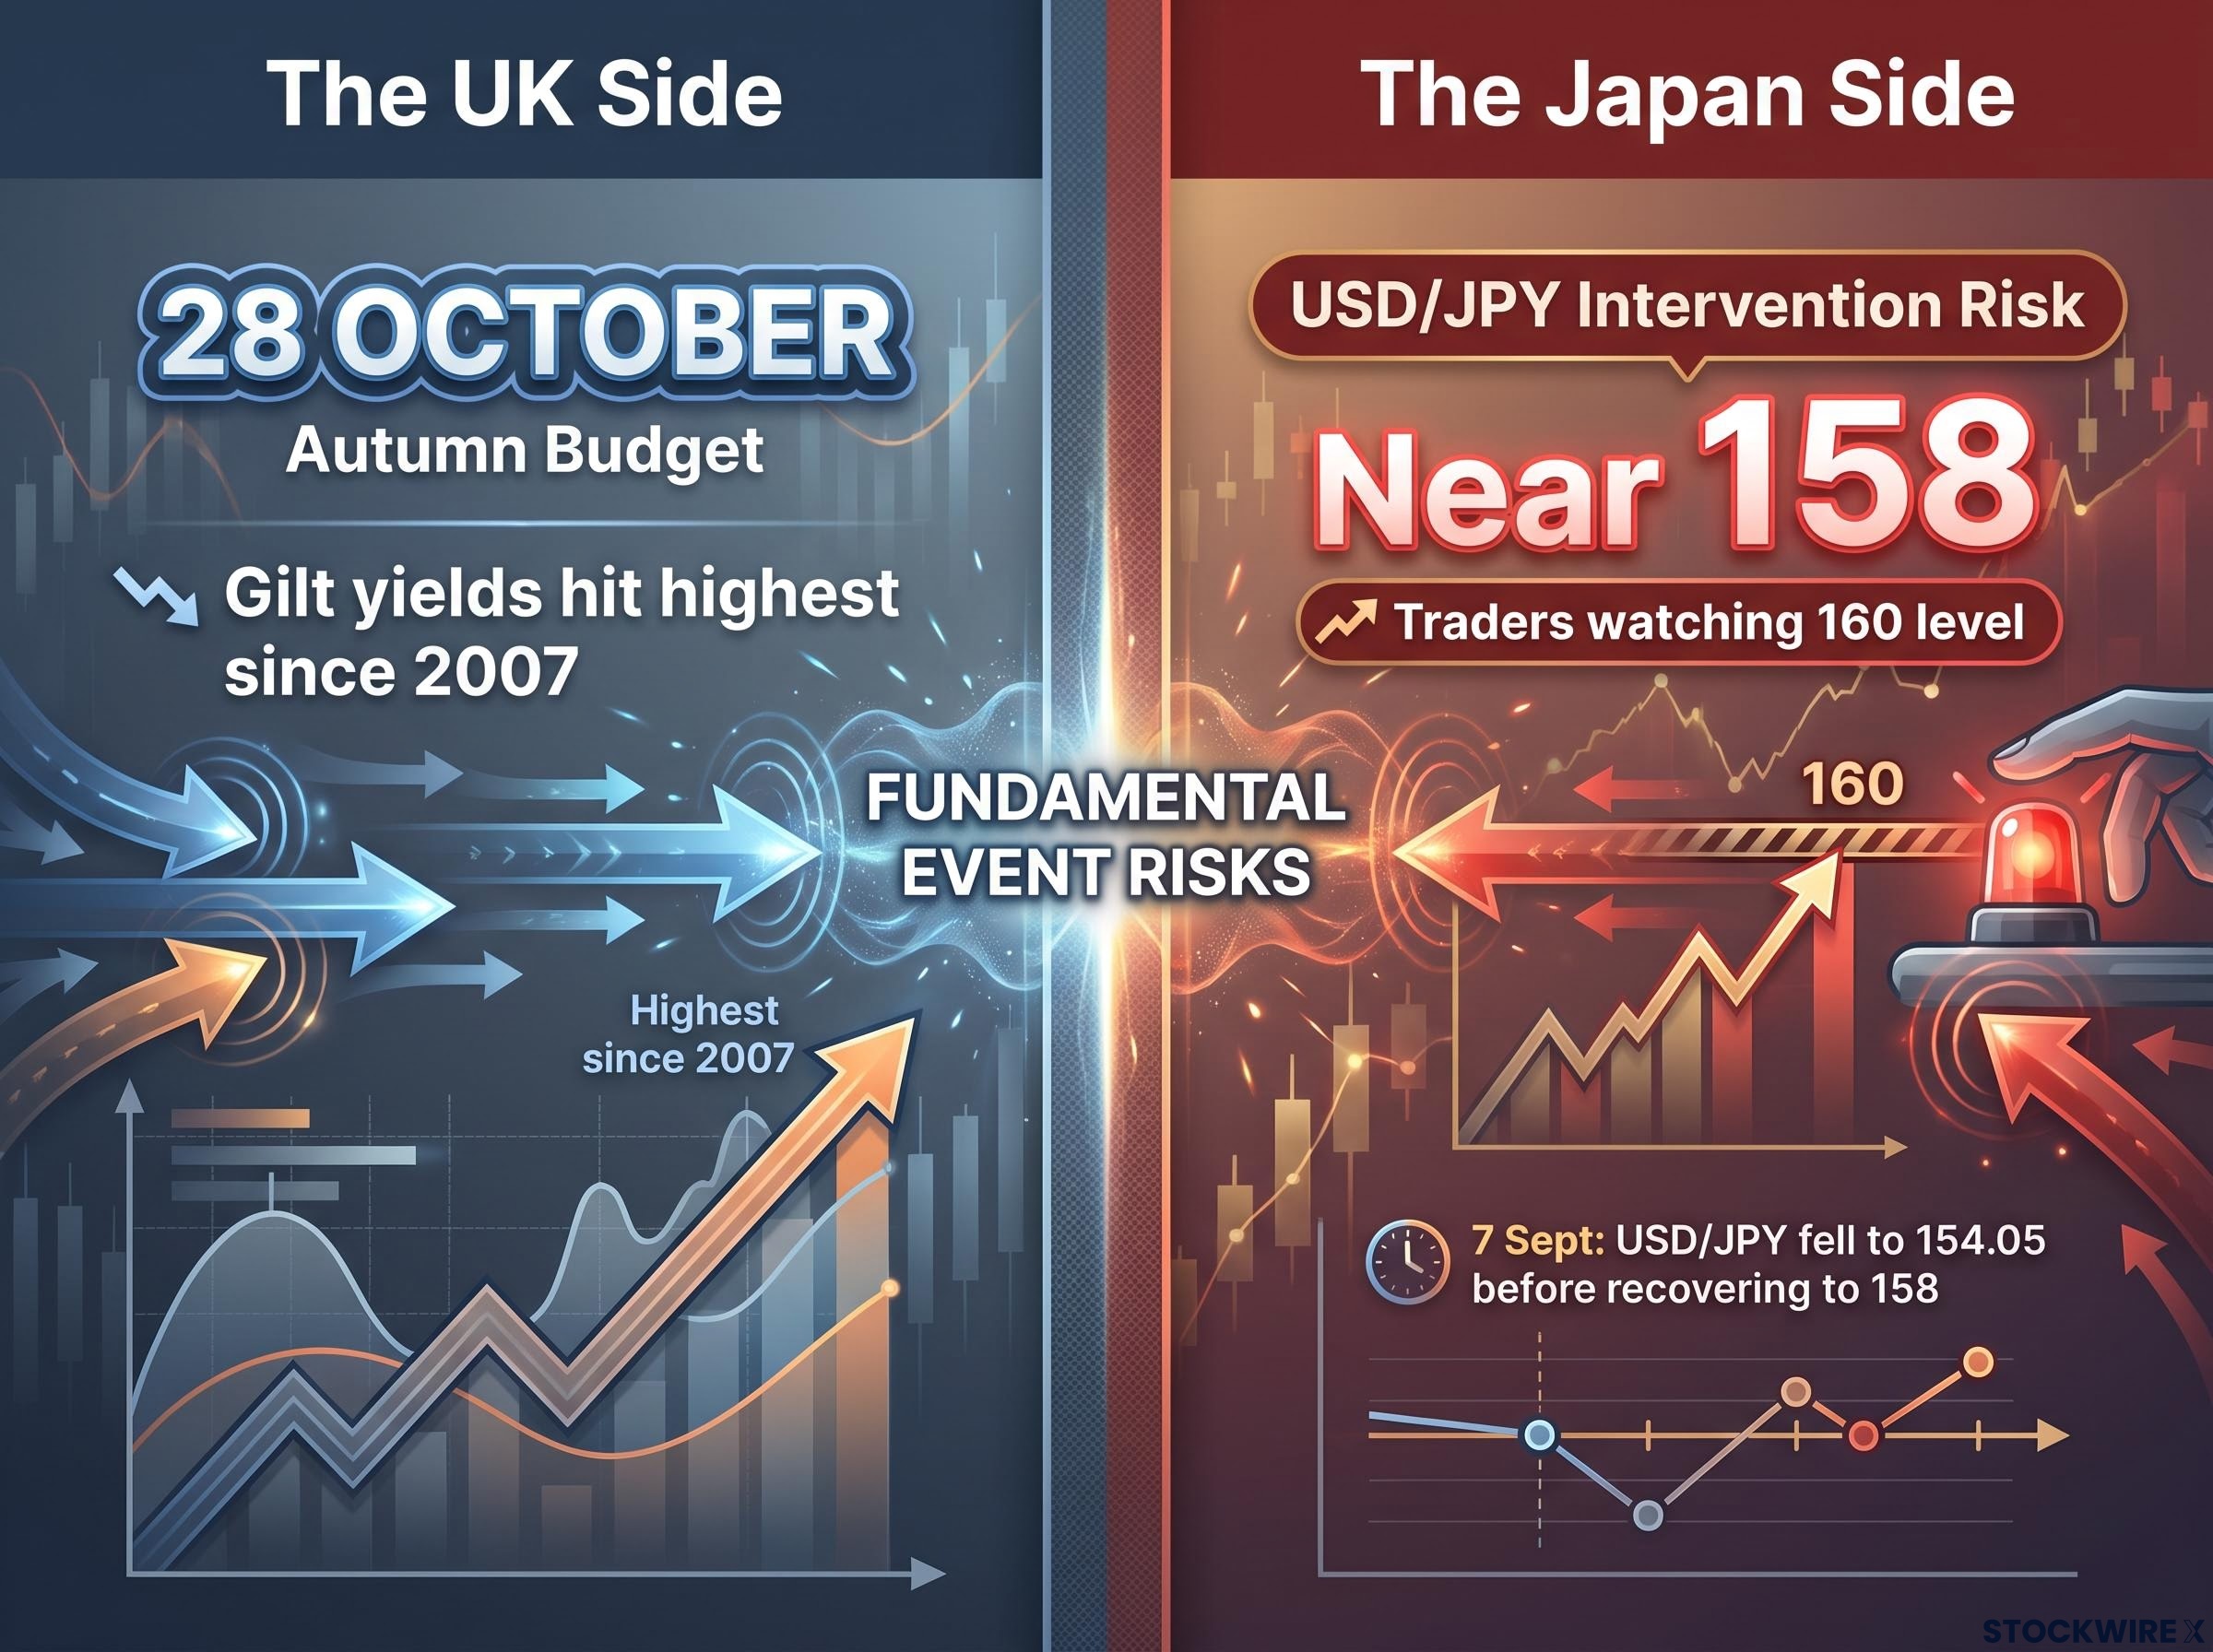
Yen strength has tended to arrive in bursts tied to events. On 7 September, USD/JPY fell as low as 154.05 on Federal Reserve rate repricing and risk-off flows, before recovering toward 158.
For you, this means yen rallies usually come with global risk aversion, not with a slow narrowing of the gap. Watch risk sentiment as closely as rate differentials.
What are Bailey and Ueda signalling, and where do they leave the pair?
Both central bank chiefs are leaning hawkish, meaning they favour higher rates to control inflation. The difference is speed.
Speaking in Istanbul on 8 October, Bank of England (BoE) Governor Andrew Bailey said policy must stay firmly committed to bringing inflation back to target. He said evidence of energy costs feeding into wider inflation is limited so far, but the risk rises the longer energy prices stay high. He also called for credible fiscal commitments and warned about high borrowing costs ahead of the Budget.
Bailey, 8 October: Policy must remain firmly focused on returning inflation to target, with the risk from energy prices growing the longer they stay elevated.
Ueda, 6 October: Rates will keep rising in step with the economy and inflation, with pace and timing set by the data.
BoJ Governor Kazuo Ueda said on 6 October that rates will continue to rise in line with the economy and prices. On 18 September, he said underlying inflation is nearing 2% and described the approach as data-dependent and pre-emptive.
| Factor | BoE (Bailey) | BoJ (Ueda) |
|---|---|---|
| Latest message | Firm on inflation target; fiscal credibility needed | Rates to keep rising; data-dependent |
| Market expectation | Hike priced before year-end | Gradual moves, quarterly or less often |
| Effect on the gap | Holds or widens it if delivered | Narrows it slowly |
DBS expects the BoJ to tighten by 25 bp every 3-4 months. No GBP/JPY price targets from MUFG, ING, Nomura or Rabobank were found, so this reading rests on rate-path reasoning rather than a published forecast.
The policy mix still favours sterling over the yen. The margin depends on the BoE hike actually arriving, so a dovish BoE turn is the quickest route to a narrower gap. The open question is which message the market believes.
Three BoE hawks have already voted for an immediate hike while the Bank lifted its inflation peak forecast above 4%, which is why a hike before year-end is priced and a dovish turn would surprise.
Intervention risk and the UK Budget: what could break the range?
Two event risks press on the pair from opposite sides, and they work through different currencies.
The Japan side
USD/JPY is trading near 158, close to the 160 level traders watch. Japan’s Ministry of Finance has a record of verbal warnings and direct intervention when yen weakness looks excessive, which is why traders avoid large bullish GBP/JPY bets.
Intervention usually hits yen crosses with abrupt multi-yen drops. When the action is seen as limited and Japanese policy stays looser than peers, carry positions have tended to rebuild over time.
Japan’s record of direct intervention shows a pattern: bounces fade quickly when the rate differential stays intact, which is why official action has bought time rather than reversed the yen’s slide.
The UK side
The Autumn Budget lands on 28 October, a date HM Treasury confirmed in July. It is a credibility test for public finances at a time when gilt yields have hit their highest since 2007 and Bailey has flagged high borrowing costs. A poorly received Budget could push yields higher for the wrong reasons and add a risk premium to sterling.
Ranked by likelihood and speed of impact:
- Japanese intervention: fast and sharp if USD/JPY approaches 160.
- Budget shock on 28 October: dated, and capable of hitting sterling directly.
- Carry-trade unwind or global bond shock: a sudden fall in yields or volatility spike could cut the pair quickly.
- BoE pivot toward cuts: slower, but it would narrow the gap.
The takeaway is that the downside risks are sharper than the upside ones. Intervention and a fiscal shock both produce sudden moves, while carry only delivers a slow grind higher.
Reading the chart: support, resistance and the moving average ceiling
The chart maps the same standoff. A simple moving average (SMA) is the average closing price over a set number of days, and all three key averages sit above the current price. The levels below come from a source whose technical section was written with help from an AI tool, so treat them as reference points rather than certainties.
| Level | Type | Why it matters |
|---|---|---|
| 217 | Resistance | Stronger ceiling beyond the averages |
| 213.77 | 100-day SMA | Highest of the three averages |
| 213.05 | 200-day SMA | Long-term trend marker |
| 211.92 | 50-day SMA | First average bulls must reclaim |
| 210 | Resistance | Top of the range; a daily close above eases pressure |
| 207 | Support | Floor of the range |
| 205 | Support | Deeper support on a renewed decline |
Momentum is mixed. The Relative Strength Index (RSI), which measures how strong recent gains are compared with losses on a 0-100 scale, sits near 46, slightly below neutral. The Moving Average Convergence Divergence (MACD), a trend-momentum gauge, has moved into positive territory, a sign that the price is steadying rather than clearly turning higher.
The 210 cap lines up with intervention fears, and the 207 floor with carry support. Below the averages, the near-term bias stays bearish.
- Breakout above 210: a first sign of easing pressure, meaningful only if it survives the intervention and Budget risks.
- Range holds: the base case while the gap and event risks stay balanced.
- Breakdown below 207: a signal the fundamentals have started to give way, with 205 next.
These levels are reference points, not predictions. Past performance does not guarantee future results, and projections are subject to market conditions.
Where the GBP/JPY forecast hinges: levels, dates and decisions
The range reflects balanced forces rather than an absence of them. The yield gap still favours sterling, while intervention risk, the Budget and the moving averages cap the upside.
Three checkpoints should shape your view. The 28 October Budget tests sterling directly. The next BoE and BoJ communications will show whether the gap holds. Any drift in USD/JPY toward 160 raises the odds of a sharp yen move.
On the chart, a sustained close above 210 would suggest carry is winning, while a break below 207 would suggest the event risks have taken over.
This article is for informational purposes only and should not be considered financial advice. Investors should conduct their own research and consult with financial professionals before making investment decisions. Forward-looking statements are speculative and subject to change based on market developments.