
The US jobs report missed badly, with payrolls up just 29,000 and unemployment rising to 4.2%, yet the US Dollar Index (DXY) is trading near 102.30, its strongest level since April 2025. Many readers will take that as a contradiction, but weak US data does not automatically mean a weaker dollar.
The index measures the dollar against a basket of other currencies, so it moves on what is happening elsewhere as much as at home. French fiscal worries are weighing on the euro, and tensions in the Middle East and Ukraine are adding to demand for safe assets.
A busy week lies ahead, with the ISM Services PMI and the Federal Open Market Committee (FOMC) Minutes both due.
This Dollar Index analysis gives you a working model for how data, rate expectations, geopolitics and technicals combine to move a currency, plus a short watchlist for the week.
Why is the dollar rising when the jobs report was weak?
On paper, the dollar should have fallen. Instead, the index recovered from a post-data dip on Friday and started the week at a 17-month high.
What the jobs report actually showed
The Bureau of Labor Statistics (BLS) report for September, released on 2 October 2026, was soft across the board:
- Nonfarm payrolls rose by 29,000.
- Unemployment rose unexpectedly to 4.2%.
- Average hourly earnings gained 0.1% on the month to $37.81, or 3.0% year on year.
- July and August were revised down by a combined 60,000.
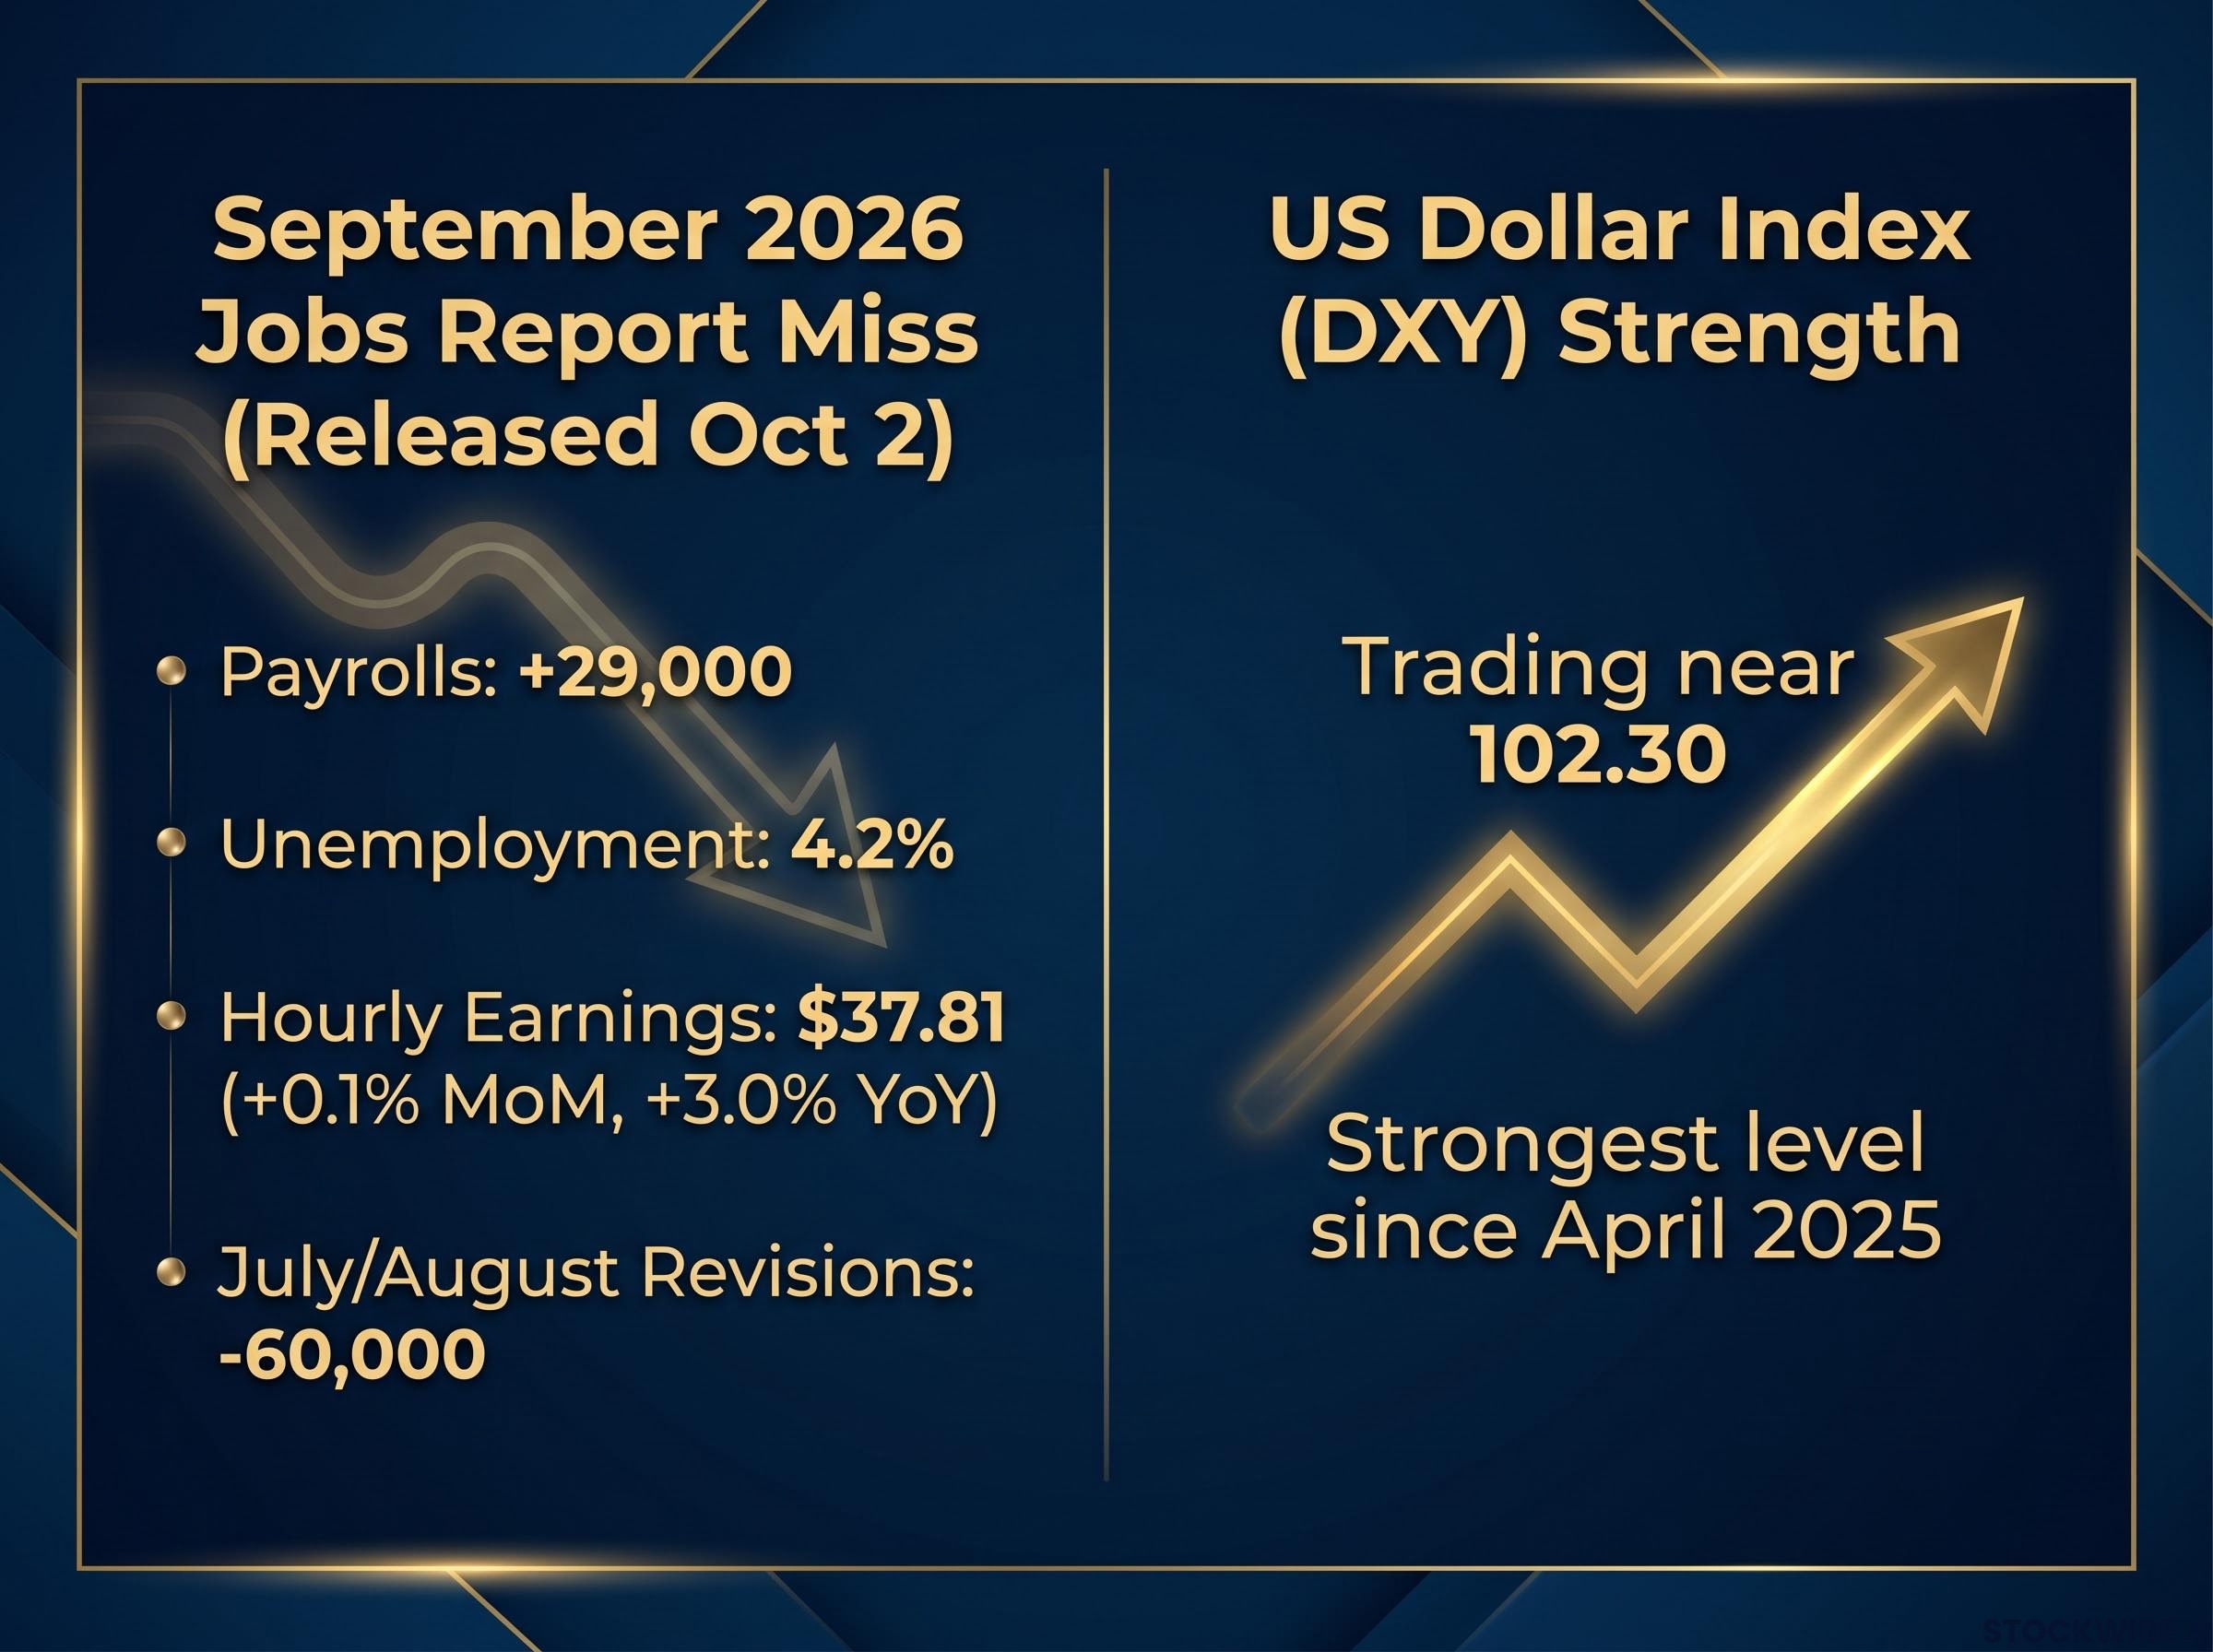
The miss is real. But it was not enough to break the broader story of relative US strength, and Treasury yields retreated from multi-year highs after the report without collapsing the dollar’s support.
Where the dollar gained ground
The DXY traded around 102.30 in the early European session on Monday, up about 0.35%, within an intraday range of roughly 101.88 to 102.54. The prior close was near 101.93. Reuters cited 101.97, a gap that likely reflects timing within the session.
The euro did most of the work. The dollar gained about 0.46% against it as French fiscal worries kept the single currency on the back foot.
| Currency pair | USD move | Direction |
|---|---|---|
| USD/EUR | +0.46% | Dollar stronger |
| USD/NZD | +0.45% | Dollar stronger |
| USD/GBP | +0.12% | Dollar stronger |
| USD/JPY | -0.09% | Dollar weaker |
| USD/AUD | -0.12% | Dollar weaker |
What this tells you is that the move is about relative weakness. Judge currency reactions on a relative basis, because a poor US print can still leave the dollar standing tallest when the alternatives look worse.
When big ASX news breaks, our subscribers know first
How do rate expectations, real yields and safe-haven flows move the dollar?
Three separate supports can hold a currency up at once. A single weak data point only dents one of them.
Three forces behind a strong dollar
- Rate differentials. Investors chase the higher return, so expectations of higher US interest rates lift US asset yields relative to other currencies. CME FedWatch shows an over 85% probability of a Fed hike by year-end, even though odds of a move this month receded after the jobs data.
- Real yields. A real yield is the return on a bond after subtracting expected inflation. When nominal yields stay elevated and inflation expectations stay contained, real yields remain high and draw global capital.
- Safe-haven and relative-risk flows. Investors move into Treasuries and cash when the world looks unstable. Iran’s foreign minister, Abbas Araghchi, said there is no military solution but Tehran is prepared to resume fighting, and parliament speaker Mohammad Bagher Ghalibaf said the Strait of Hormuz stays closed until Israel’s conditions are met. Russian air strikes also hit the Kyiv region, Kharkiv and Dnipro.
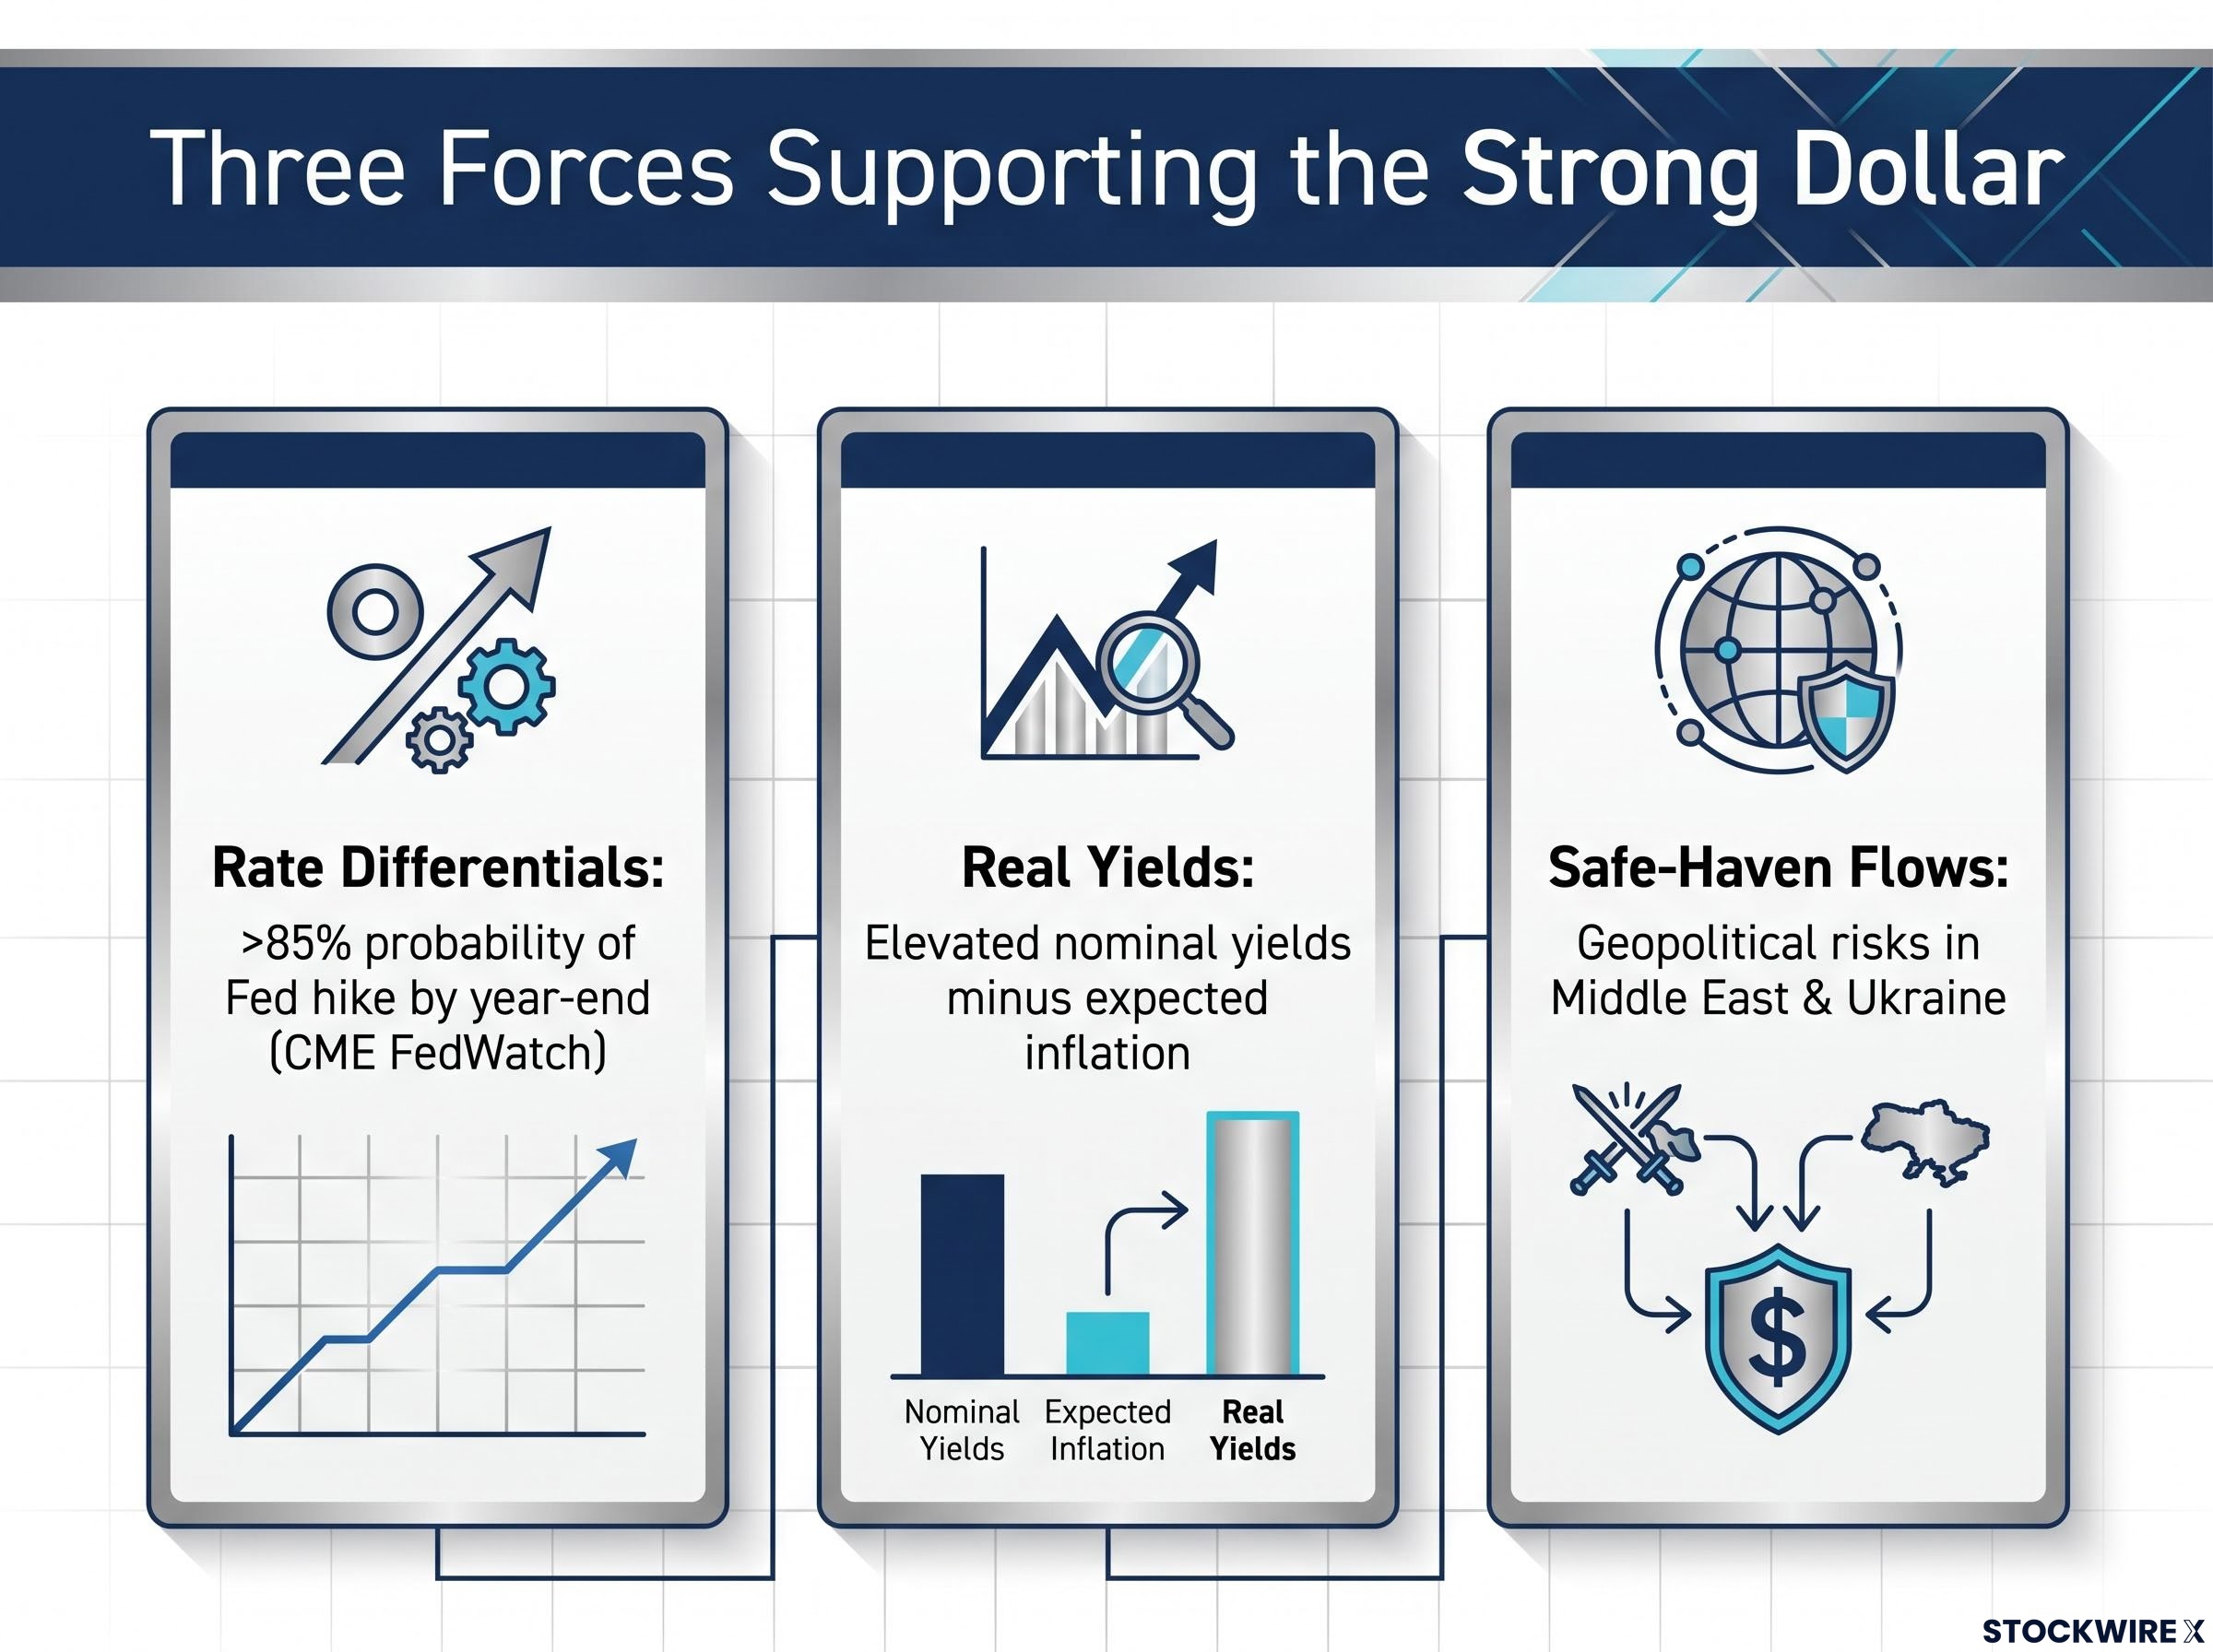
Key takeaway The dollar’s strength reflects relative-risk dynamics more than confidence in the jobs report.
No named strategist was found directly linking the jobs weakness to dollar strength, so treat this mechanism as analytical inference rather than attributed opinion.
Where analysts disagree
One camp argues that inflation pressure means even weak jobs data may not stop the Fed staying restrictive, which supports the dollar. Another reads weak payrolls and rising unemployment as a sign the Fed must eventually pivot, which would cap it.
A second split is structural versus cyclical. Structural views stress the dollar’s role as the dominant reserve and invoicing currency, while cyclical views tie the strength to this phase of the monetary and geopolitical cycle, with a reversal expected once other regions stabilise or the Fed eases.
What do the charts say, and what could knock the dollar off its highs?
The chart favours the bulls, but the momentum behind it is stretched.
The technical case
According to FXStreet analysis (its technical section was AI-assisted), the DXY broke last week above a horizontal resistance zone of 101.60-101.70. That zone is now seen as support, so pullbacks are likely to draw buyers and stay limited near it.
The 14-period Relative Strength Index (RSI), a momentum gauge, is above 70. That signals a stretched but buyer-dominated rally; readings of roughly 74-76 have been cited, though those are less certain.
Traders often pair the RSI with the 20-day EMA, which acts as dynamic support in a healthy uptrend, and the index’s heavy euro weighting means these signals mostly reflect developed-market dollar strength.
An overbought reading means small negative surprises can trigger outsized reversals. It argues for caution about chasing the move, not for abandoning the trend.
Four ways the rally could stall
- Overbought momentum: speculative longs unwind sharply.
- Fed communication and data risk: Minutes stressing labour-market or global risks cut hike expectations.
- Geopolitical de-escalation: safe-haven demand fades.
- Stagflation and policy credibility: weak growth plus persistent inflation complicates the Fed’s response.
| Risk | Trigger | Effect on DXY |
|---|---|---|
| Overbought momentum | Dovish Minutes or weak ISM Services PMI | Sharp mean reversion |
| Fed and data events | Minutes on **Wednesday 7 October**; ISM on **Monday 5 October** | Lower hike expectations |
| De-escalation | Easing in the Middle East or Ukraine | Less safe-haven demand |
| Stagflation risk | Weak growth with sticky inflation | Erosion of confidence in US policy |
No consensus forecast for the ISM Services PMI was found, and no named commentators were found stressing these caveats, so they stand as analytical risks. These statements are speculative and subject to change based on market developments.
Has the dollar done this before, and what should you watch this week?
It has, and the episodes tend to end the same way.
Four precedents
| Episode | Driver of dollar strength | What ended it |
|---|---|---|
| Eurozone debt crisis (2010-2012) | Euro-area sovereign risk and safe-haven flows | ECB backstops such as OMT, fiscal consolidation |
| 2013-2015 tightening expectations | Fed shift from QE toward hikes | End of the initial hiking cycle; other central banks normalising |
| March 2020 | Global dash for cash | Swap lines, QE, fiscal stimulus |
| Early 2022 | Geopolitical risk and commodity spikes | Focus returned to Fed versus ECB policy |
The pattern is consistent. Strength driven by foreign weakness and risk aversion fades when the foreign risk narrative improves, or when Fed communication turns dovish enough to reprice US rates. Those two conditions are what you should monitor.
The week-ahead watchlist
- ISM Services PMI, due Monday 5 October.
- FOMC Minutes, due Wednesday 7 October; traders may wait for them before adding positions.
- FOMC speakers, for any shift in tone on hikes.
- Middle East and Ukraine developments, for changes in safe-haven demand.
What this rally tells you, and the signals that would change the picture
The dollar’s 17-month high rests on euro weakness, hike expectations and safe-haven demand, not on the jobs report. That makes it sensitive to a change in any one of those supports.
Three signals would shift the balance: dovish FOMC Minutes, a weak ISM Services PMI and geopolitical de-escalation. Treat these as things to watch, not predictions.
The practical approach is to read this as a relative-strength story and judge each new data point against that framing.
This article is for informational purposes only and should not be considered financial advice. Investors should conduct their own research and consult with financial professionals before making investment decisions. Past performance does not guarantee future results. Financial projections are subject to market conditions and various risk factors.