
Sterling slipped to its weakest point in roughly 12 weeks against the US Dollar on Wednesday, sinking to the 1.3272 area shortly after the release of September’s flash business activity figures. The data itself was not uniformly bad. Manufacturing actually beat expectations. It still was not enough to arrest the slide.
That is the story worth understanding. The GBP/USD exchange rate fell on a day that produced a genuine positive on the factory floor, which tells you the drag came from somewhere else entirely.
The 23 September 2026 flash Purchasing Managers’ Index (PMI) release from S&P Global was a split decision: manufacturing rose to a three-month high while services and the composite reading both cooled more than forecast. In a services-dominated economy, currency markets sided with the miss, and they did so almost immediately.
Here is what the split between a rising factory reading and a cooling services sector actually tells you about where the pound is heading, and why the manufacturing upside barely registered.
Sterling drops to a 12-week low as selling pressure accelerates
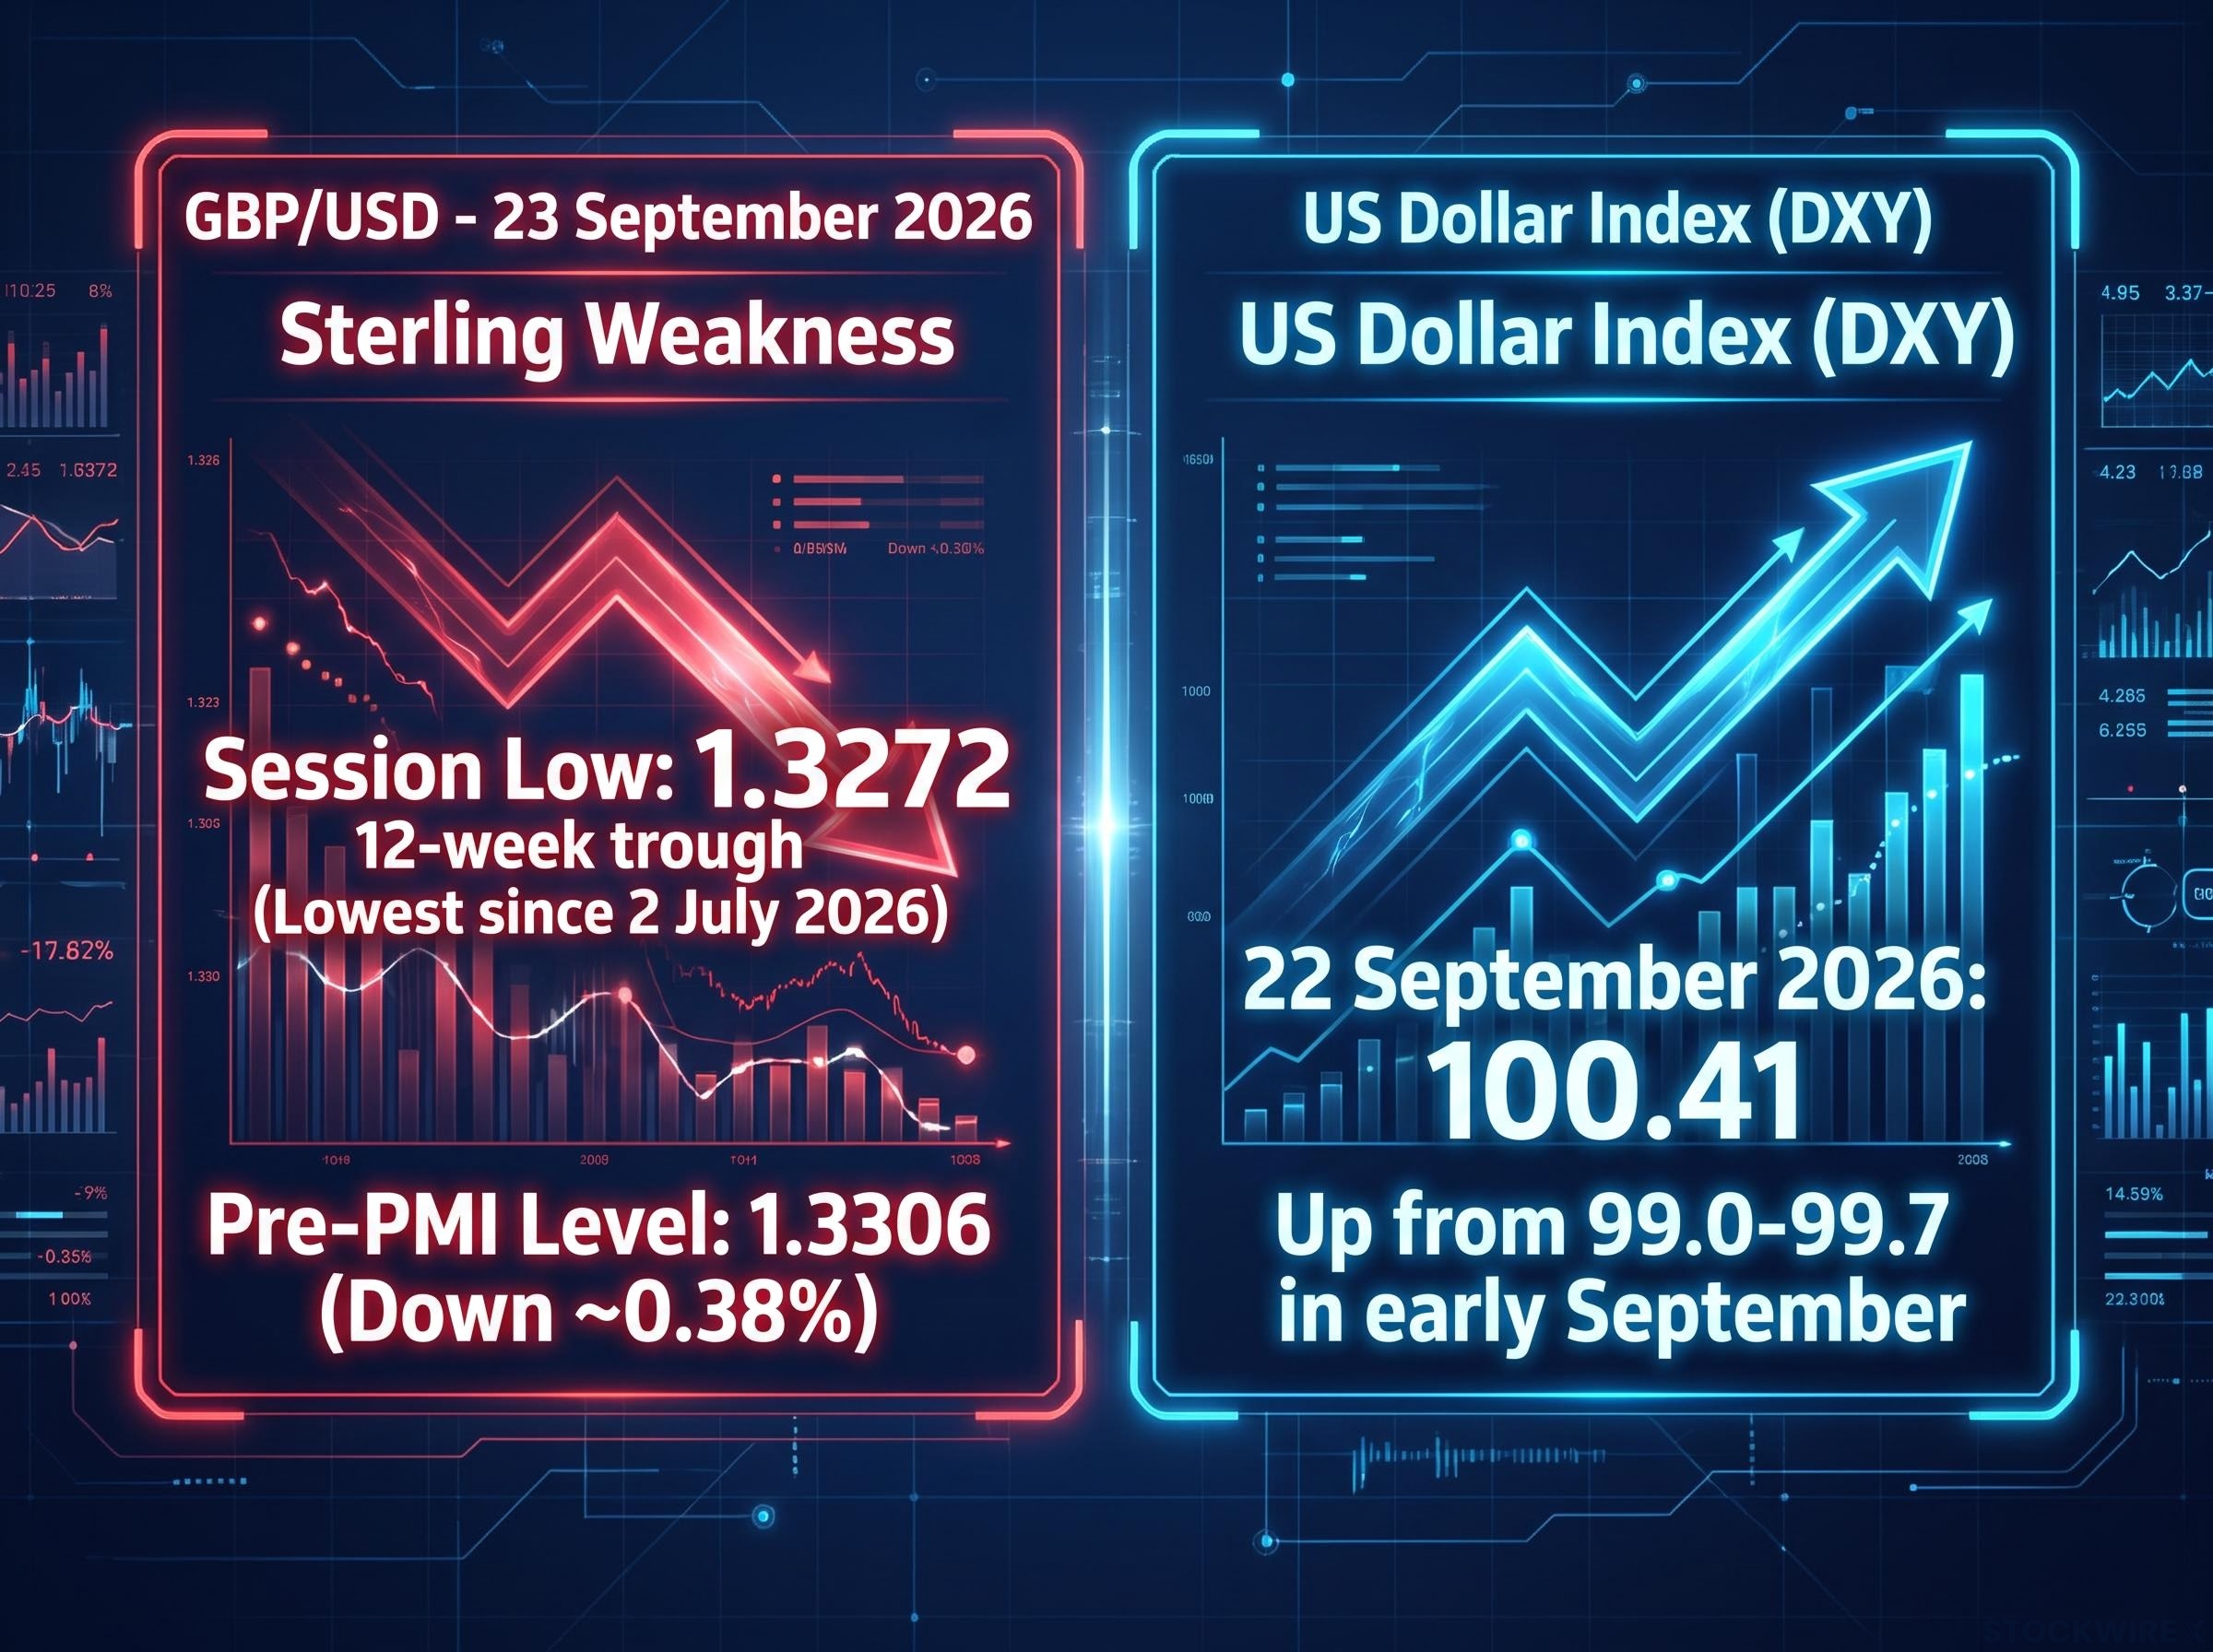
The hard number first: GBP/USD traded just above 1.3272 on Wednesday, its lowest level since 2 July 2026. That is a 12-week trough, and it arrived after a session that built momentum rather than snapping lower in a single moment.
At the time of the PMI release, the pair sat around 1.3306, already down roughly 0.38% on the day. From there it ground lower toward the July low zone as the data sank in and dollar demand held firm.
The intraday shape matters here. These were the levels that defined the session:
- Pre-PMI level: approximately 1.3306, down around 0.38% on the day
- Session low: approximately 1.3272, the weakest since 2 July 2026
- Estimated session range: approximately 1.3345 high to 1.3285 low (estimated figures, not independently confirmed)
The selling was not purely a UK story. The US Dollar Index (DXY), which measures the greenback against a basket of major currencies, had been firming for weeks before the PMI print landed. Trading Economics data put the DXY at 100.41 on 22 September 2026, up from a range of roughly 99.0-99.7 in early September, with the index estimated to have traded near 100.4-100.8 by 22-23 September.
The DXY breakout above 100 in mid-September was driven by three simultaneous forces: a unanimous Fed rate hike to 3.75-4.00%, a 30-basis-point dot-plot revision, and Middle East geopolitical risk, each of which continued to press on GBP/USD through the week ending 23 September.
TMGM captured the tone of the day plainly.
GBP/USD was “accelerating its decline” against the US Dollar, revisiting a 12-week low zone last seen in early July 2026.
That framing is the point. Sterling was already leaning lower on a firming dollar, and the services disappointment simply added fuel to a move that was underway. For anyone holding sterling-denominated assets, this is the read to take: the pound faced two separate forces at once, a UK-specific data letdown and a broader dollar bid, which is precisely why a manufacturing beat could not manufacture a recovery.
What the PMI data actually showed, and why the services miss was the one that mattered
Start with the good news, because there was some. Manufacturing PMI rose to 52.0 in September’s flash reading, up from 51.7 in August and comfortably ahead of the 51.6 consensus. S&P Global described it as a three-month high, supported by domestic orders.
Then the picture turns. Services activity, the business activity index, slipped to 51.7 from 52.5 in August, missing the 52.0 forecast and marking a three-month low. The composite output index told the same story, falling to 51.7 from 52.5, also below the 52.0 expected.
| Indicator | September 2026 (Flash) | August 2026 | Consensus | vs. Expectation |
|---|---|---|---|---|
| Manufacturing PMI | 52.0 | 51.7 | 51.6 | Beat (three-month high) |
| Services PMI | 51.7 | 52.5 | 52.0 | Missed (three-month low) |
| Composite PMI | 51.7 | 52.5 | 52.0 | Missed (three-month low) |
A PMI reading above 50.0 signals expansion, below it contraction. All three indices stayed above that line, so the economy is still growing. The question is by how much, and the answer is not much.
S&P Global’s commentary, cited by Newsquawk and ActionForex, put it in stark terms: the combined survey readings are consistent with quarterly UK GDP growth of only around 0.1% quarter-on-quarter. That is the figure to carry away from this section. The economy is expanding, but only just, and that is what softened expectations for tighter Bank of England policy and, by extension, for Sterling.
Why services data moves the pound more than manufacturing
The UK economy is heavily service-based. Services account for the large majority of national output and employment, which makes the composite PMI, dominated by services, the cleanest proxy markets have for overall growth momentum.
The link to Sterling runs through interest rates. Softer services and composite activity reduces the perceived need for the Bank of England to keep policy tight, which lowers UK interest-rate expectations and shrinks the yield advantage that supports the pound against the dollar.
Bank of England policy transmits to sterling primarily through the rate-expectations channel: when services and composite PMI readings soften, markets reprice the probability of future hikes lower, which compresses the yield differential that supports the pound against the dollar.
Manufacturing’s improvement was real, but it was driven by domestic orders in a sector that contributes a smaller slice of total output. It simply does not carry the same weight in the central bank’s thinking, which is why a genuine factory beat was overwhelmed by a services slowdown.
Context, caveats, and what comes next for Sterling
The headwinds are real, but one flash print is not a verdict. A few things should temper any strong directional conclusion drawn from Wednesday’s numbers.
First, there is a geopolitical overlay. The Independent’s 23 September 2026 coverage linked September’s cost pressures directly to the Iran war and the associated energy-price inflation, a supply-side shock that can suppress activity and lift input costs at the same time. That muddies the reading of the data as a pure domestic demand signal.
Second, these are flash estimates. Newsquawk and ActionForex noted that the figures rest on partial survey responses and are subject to revision when full-sample data arrive later this month, so trading on the first print alone carries revision risk.
S&P Global estimated the combined readings imply UK GDP growth of only around 0.1% quarter-on-quarter, weak but still positive, not a contraction.
That floor matters. It keeps the bearish case honest: the economy is slowing, not collapsing.
The UK GDP trajectory matters here because the PMI’s implied 0.1% quarterly growth figure sits in sharp contrast to July’s 0.4% monthly GDP beat, a divergence that makes it harder to read September’s services slowdown as a durable trend rather than a single-month distortion.
The dollar side of the equation is worth watching too. The DXY’s climb from roughly 99.0-99.7 in early September to near 100.4-100.8 by 22-23 September is a multi-week trend, not a one-day quirk, and it will keep pressing on GBP/USD independent of UK fundamentals. An Investing.com analysis dated 16 September 2026 also flagged gilt-market stress and a fiscal-risk premium as structural negatives for Sterling, though those specific claims are not independently confirmed.
For anyone tracking the pound, the discipline here is simple: watch the dashboard, not a single reading. These are the releases that will confirm or challenge September’s softness:
- UK labour-market statistics, which feed directly into rate expectations
- CPI inflation prints, given the cost pressures flagged in the survey
- Final PMI revisions and any developments in gilt-market or fiscal conditions
Reacting hard to one flash print, in either direction, is premature. Whether October’s data confirm or reverse this month’s cooling is the real question.
What the September PMI split changes about the Sterling picture, and what it does not
Wednesday’s data confirms a coherent story. Services activity is decelerating, the composite reading sits at a three-month low of 51.7, and the implied growth trajectory of roughly 0.1% quarter-on-quarter points to less pressure on the Bank of England to tighten. All of that logically supports a softer pound near-term, and the move to 1.3272, a 12-week low, is the market’s verdict on the day.
What it does not settle is just as important. It does not tell you whether the services miss is a durable trend or a one-month distortion driven by the Iran conflict’s energy-cost spillover. It does not tell you whether the dollar’s firming continues. And it does not resolve whether gilt-market stress deepens or fades.
The pound’s weakness has a structural explanation, then, but the next real directional move will be decided by the October data calendar, in this order of relevance:
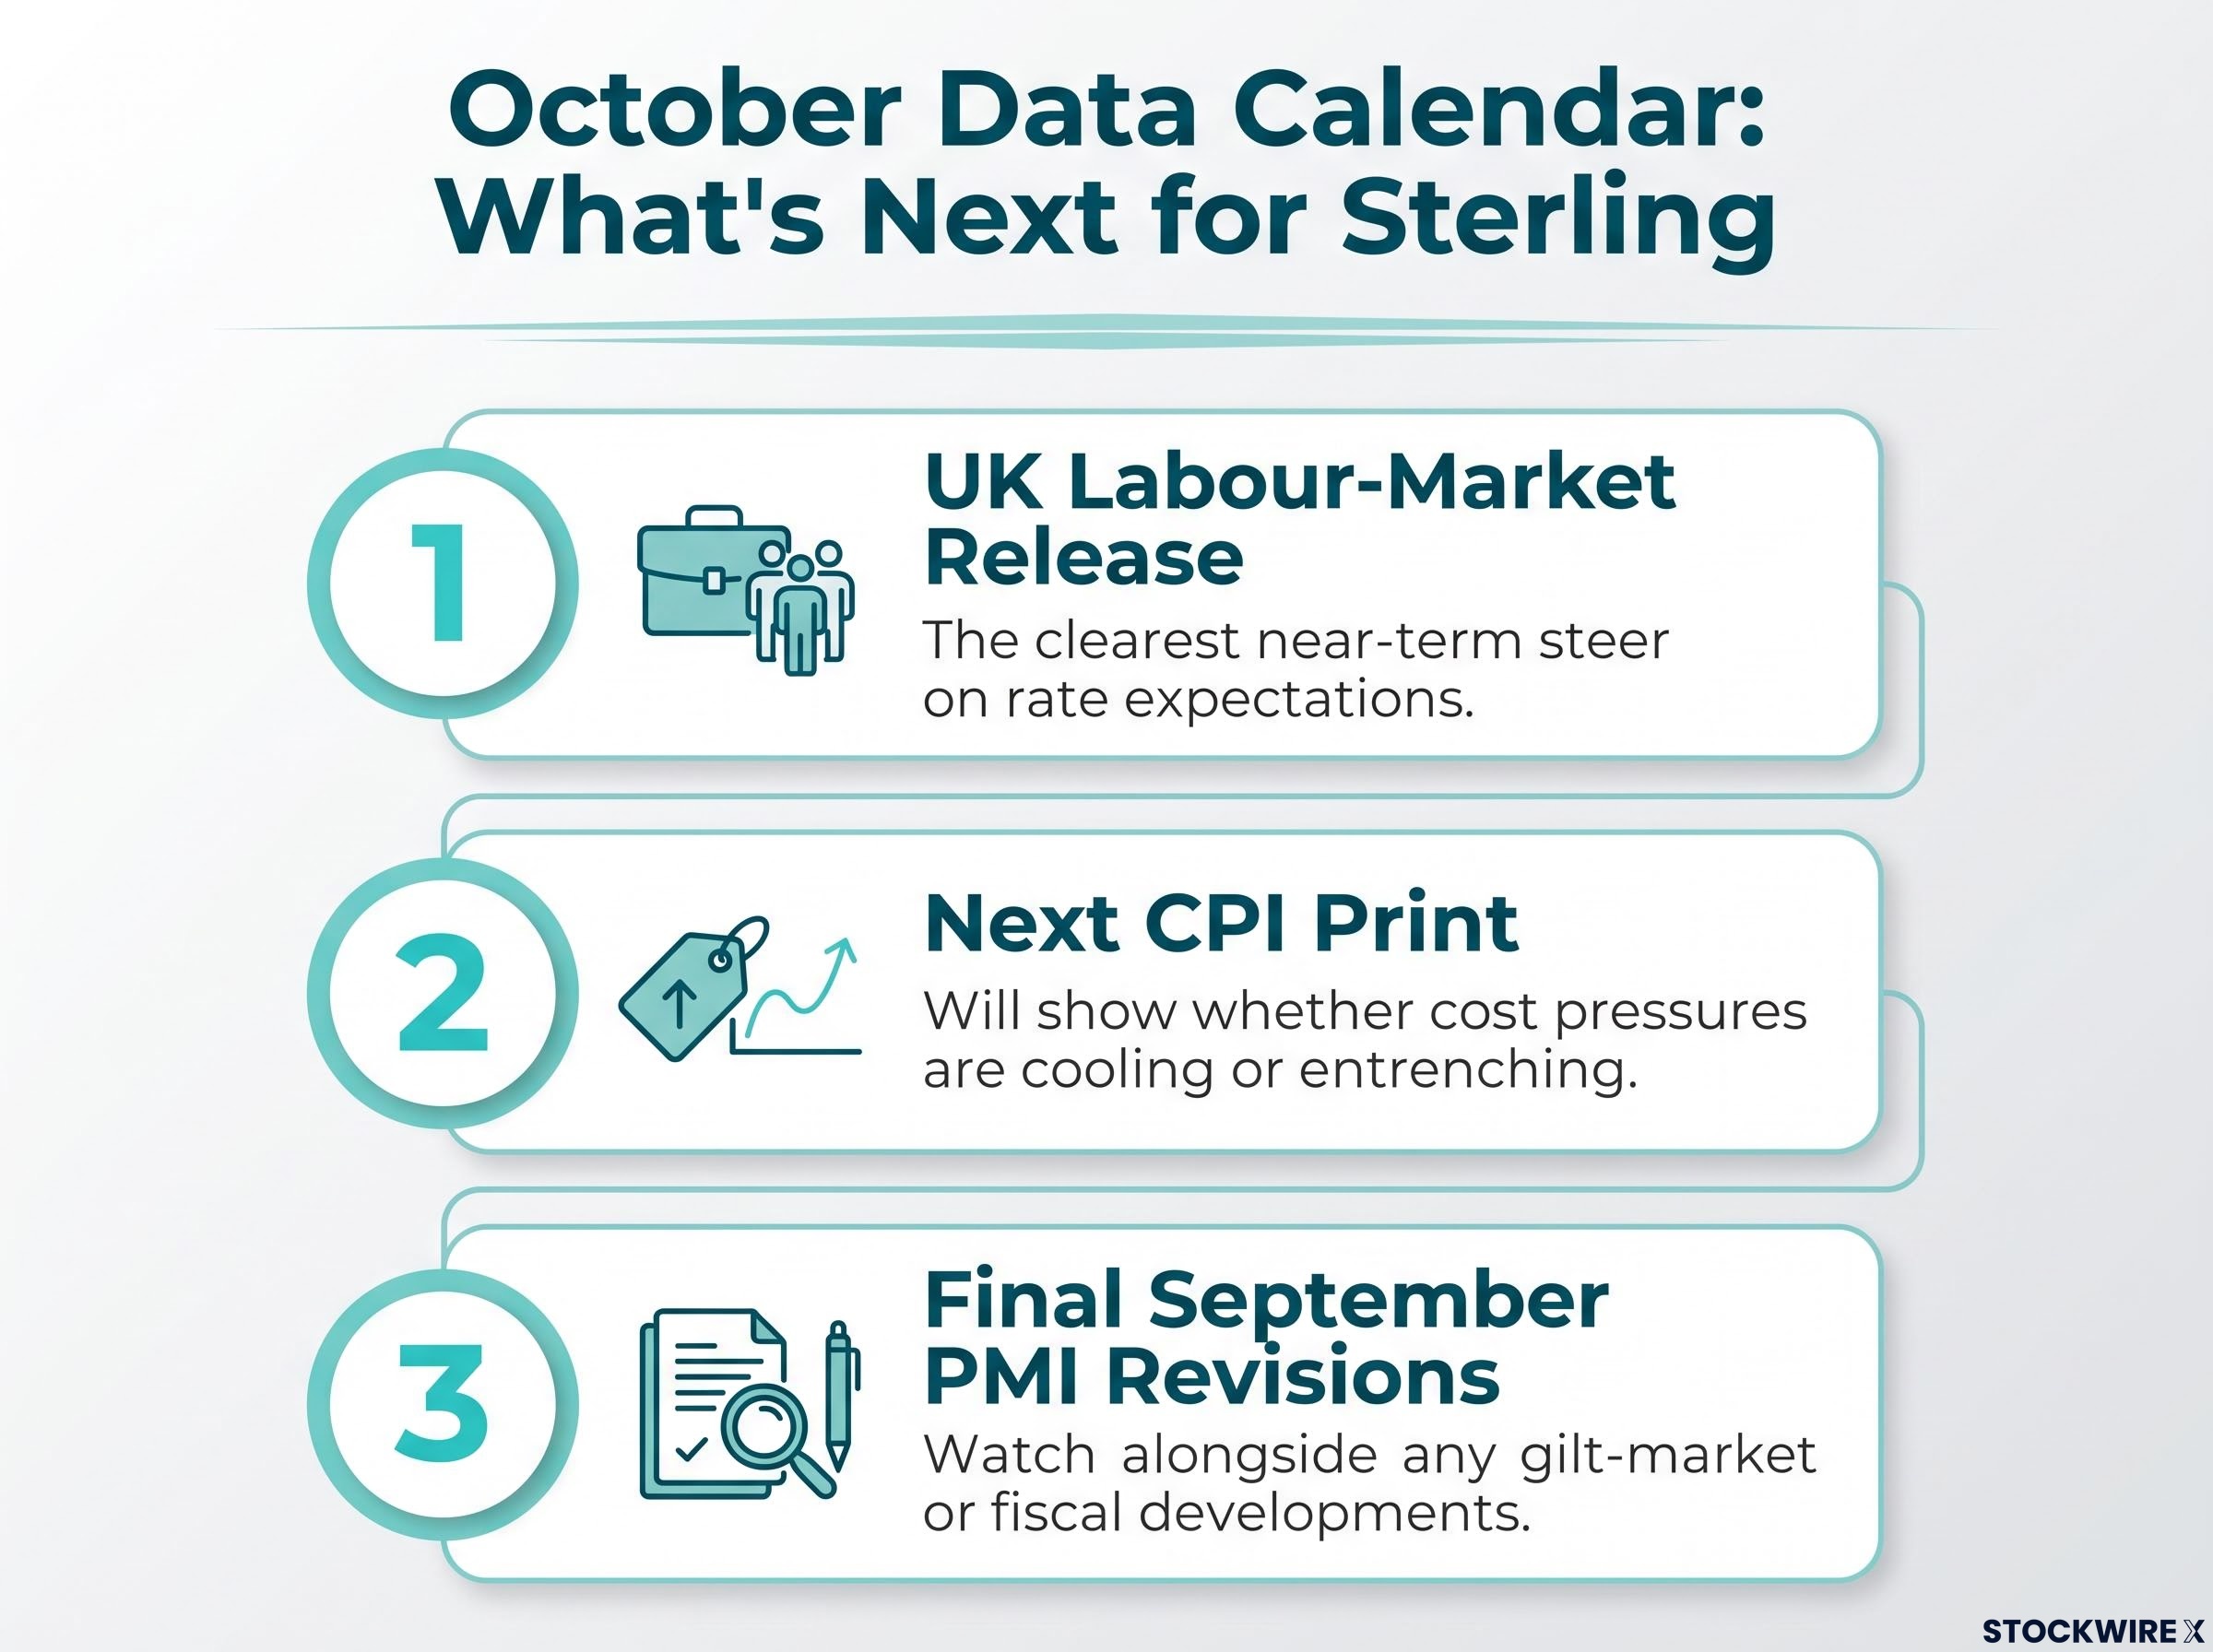
- The UK labour-market release, the clearest near-term steer on rate expectations
- The next CPI print, which will show whether cost pressures are cooling or entrenching
- Final September PMI revisions, plus any gilt-market or fiscal developments
Read September as a signal to monitor, not a conclusion to trade.
For readers wanting to understand why positive UK data so often fails to lift sterling, our full explainer on GBP/USD and the priced-in data problem examines the four overlapping FX mechanisms, including crowded positioning and rate-path dominance, that can overwhelm even genuine beats.
This article is for informational purposes only and should not be considered financial advice. Investors should conduct their own research and consult with financial professionals before making investment decisions. Past performance does not guarantee future results, and financial projections are subject to market conditions and various risk factors.