
Not every asset bends the same way under a hawkish central bank. That assumption is being tested right now, and the results are strange enough to reward a closer look.
As of late September 2026, the Federal Reserve is holding its target range at a multi-year high, and the effect on traditional markets is exactly what the textbooks would predict: gold is buckling, the Japanese yen is being crushed, and the Australian dollar is scraping along its lows.
Then there is Bitcoin, which is doing the opposite of everything. It is rallying to fresh highs while the same policy backdrop flattens every conventional store of value around it.
That contradiction is the heart of this piece. Understanding how Fed policy expectations ripple across asset classes, and why one asset is escaping the pull entirely, gives you a working framework for reading capital flows. Here is how a single macroeconomic driver dictates where money goes across four very different markets, and where that alignment is most likely to crack.
How Federal Reserve dominance dictates global capital flow
Start with the one number that sets the tone for everything else. The Federal Reserve raised its target range by 25 basis points to 3.75-4.00% at its mid-September meeting, and the message accompanying the hike was blunt: inflation remains uncomfortably high, and the restrictive stance stays.
According to TMGM’s 18 September analysis, the Fed warned that inflation is too high for a long time, signalling a higher-for-longer path rather than any pivot to easing. That framing matters more than the hike itself.
Here is the mechanism that turns a policy rate into global capital movement. When US rates sit at multi-year highs and the central bank keeps warning about inflation, real yields stay elevated. A real yield is the return you earn after subtracting inflation, and it represents the opportunity cost of holding an asset that pays you nothing at all.
Fed rate transmission operates through yield differentials that attract foreign capital into dollar-denominated assets, but the mechanism breaks down when hikes are already fully priced in or when stronger growth abroad offsets the yield advantage, which is why the headline rate number alone rarely tells the full story.
Gold pays no interest. Neither does cash under a mattress. When you can earn close to 4% in US dollar instruments while inflation is being actively suppressed, the cost of parking money in a non-yielding asset climbs. That single dynamic is why capital drifts toward dollar assets and away from everything that does not generate a yield.
The second mechanism is the rate differential, and this is where the yen enters the story. With the Fed at 3.75-4.00% and the Bank of Japan at just 1.25%, the gap between the two policy rates sits at roughly 2.6 percentage points in favour of the US dollar, according to EBC forex analysis.
That gap powers what traders call the carry trade: borrowing in a low-yielding currency like the yen and parking the proceeds in a higher-yielding one like the dollar. The wider the differential, the more compelling the trade, and the more relentless the downward pressure on the funding currency.
Carry trade mechanics are the engine behind yen weakness: leveraged positions funded in low-yielding yen and parked in higher-yielding dollar assets sit across global equities, bonds, and emerging-market instruments, meaning any sustained BoJ normalisation carries cross-asset implications well beyond the currency pair itself.
The anchor of the current regime A hawkish Federal Reserve holding rates at 3.75-4.00%, paired with a 2.6 percentage point rate advantage over Japan, is the gravitational centre pulling global capital toward US dollar assets. Every other move across gold, the yen, and the Australian dollar traces back to this.
Grasping this interest rate architecture gives you the baseline you need before you judge any single position. It tells you exactly why capital is flowing forcefully toward the dollar, and it turns the asset moves that follow from random price action into something that looks close to inevitable.
When big ASX news breaks, our subscribers know first
The traditional squeeze across gold, the yen, and the Australian dollar
If the Fed is the gravity, gold, the yen, and the Australian dollar are the three objects falling toward it. Each is under pressure for its own local reasons, but the common thread is a dollar that simply outmuscles everything in its path.
Gold has been the cleanest illustration. Spot prices fluctuated near the $4,300 to $4,363.75 range through September 2026, with FXStreet reporting the metal approaching $4,300 as dollar strength drew capital out of the non-yielding asset. TMGM tied the pressure directly to the Fed’s inflation warnings, which keep real yields elevated and raise the opportunity cost of holding bullion.
The yen tells a more dramatic story, because on paper it should have strengthened. The Bank of Japan raised its short-term rate to 1.25% from 1.00% in a 7-to-2 vote, the highest level since 1995, according to FXStreet and TradingEconomics.
A rate hike of that historical weight would normally support a currency. It did not. USD/JPY pushed up to the 156.7 to 158.0 range, with Reuters reporting the dollar rising as much as 1.3% to a two-week high near 158.05 yen after the decision. The 2.6 percentage point gap swamped the modest Japanese tightening.
The Australian dollar is caught in a different kind of vice. AUD/USD tested the 0.7100 to 0.7218 levels through the month, with FXStreet noting renewed selling pressure as the country’s flash PMI figures revealed the manufacturing sector had fallen into contraction territory while services growth remained sluggish for the second month running.
That leaves the Reserve Bank of Australia with far less room than the Fed. Weak domestic data argues against aggressive tightening, while a strong dollar punishes any move toward easing. The result is a currency squeezed from both sides.
| Asset class | Mid-September 2026 level | Primary macro headwind | Local policy constraint |
|---|---|---|---|
| Gold (spot) | $4,300 to $4,363.75 | Elevated US real yields and strong USD | Not applicable |
| USD/JPY | 156.7 to 158.0 | 2.6pp US-Japan rate differential | BoJ at 1.25%, gap still too wide to close |
| AUD/USD | 0.7100 to 0.7218 | Broad US dollar strength | Weak PMIs limit RBA’s room to move |
The takeaway is uncomfortable but clear. Three distinct assets, three different sets of local circumstances, and one dominant force overwhelming all of them. What this tells you is that fighting the prevailing dollar trend without a specific catalyst is a low-probability bet right now.
Why historical policy shifts are failing to move the needle
The BoJ’s 1.25% rate is its highest in more than three decades, yet the market treated it as almost irrelevant. That gap between the historical significance of the move and the muted reaction is the tell.
RoboForex’s forecast, pointedly titled around the hike failing to support the yen, projected USD/JPY heading toward 159.17, framing the Japanese tightening as too small to offset carry-trade flows. Reuters echoed the point, noting the hike did not lift the yen because traders saw no explicitly hawkish guidance to follow.
Currency traders are not ignoring Japan out of carelessness. They are doing the arithmetic. A 1.25% Japanese rate against a near-4% US rate still leaves a chasm, and until that chasm narrows, nominal milestones in Tokyo count for very little.
Bitcoin ignores the macro gravity on institutional inflows
Everything to this point has followed the logic of the dollar. Now comes the asset that refuses to.
Bitcoin traded in the $81,000 to $87,000 range through mid-to-late September 2026, gaining roughly 6% in a single week, according to FXStreet, which reported it above $86,000. In an environment where non-yielding assets are being punished by high real yields, that behaviour makes no textbook sense at first glance.
The explanation is not retail speculation. It is plumbing. Spot Bitcoin exchange-traded funds, regulated products that let institutions buy Bitcoin exposure through ordinary brokerage accounts, pulled in extraordinary volumes of capital.
Institutional bitcoin accumulation has evolved into engineered treasury structures, with 195 public entities holding approximately 1.23 million BTC as of September 2026, a shift that helps explain why ETF inflow patterns look more like systematic balance-sheet allocation than opportunistic retail speculation.
The scale of the accumulation is the story:
- 22 September 2026: Combined ETF inflows exceeded $1 billion, the largest single-day haul since October 2025, according to 24/7 Wall St citing Bloomberg’s Eric Balchunas, with The Block recording $998.95 million and Bitcoin briefly surging above $87,000.
- Earlier that week: FXStreet reported inflows exceeding $714 million on a single Tuesday session.
- 18 September 2026: Investors added $433 million to spot Bitcoin ETFs, per The Block and IG.
- 3 September 2026: IG highlighted a $730.9 million single-day inflow near the start of the month.
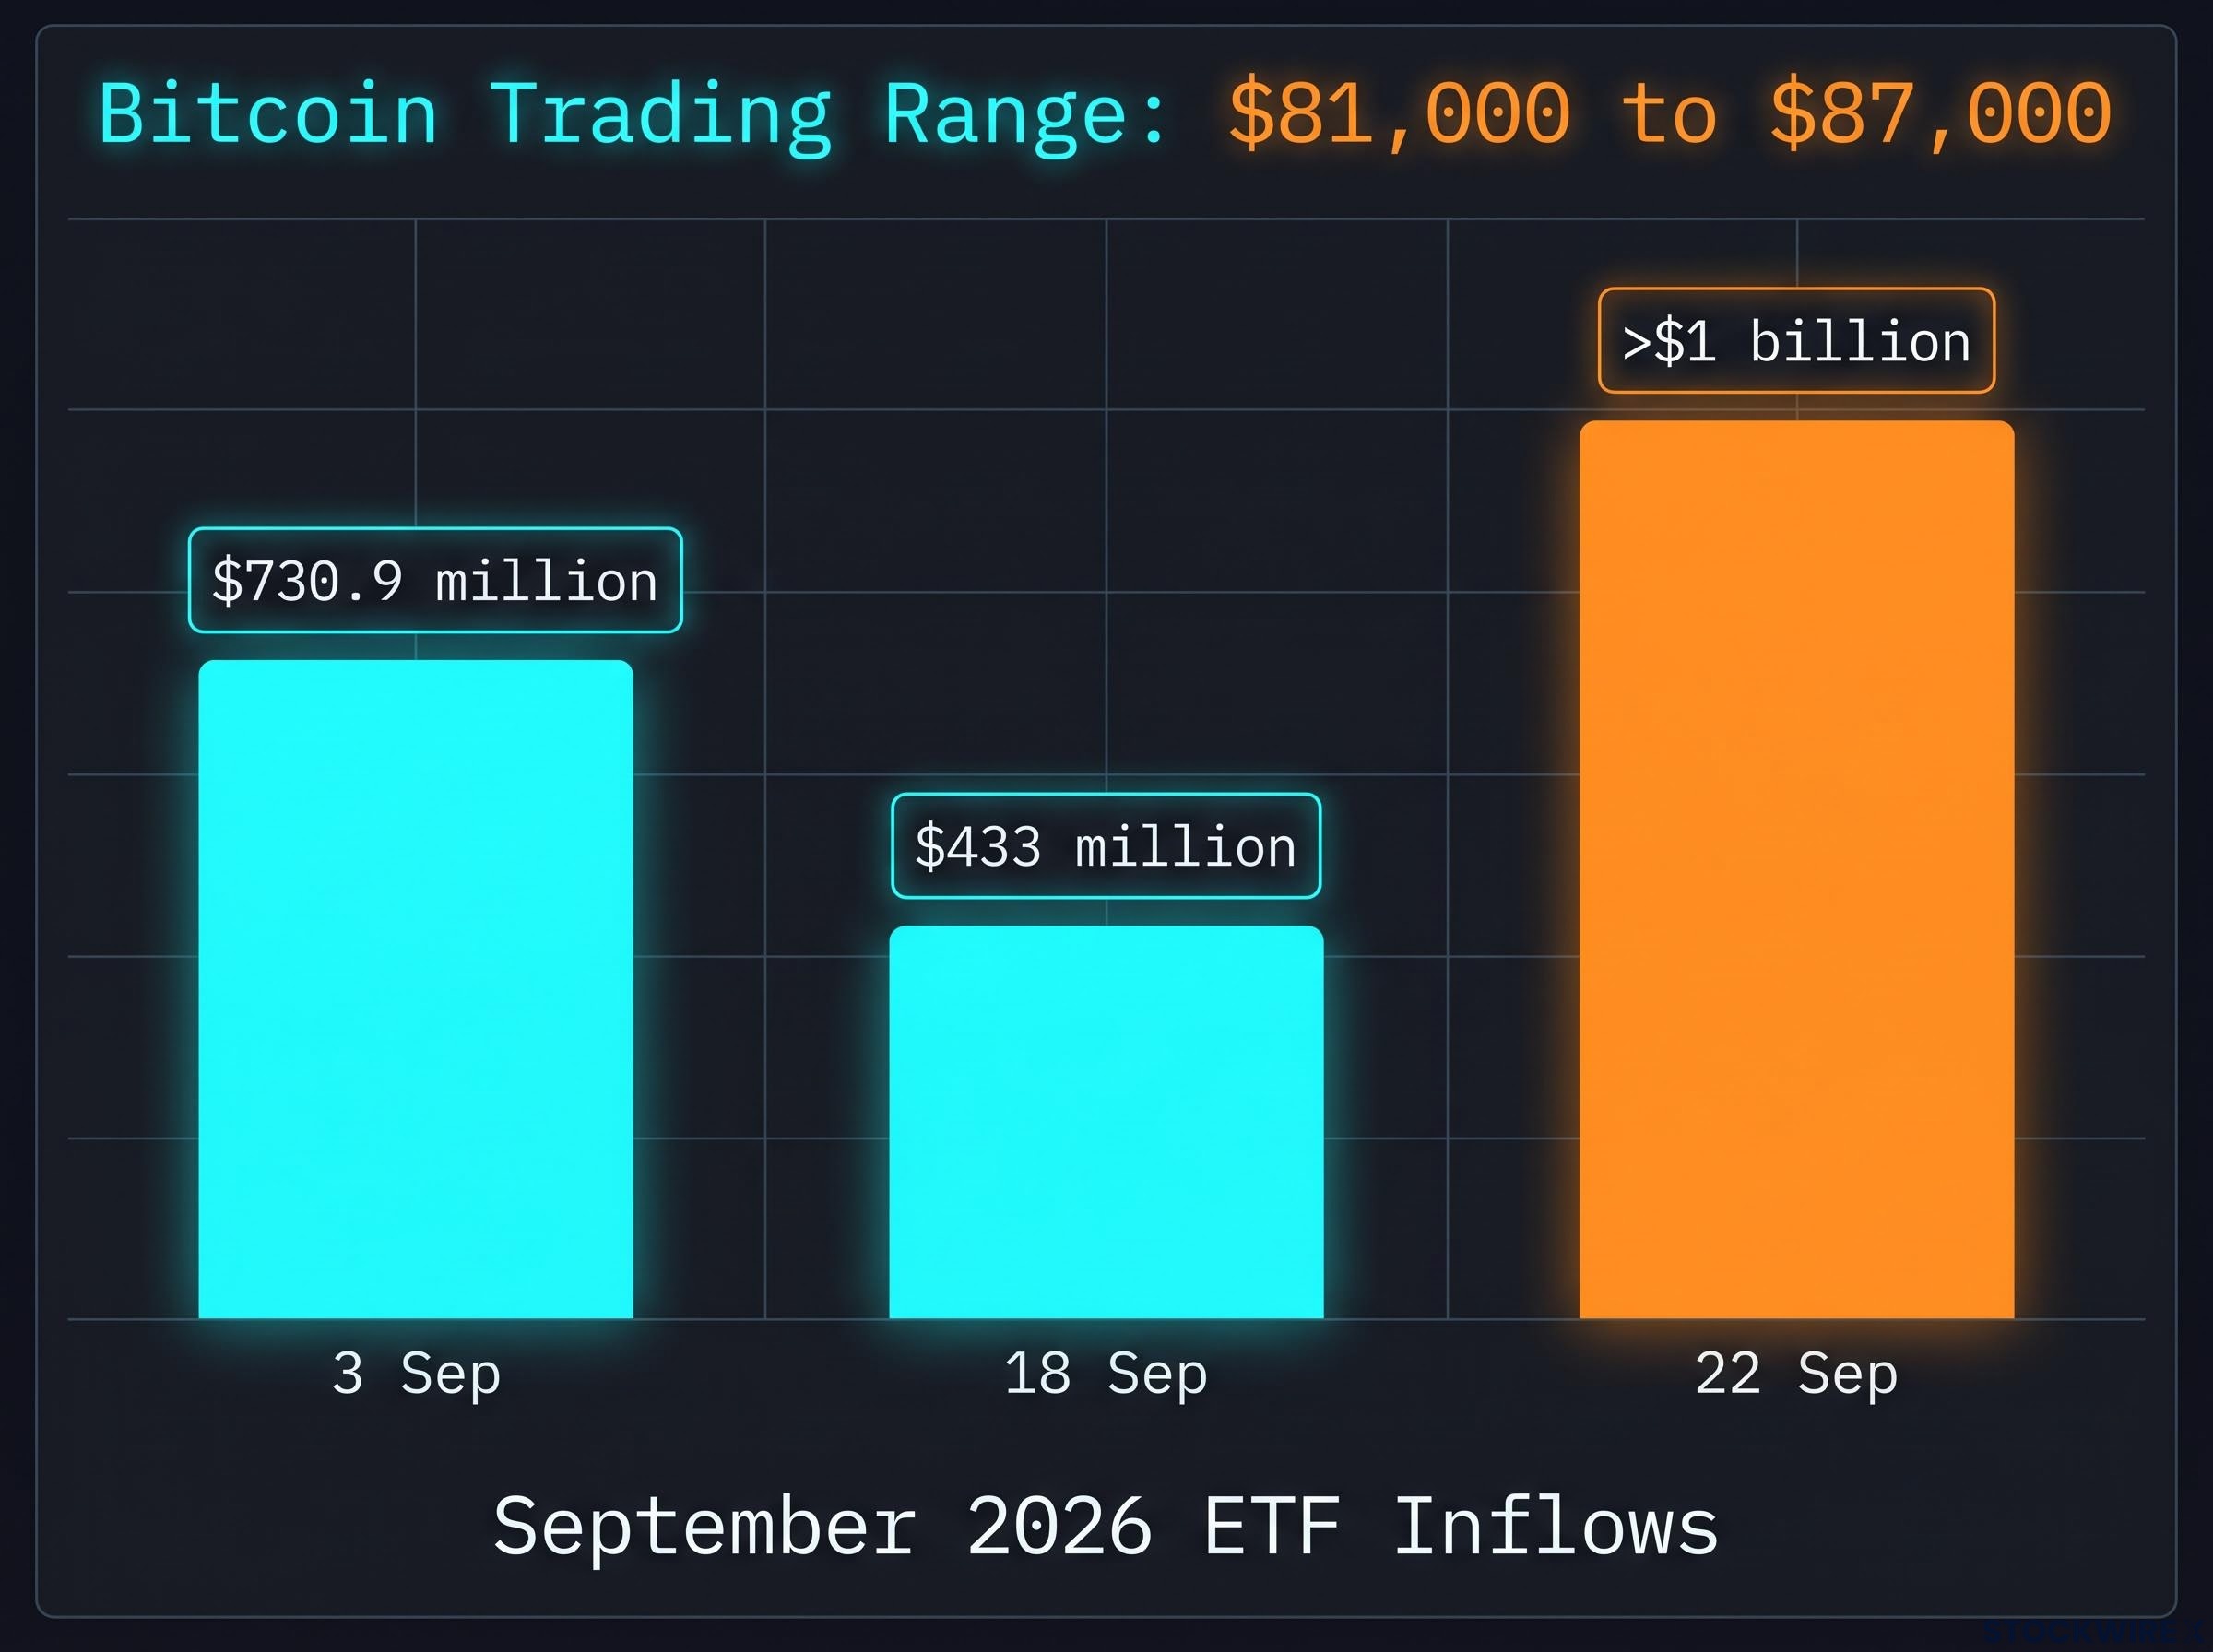
That pattern of large, repeated daily inflows points to structural accumulation, not a quick risk-on flutter. Capital is being allocated to Bitcoin as a long-term holding through a regulated channel that did not exist a few years ago.
There is a second narrative running underneath. Some commentary positions Bitcoin as an alternative inflation hedge, capturing the same store-of-value demand that would normally flow to gold, but without gold’s sensitivity to rising real yields. In the current setup, that immunity is exactly why the two are diverging.
The divergence is the signal worth internalising. It tells you that a strong enough structural catalyst, in this case ETF accumulation, can override the macro headwinds flattening everything else. That means crypto allocations deserve to be assessed on their own terms rather than lumped in with standard risk-on equities.
Catalysts that could shatter the current cross-asset alignment
None of this is stable. The neat alignment across these four assets rests on conditions that could shift quickly, and a healthy dose of scepticism is warranted before treating current levels as a resting point.
The clearest fracture line runs through the yen. RoboForex’s projection toward 159.17 sits in territory that has historically drawn official concern from Japanese authorities, and FXStreet confirmed that intervention risk is already seen as capping further USD/JPY gains.
Coordinated yen intervention, as executed in August 2026 when the US and Japan jointly deployed an estimated $59 billion in a single session to arrest the yen’s slide to 40-year lows, demonstrates that official action can force rapid carry-trade unwinds regardless of the underlying rate differential.
On the crypto side, the same ETF flows powering the rally are the source of its fragility. CryptoSlate noted that a near-flat $6.21 million weekly net inflow for the week ending 18 September masked violent daily swings. Flows that accelerate to $1 billion in a session can reverse just as sharply when risk appetite sours.
Regulation adds another live threat. Reuters reported that Bitcoin’s mid-September rebound followed a sharp selloff tied to the US Senate’s failure to advance comprehensive crypto legislation, a reminder that policy headlines can move the market regardless of the Fed.
Then there is the pivot scenario. The entire structure depends on the 2.6 percentage point rate gap holding. A single soft US inflation reading that shifts expectations toward Fed easing would compress real yields, weaken the dollar, and reprice gold and the currency pairs at speed.
The looming threat of official intervention
When USD/JPY climbs toward levels Japanese authorities view as disorderly, the Ministry of Finance can instruct the Bank of Japan to sell dollars and buy yen directly in the market. It is a deliberate, forceful move designed to reverse momentum rather than nudge it.
The ripple effects would not stay contained to the yen. A sudden intervention would force carry traders to unwind positions quickly, pulling dollar liquidity out of the trade and sending a jolt through the very flows holding the current regime together. Knowing where these trigger points sit gives you the foresight to trim exposure before an intervention or policy shift does it for you.
Positioning for the next shift in real yields
The overarching lesson of September 2026 is hard to miss. US interest rates remain the gravitational centre of global finance, and almost every major asset move this month traces back to the Fed’s 3.75-4.00% stance and its higher-for-longer message.
Bitcoin has found a temporary bypass through ETF plumbing, proving that a strong enough structural catalyst can outrun the macro tide. Gold, the yen, and the Australian dollar have no such escape; they remain locked in a holding pattern until the Federal Reserve signals a genuine change of direction.
The question worth asking of your own portfolio is how sensitive it is to a sudden drop in US real yields. That single shift would historically trigger a fast rotation out of the dollar and back into gold and foreign currencies, unwinding the alignment described here in a matter of sessions.
This article is for informational purposes only and should not be considered financial advice. Investors should conduct their own research and consult with financial professionals before making investment decisions. Past performance does not guarantee future results, and forward-looking scenarios are speculative and subject to change based on market developments.