Most investors assume Asian central banks can defend their currencies almost indefinitely. The region sits on roughly $8 trillion in reserves, after all, and that cushion is supposed to make sustained currency crises a thing of the past.
The data from 2026 tells a different story. Those reserves are being drawn down at a pace not seen since the 2013 taper tantrum, and the currencies under the most strain are not always the ones investors instinctively watch.
The pressure comes from a specific confluence: a strong US dollar, energy price shocks worsening the terms of trade for net oil importers, a repricing of Federal Reserve rate expectations that has stripped away carry support, and cumulative equity outflows from Asian markets exceeding $134 billion through mid-June 2026. That figure dwarfs the roughly $45 billion sold across all of 2025.
This is not uniform regional stress. It is a differentiated set of vulnerabilities with distinct structural and cyclical roots.
By the time you finish this, you will know which currencies face structural versus cyclical pressure, how central bank intervention is constrained in each case, what the yuan’s resilience actually signals, and which hedging frameworks institutional analysts are applying right now.
The macro forces reshaping Asian FX in 2026
The weakness across Asian currencies did not arrive as a single event. It accumulated as three separate shocks landed in sequence and reinforced one another.
Three primary headwinds define the environment:
- US dollar strength, driven by a repricing of Federal Reserve rate expectations that pushed the dollar higher against most of Asia.
- Energy price shocks stemming from Middle East conflict, which worsened the terms of trade for the region’s net oil importers.
- Carry compression, as the global bond yield environment stripped away the incentive to hold lower-yielding Asian currencies.
Energy price shocks stemming from the Strait of Hormuz crisis displaced traditional safe-haven and rate-differential frameworks as the dominant currency valuation variable, with Japan absorbing the full cost of the supply shock through yen weakness while Australia’s LNG and gold export revenues provided an offsetting buffer unavailable to net-oil-importing Asian economies.
The first two shocks hit the balance of payments directly. When oil prices climbed, MUFG data showed steep early depreciation across the net-importing currencies: the Thai baht fell 4.7%, the Philippine peso 4%, and the South Korean won 3.7% against the dollar. Higher energy costs meant these economies had to buy more dollars to pay for the same imports.
The third shock removed the offset. With Fed expectations repriced, the modest yield that once made the baht or the won worth holding no longer compensated for the volatility. Carry stopped doing its job.
Capital outflows then amplified everything. This is the mechanism, not the primary cause: equity selling accelerated a weakness that the macro shocks had already set in motion.
The scale of the shift makes the point.
Cumulative Asian equity selling reached approximately $134 billion through mid-June 2026, against roughly $45 billion for all of 2025. This is a regime change, not a volatile patch.
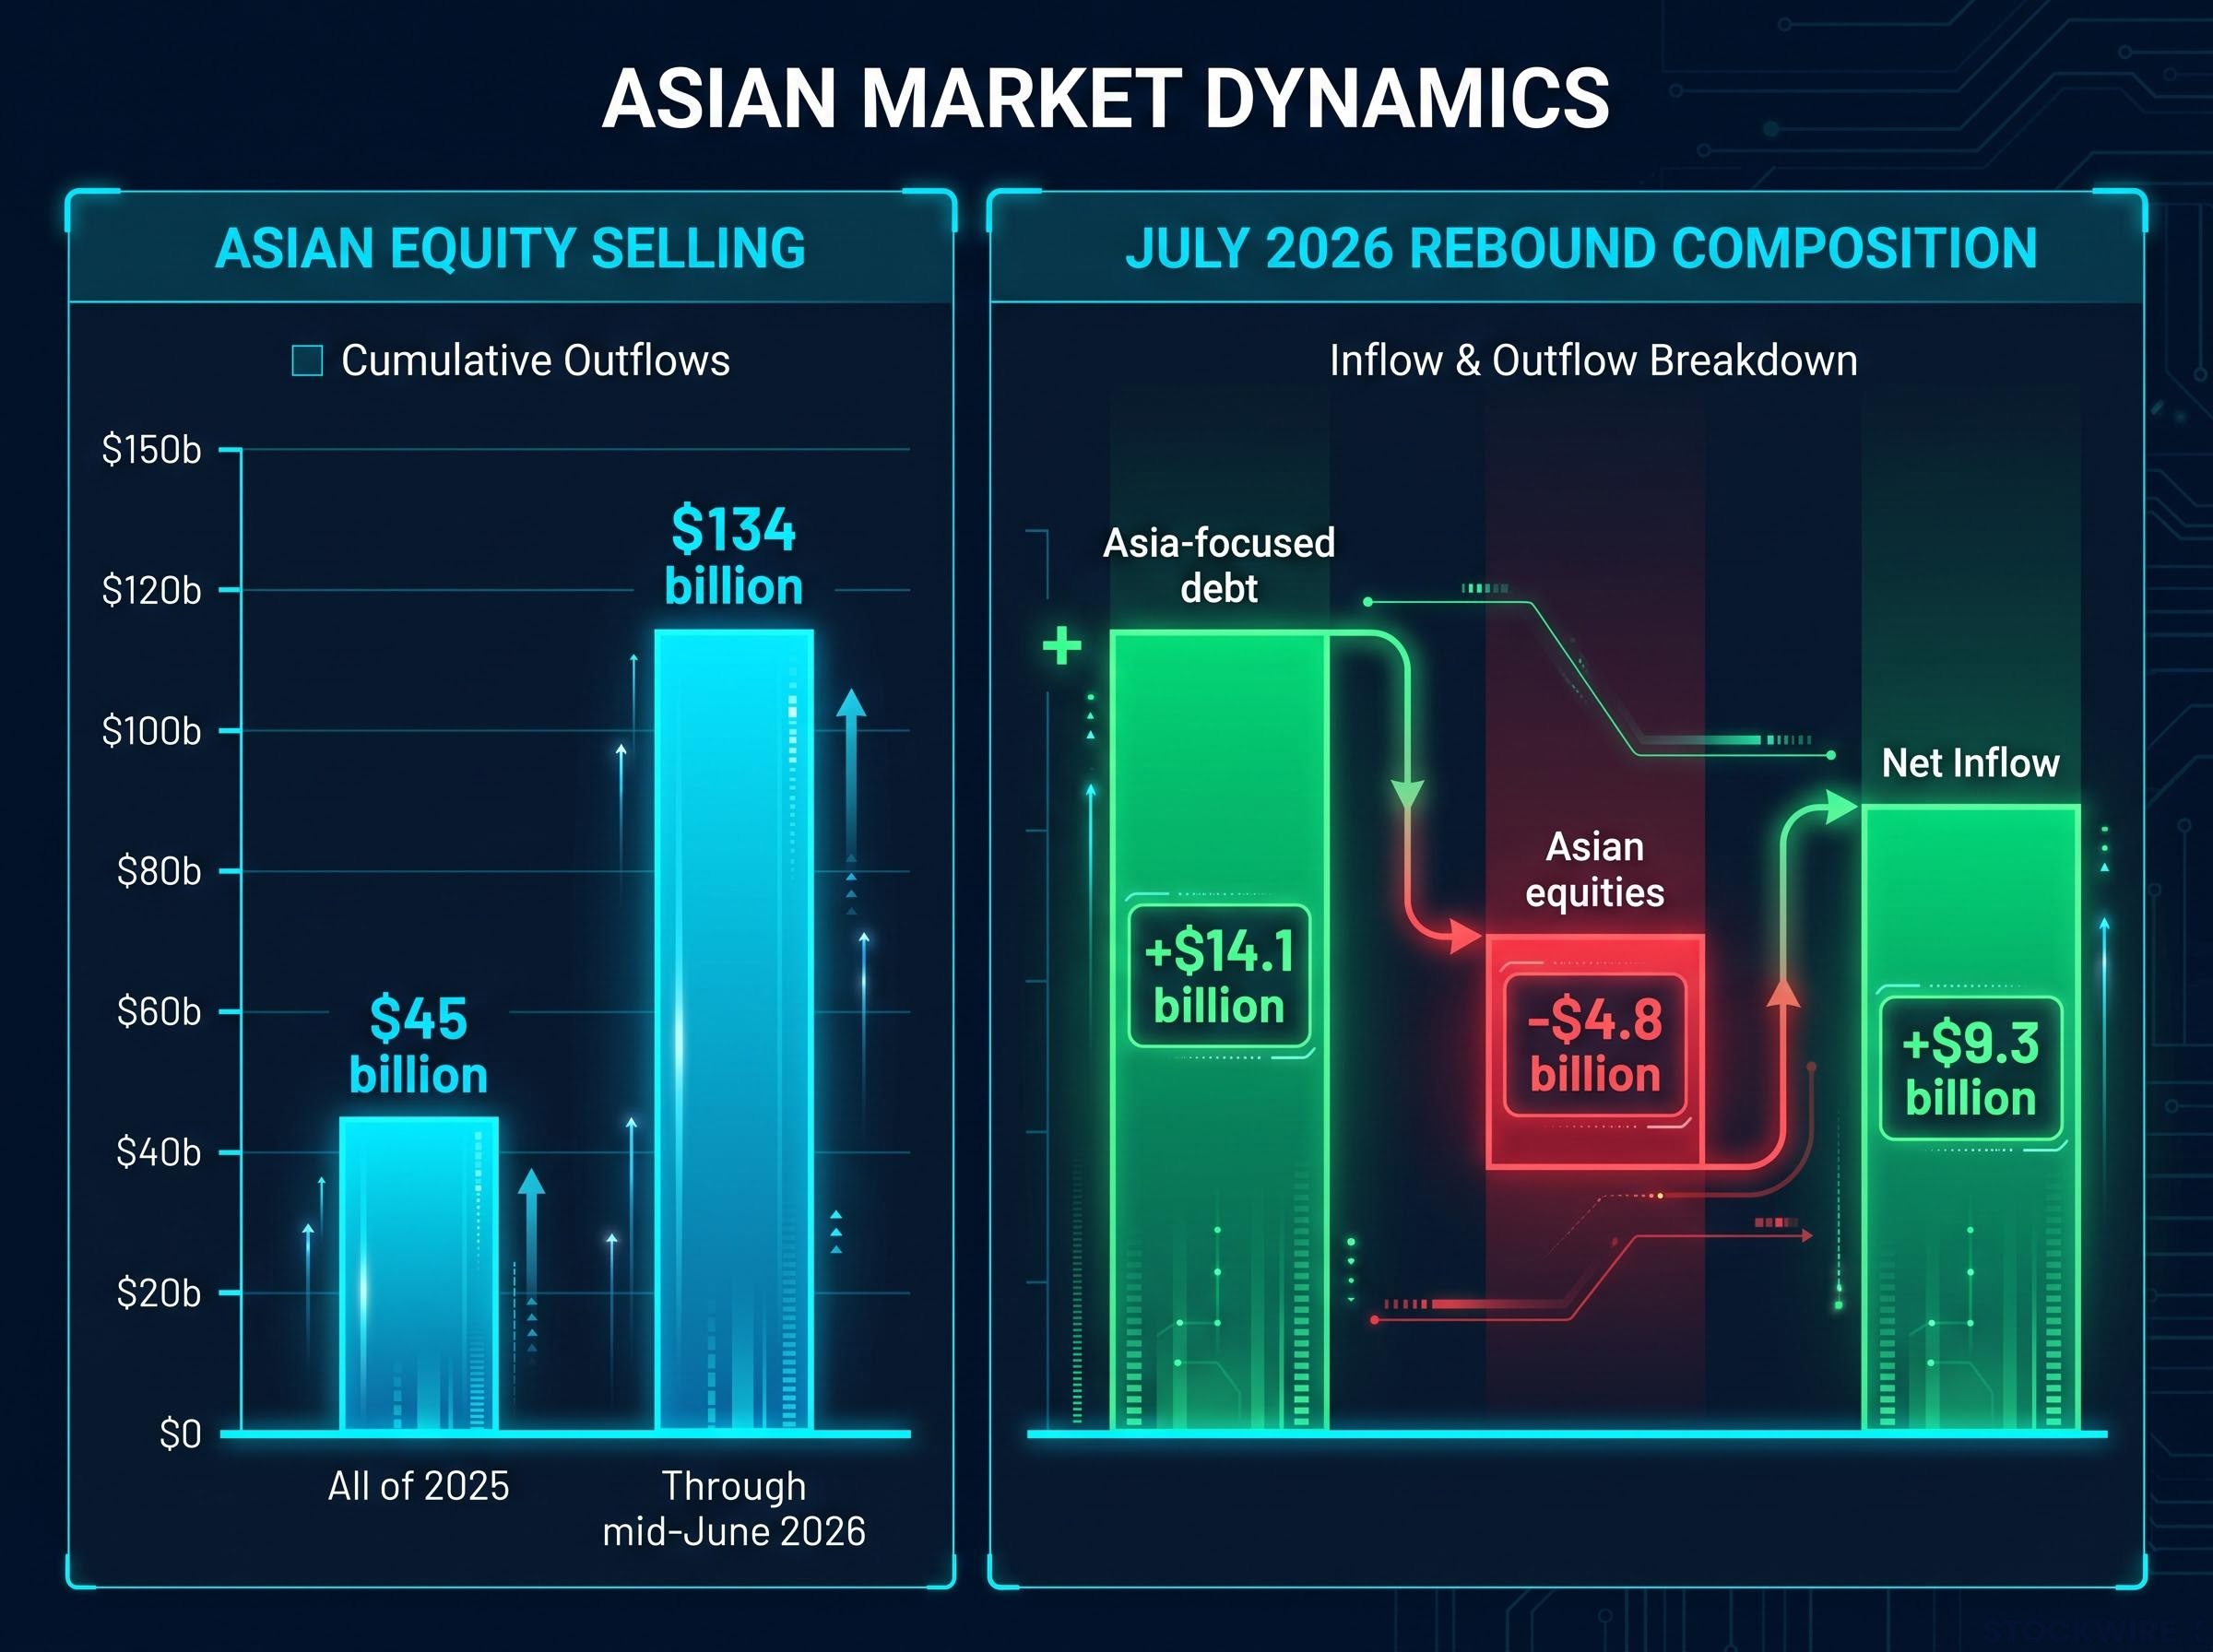
The monthly flow data traces the same arc. In March 2026, foreign investors pulled $70.3 billion from emerging market portfolios, the largest monthly outflow since March 2020, with Asian EM equity sales accounting for roughly $52 billion of it. June 2026 brought a further $46.1 billion in EM equity outflows, with emerging Asia recording $27 billion in total portfolio outflows.
Then, in July 2026, flows rebounded. Emerging markets posted a net +$18.8 billion inflow, and Asia swung to a $9.3 billion net inflow.
Here is the detail that matters for you. That July recovery was driven almost entirely by $14.1 billion moving into Asia-focused debt, while Asian equities still bled $4.8 billion. Debt inflows can reverse far faster than equity repositioning, and the equity-side selling has not stopped. The rebound has a fragile composition, which means treating it as a turning point would be an error.
When big ASX news breaks, our subscribers know first
Four currencies, two types of pressure
Not all Asian currency weakness has the same prognosis. Four currencies sit at the centre of the strain, and they split into two categories that call for two different trades.
The Indian rupee, Philippine peso, and Thai baht share a structural logic. Their weakness ties back to energy import dependence, current account dynamics, and inflation. These are not problems a single policy shift can fix.
The rupee settled at 95.08 per dollar on 9 September 2026, down just over 5% year-to-date according to a Reuters poll on 2 September 2026. The Reserve Bank of India has fought hard to hold the line, spending more than $53 billion in spot FX sales in FY26 and building a record short forward dollar position exceeding $103 billion. That is an enormous commitment to defend a level, and it tells you how much pressure sits behind the rupee.
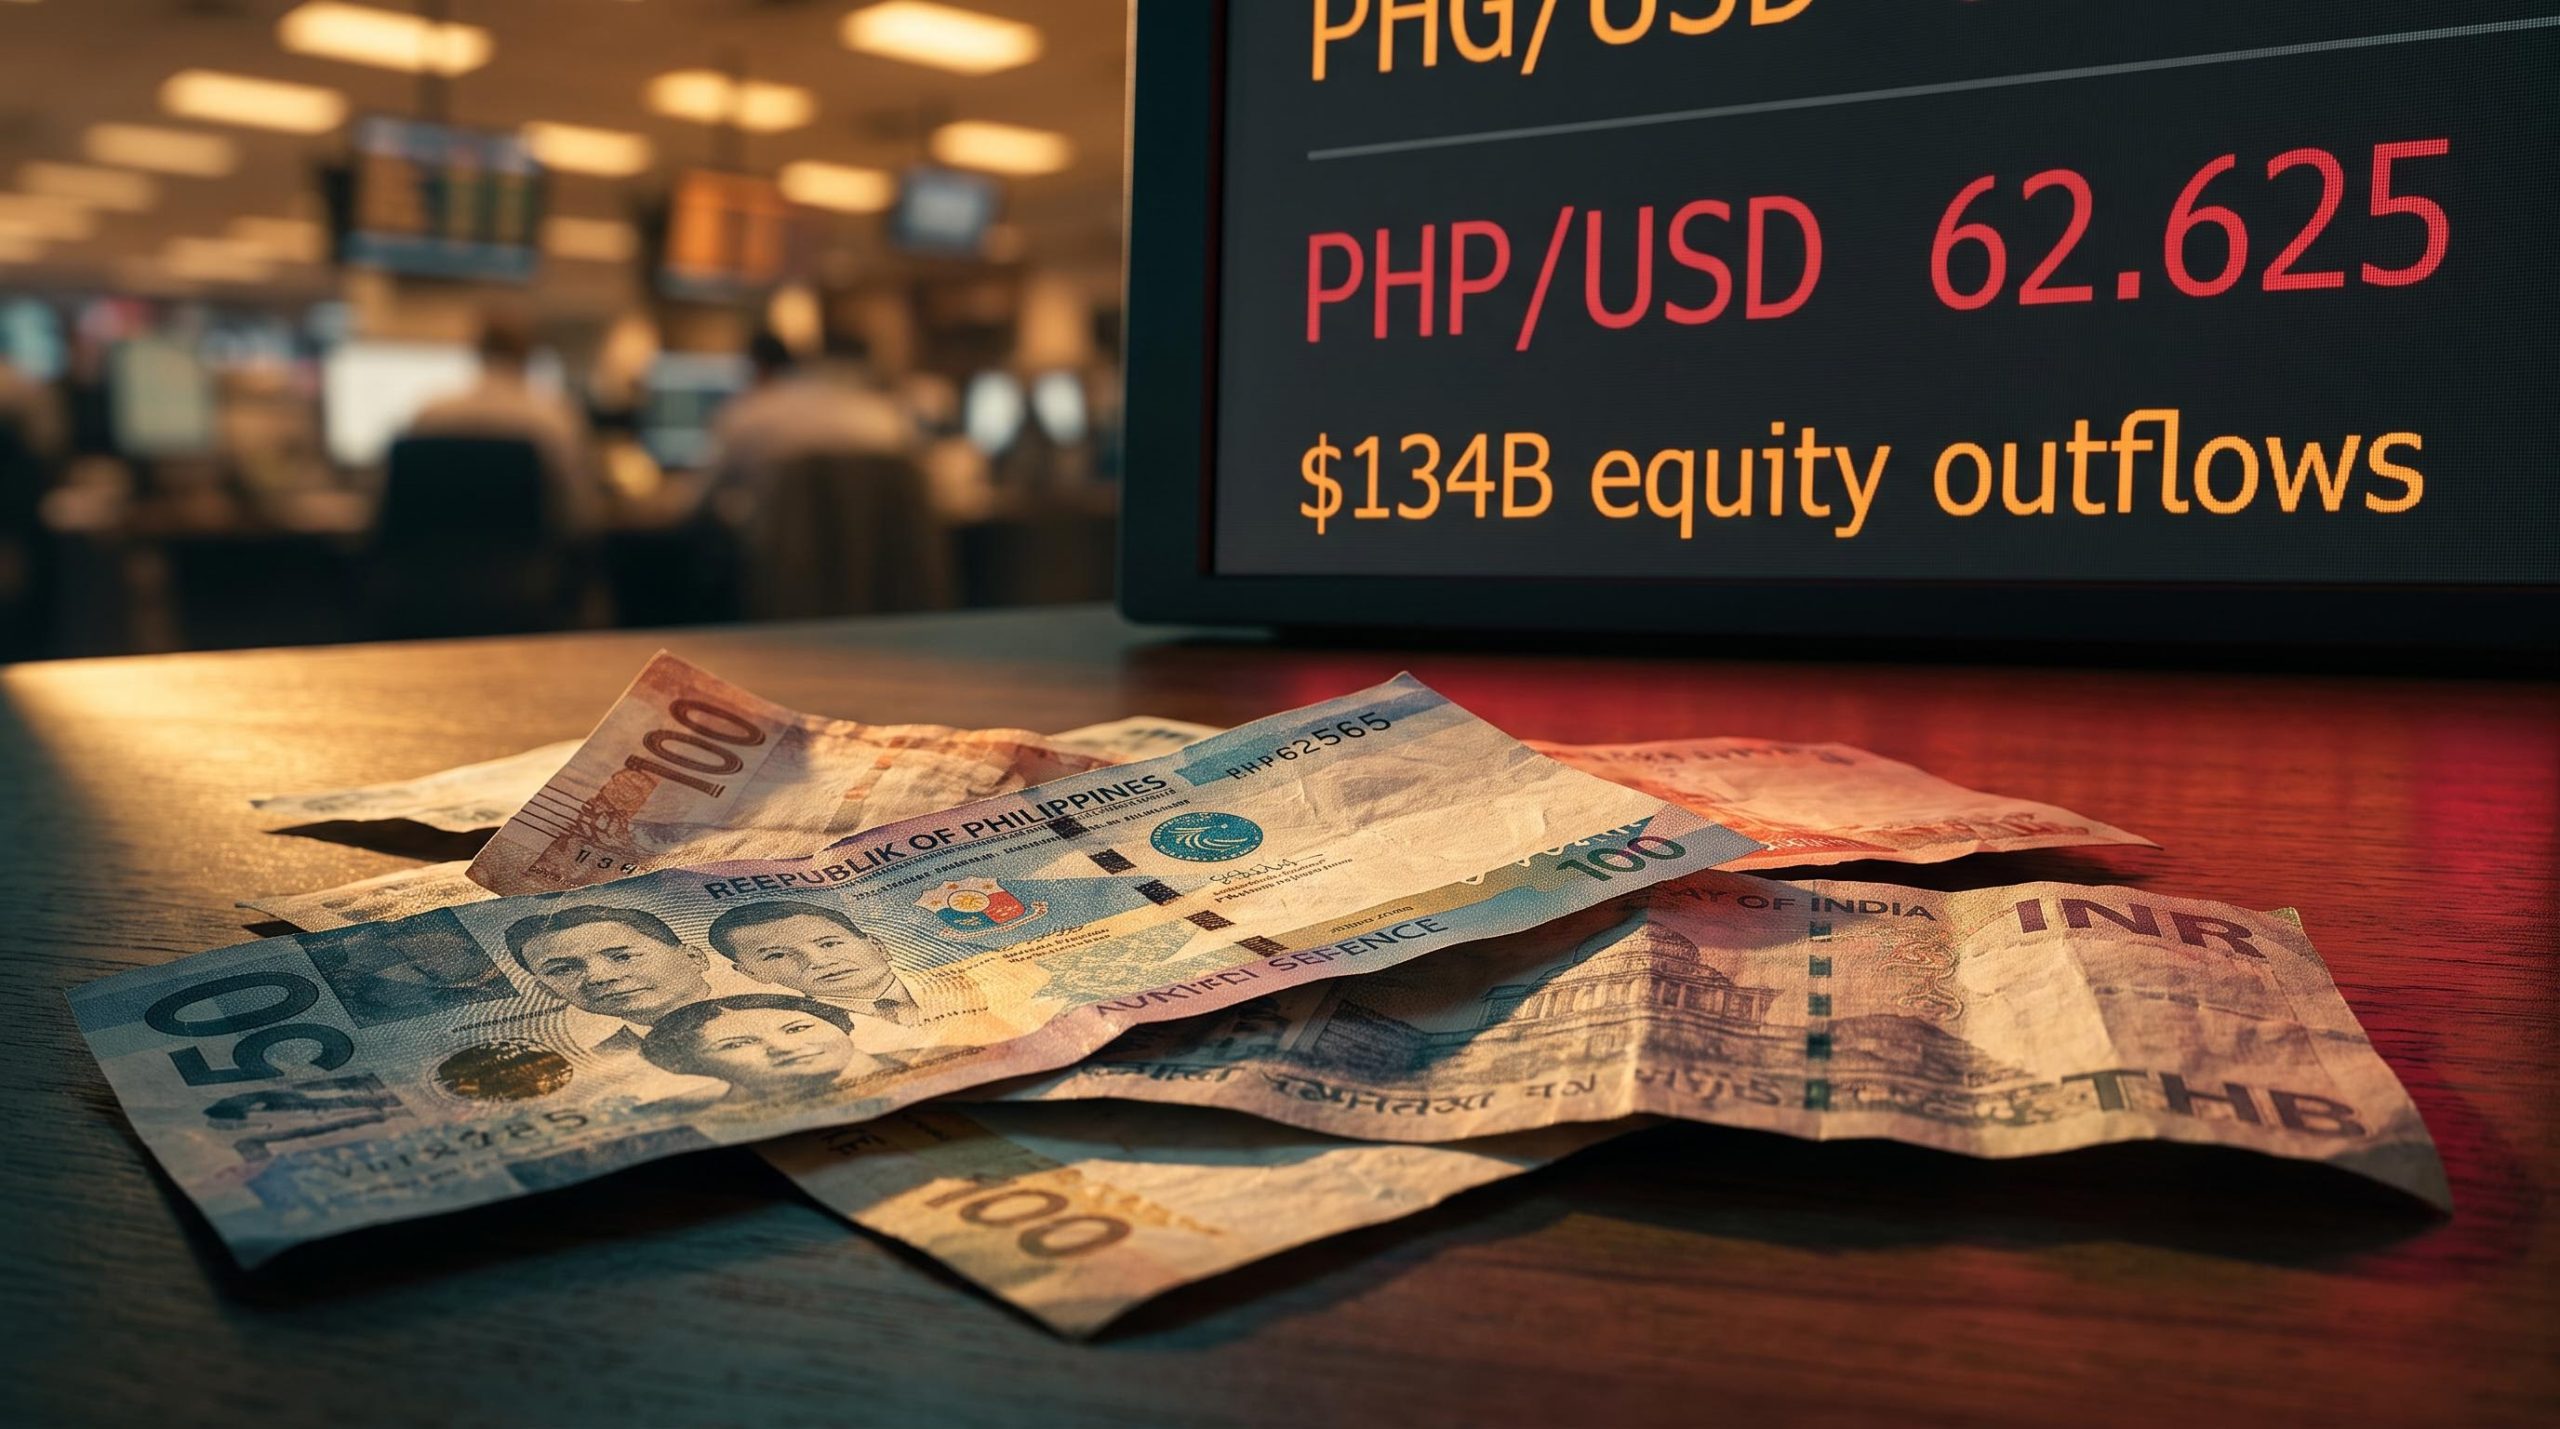
The peso closed at a record low of 62.625 per dollar on the same date, having pushed well past the 60 mark near which the Bangko Sentral ng Pilipinas previously intervened. Slowing domestic growth and inflation reported above 6% have added to the strain.
The baht traded near 32.90 per dollar on 9 September 2026, implying roughly 6-7% depreciation year-to-date from about 30.86 in January. Thailand’s inclusion on the US Treasury currency-monitoring list since January 2026 has constrained the Bank of Thailand from heavy, one-sided intervention.
The US Treasury currency monitoring criteria assess trading partners against thresholds for bilateral trade surplus, current account surplus, and persistent one-sided FX intervention, and Thailand’s presence on the list since January 2026 means the Bank of Thailand must demonstrate two-directional intervention to avoid escalation.
The won is a different case. Its pressure has been cyclical, tied to equity-market risk and offshore non-deliverable forward activity rather than a broken external balance. And it has already begun to recover.
| Currency | Spot vs USD (9-10 Sep 2026) | Year-to-date move | Pressure type | Key central bank response |
|---|---|---|---|---|
| Indian rupee (INR) | 95.08 | Down just over 5% | Structural | $53B+ spot sales, $103B+ short forward book |
| Philippine peso (PHP) | 62.625 (record low) | Record-low territory | Structural | Monitoring volatility, prior defence near 60 |
| Thai baht (THB) | ~32.90 | Down ~6-7% | Structural | Constrained by US monitoring list |
| South Korean won (KRW) | ~1,341.70 | Down 5.68% (as of 3 Sep) | Cyclical | NDF scrutiny, rare direct dollar-selling |
The won traded around 1,341.70 on 10 September 2026, near its strongest levels in almost two years, with the pair down 5.68% year-to-date as of 3 September 2026 per Investing.com data. BNY argues that US strategic considerations around AI supply chains could give the won fundamental support, a structural reason to watch its recovery with more conviction.
ING favours selective rupee upside among the high-yielders and won upside among the low-yielders, contingent on global shocks subsiding.
The distinction is what makes ING’s framework coherent, and it matters directly for you. Structural pressure in the rupee, peso, and baht is unlikely to resolve with one policy move, so a weakness trade there can persist. The won’s rebound shows that cyclical pressure can reverse quickly once the equity-flow dynamic shifts. Treat all four as the same trade and you will mis-position both your hedges and your recovery bets.
What the yuan’s resilience actually means
The Chinese yuan has held up while its regional peers weakened. On the surface that looks like a market vote of confidence in Chinese assets. It is not.
Yuan stability in 2026 is an engineered outcome, produced by the People’s Bank of China actively managing the pace of appreciation. Understanding how it is engineered changes how much weight you should give it.
The CCF mechanism explained
The PBOC sets a daily USD/CNY midpoint using a formula with three inputs: the previous closing price, movements in a basket of currencies, and a discretionary counter-cyclical factor (CCF). The onshore yuan is then allowed to trade within a 2% band around that fixing.
The PBOC fixing mechanism operates through three inputs — the previous closing price, a currency basket, and a discretionary counter-cyclical adjustment factor — with the resulting midpoint capping onshore USD/CNY moves within a hard 2% band before a single trade clears each session.
Introduced in May 2017, the CCF lets the central bank lean against herd behaviour, and SEB notes it operates alongside a 20% reserve requirement on FX forwards. The catch is transparency. SEB observes that the factor is opaque by design, which makes the market harder to read and means the daily fixing carries deliberate policy intent rather than a clean market signal.
Recent fixings show that intent clearly. Through August and early September 2026, the PBOC repeatedly set the midpoint far weaker than market models expected:
- 14 August 2026: fixing at 6.7878, 465 pips weaker than estimates.
- 20 August 2026: fixing at 6.7808, 598 pips weaker than the Bloomberg survey average.
- 25 August 2026: fixing at 6.7852, 633 pips weaker than Reuters estimates.
- 1-3 September 2026: fixings clustered between 6.7807 and 6.7829, against Reuters model estimates of 6.7167 to 6.7238.
- 4 September 2026: fixing set at 6.7787 for the following session.
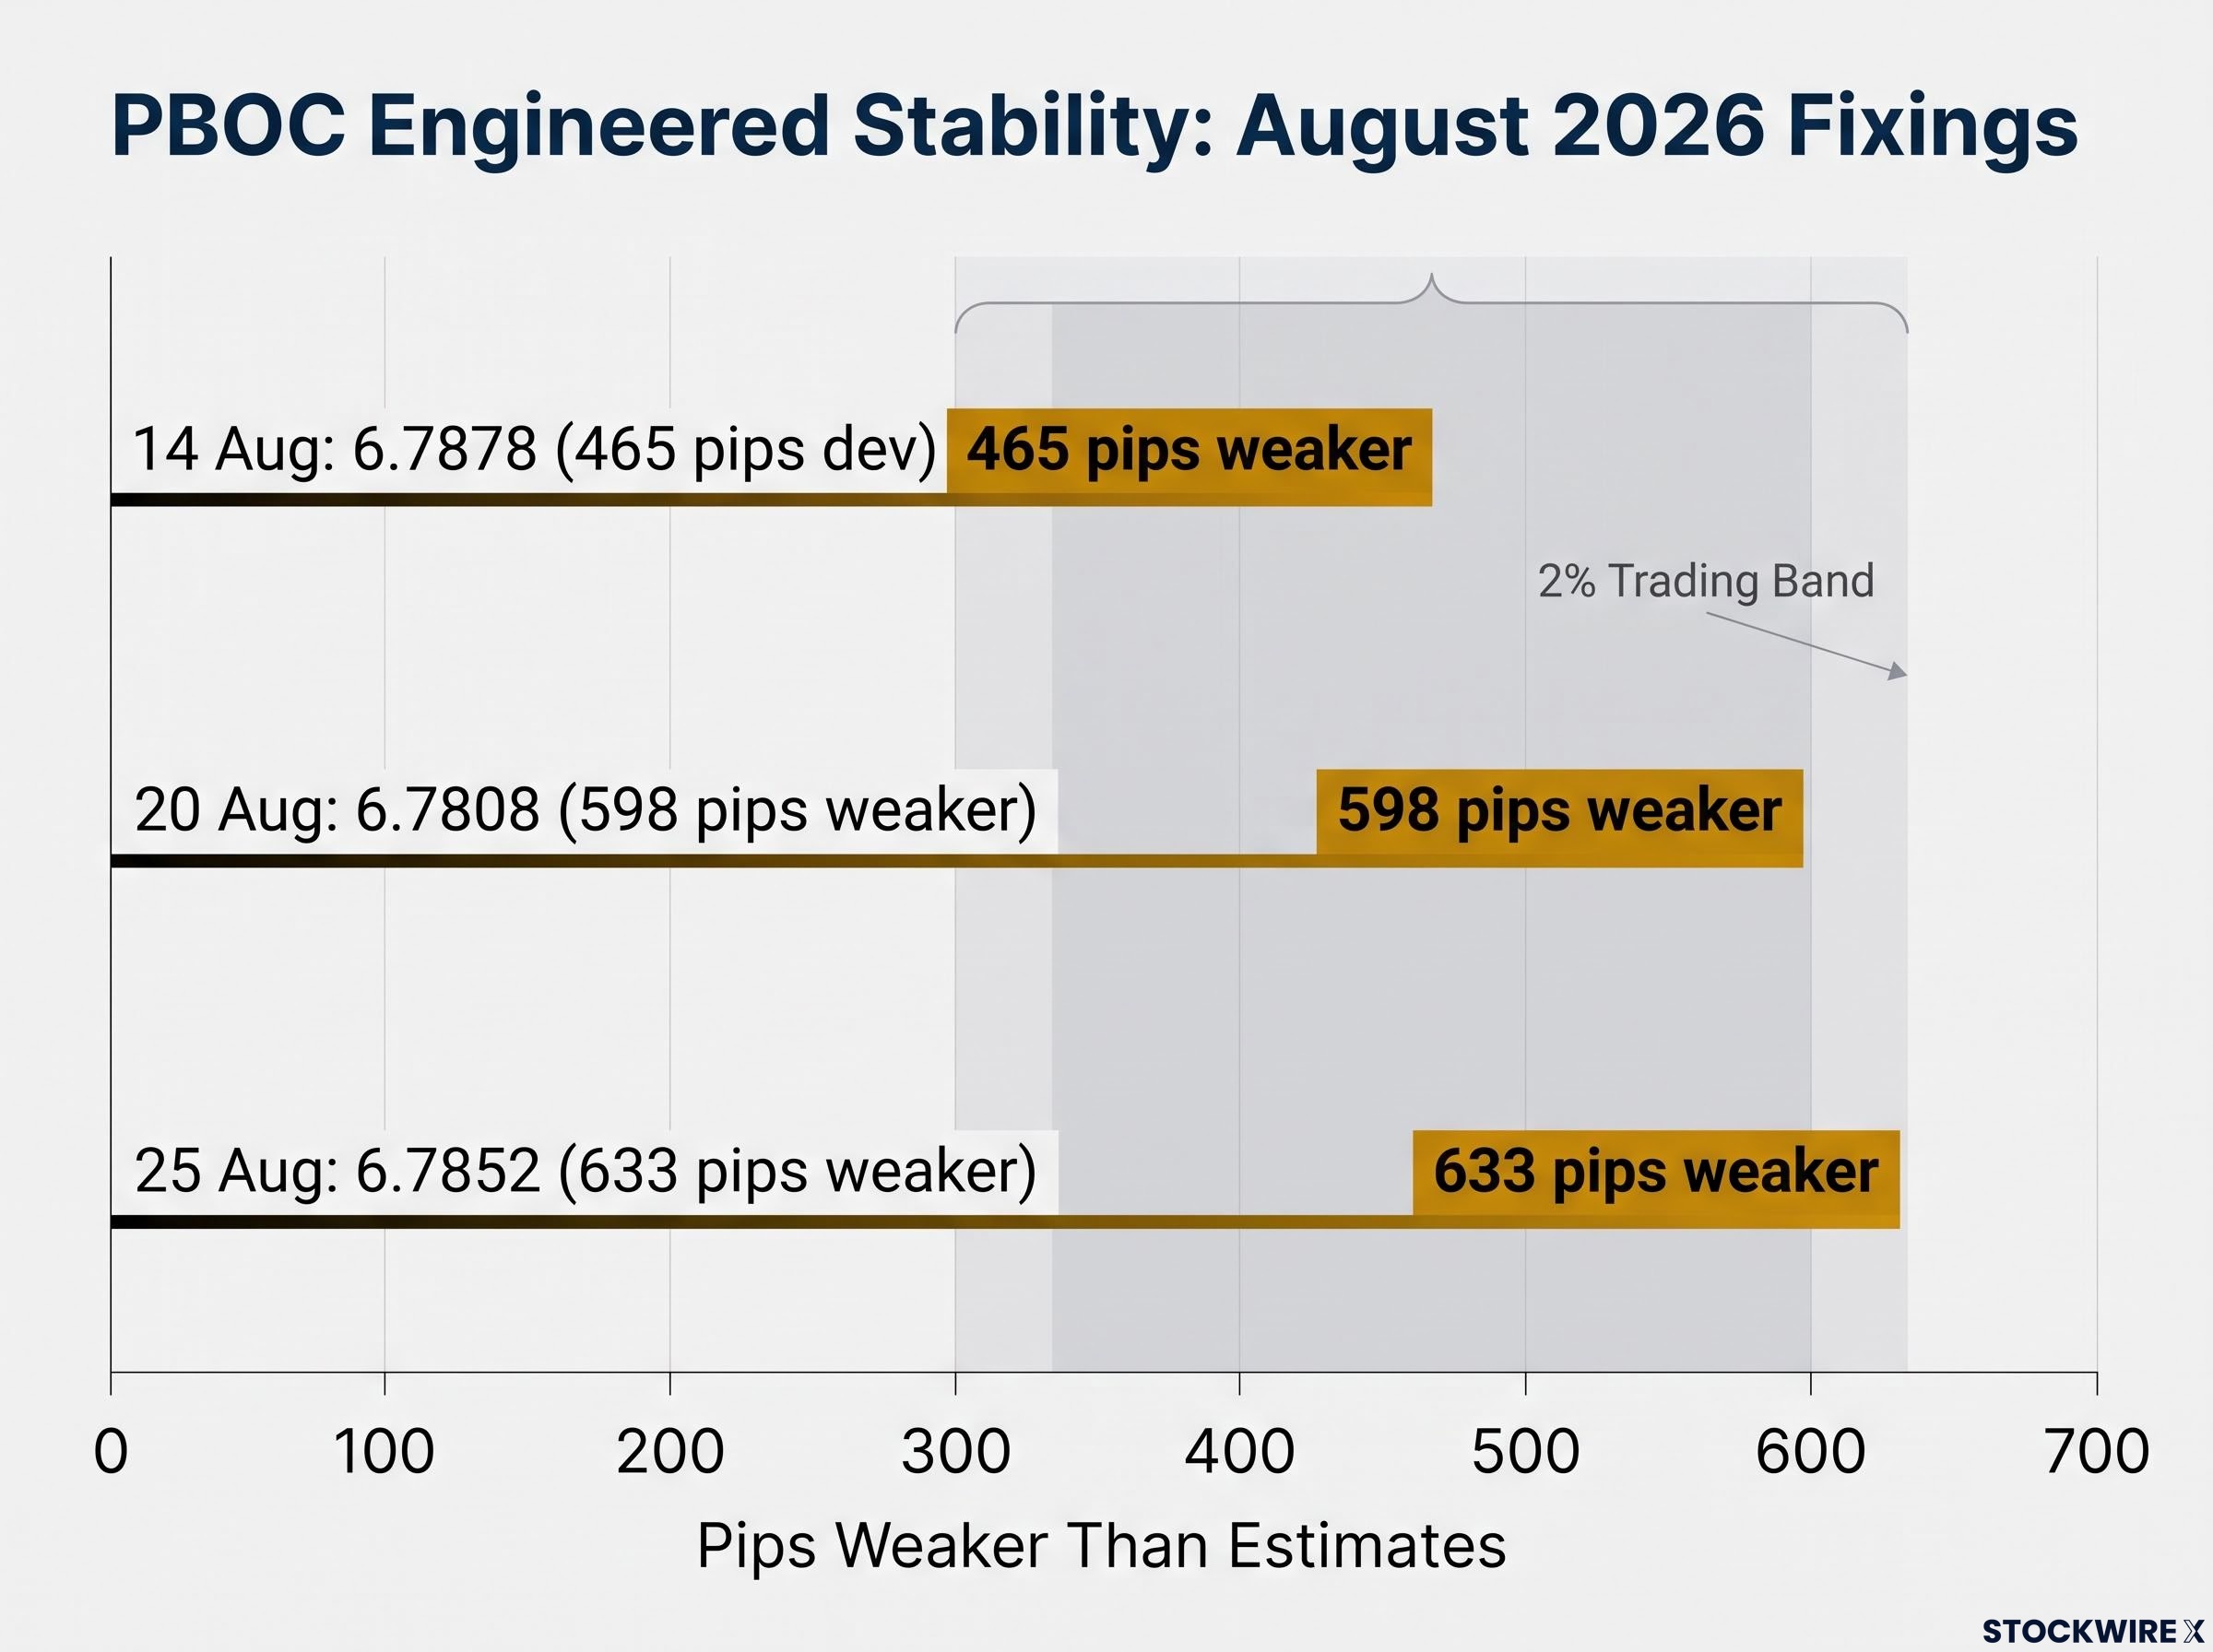
Read those deviations together. Reaching 633 pips on the weak side tells you Beijing is more worried about the speed of appreciation than the level itself. Yuan stability is conditional on the PBOC’s continued willingness to intervene, not evidence of underlying strength that justifies adding unhedged exposure.
Institutional positioning reflects that caution. BNY iFlow data shows yuan holdings have shifted further into underheld territory despite the currency’s resilience, meaning managers are not chasing the move.
Invesco’s Q3 2026 FX Pulse advises hedging most emerging market currencies, but explicitly recommends against hedging the yuan, the Hong Kong dollar, and the Swiss franc from a US dollar investor’s perspective. That contrast is itself a read on how institutions view managed stability.
The takeaway for portfolio construction is direct. Interpret yuan stability as organic confidence and you build exposure on a policy-dependent foundation. Interpret it as a managed signal and you weight it accordingly.
How institutional analysts are positioning and hedging now
The diagnostic is clear. The applied question is what professional managers are actually doing about it, and here the answer represents a genuine shift in method.
Institutional guidance has moved away from static, blanket hedging policies toward dynamic, options-based frameworks. That shift is a direct response to the widening divergence across the region. When four currencies split into structural and cyclical camps, a single hedge ratio applied across all of them stops making sense.
The specific recommendations sort by currency group:
- Invesco (CNY, HKD, CHF): do not hedge, treating these as relatively stable while hedging most other EM currencies.
- State Street Global Advisors (KRW): a low benchmark hedge ratio of 0-20%, warning that fully hedging won exposure is unattractive given the cost of carry and volatility.
- UBS and HSBC Asset Management (vulnerable pairs): options-based frameworks, specifically long straddles, to manage sudden dollar spikes while keeping upside participation.
- BNY (CNY): maintain established hedges without chasing appreciation, reflecting the underheld positioning that iFlow data shows.
The UBS and HSBC recommendation is the clearest expression of the method change.
UBS and HSBC Asset Management caution against a simple “Asia beta plus carry” mindset, advising long straddles on vulnerable pairs to manage sudden USD spikes while preserving upside participation.
A long straddle, buying both a call and a put on the same pair, pays off when the currency moves sharply in either direction. Managers reaching for it are telling you something important: the directional outlook is not merely volatile, it is genuinely uncertain. If your own approach is a simple long-short position or a blanket hedge, you are accepting a structural mismatch between your tools and the environment they are working in.
Where analysts see selective recovery potential
The bullish case is a minority view, but it is specific. ING favours selective rupee upside among the high-yielders and won upside among the low-yielders, with the contingency stated plainly: only once global shocks subside.
BNY adds a firmer reason to watch the won. Its thesis that US strategic considerations around AI supply chains could support the currency is structural rather than cyclical, which gives the won recovery more conviction than a simple flow reversal would. For you, that is the difference between a rebound worth trading and one worth building around.
AI supply chain positioning is already generating measurable currency support in South Korea and Taiwan, with Reuters and Goldman Sachs analysis identifying KRW and TWD as currencies receiving structural inflow backing from hyperscaler procurement and data centre build-out, which reinforces BNY’s thesis that the won recovery carries more conviction than a simple flow reversal.
What investors should monitor as the pressure environment evolves
The framework is only useful if you can apply it to new data as it arrives. Rather than a recap, here is a prioritised monitoring agenda.
- The US dollar and Fed communication. The dollar’s trajectory sits upstream of nearly every pressure described here. Any dovish shift that revives carry would ease the strain on the low-yielders first.
- Energy prices. This is the direct mechanism for terms-of-trade pressure on the rupee, peso, and baht. Watch oil, and you are watching the structural cases in real time.
- PBOC fixing deviations. The size of the weak-side gap is a leading indicator of Beijing’s intent. A narrowing deviation would signal a change in policy stance before the spot rate confirms it.
- The composition of EM capital flows. July’s rebound was debt-led, with $14.1 billion into Asia debt against a $4.8 billion equity outflow. A recovery led by equities rather than debt would signal durable stabilisation rather than a fragile bounce.
The dollar’s trajectory in September 2026 carries a complication most carry-framework models miss: rising US 10-year yields near 4.77% are being read by analysts at Convera, Nomura, and Bank of America as a fiscal risk premium rather than an investment signal, which inverts the normal relationship between yield advantage and currency strength.
Two specific variables deserve attention. The RBI’s short forward dollar position exceeding $103 billion cannot be rolled indefinitely; any move to reduce it would send a visible and significant signal. And the won’s climb to near two-year highs is a live test of whether cyclical pressure can fully resolve in this macro environment.
The organising lens is the structural-versus-cyclical distinction. Apply it to every new development, and you will know whether a data point confirms your diagnosis or contradicts it.
The balance of risks remains tilted toward continued pressure in the structural cases, which is precisely why these watchpoints exist.
This article is for informational purposes only and should not be considered financial advice. Investors should conduct their own research and consult with financial professionals before making investment decisions. Past performance does not guarantee future results. Financial projections are subject to market conditions and various risk factors, and forward-looking views cited here are speculative and subject to change.