NextDC plans to spend between $5.25 billion and $5.75 billion on capital expenditure in FY2027. To put that number in proportion: the company’s entire cumulative capex from its founding in 2011 through to FY2026 totalled $9.2 billion. It now proposes to deploy close to that figure again in a single year.
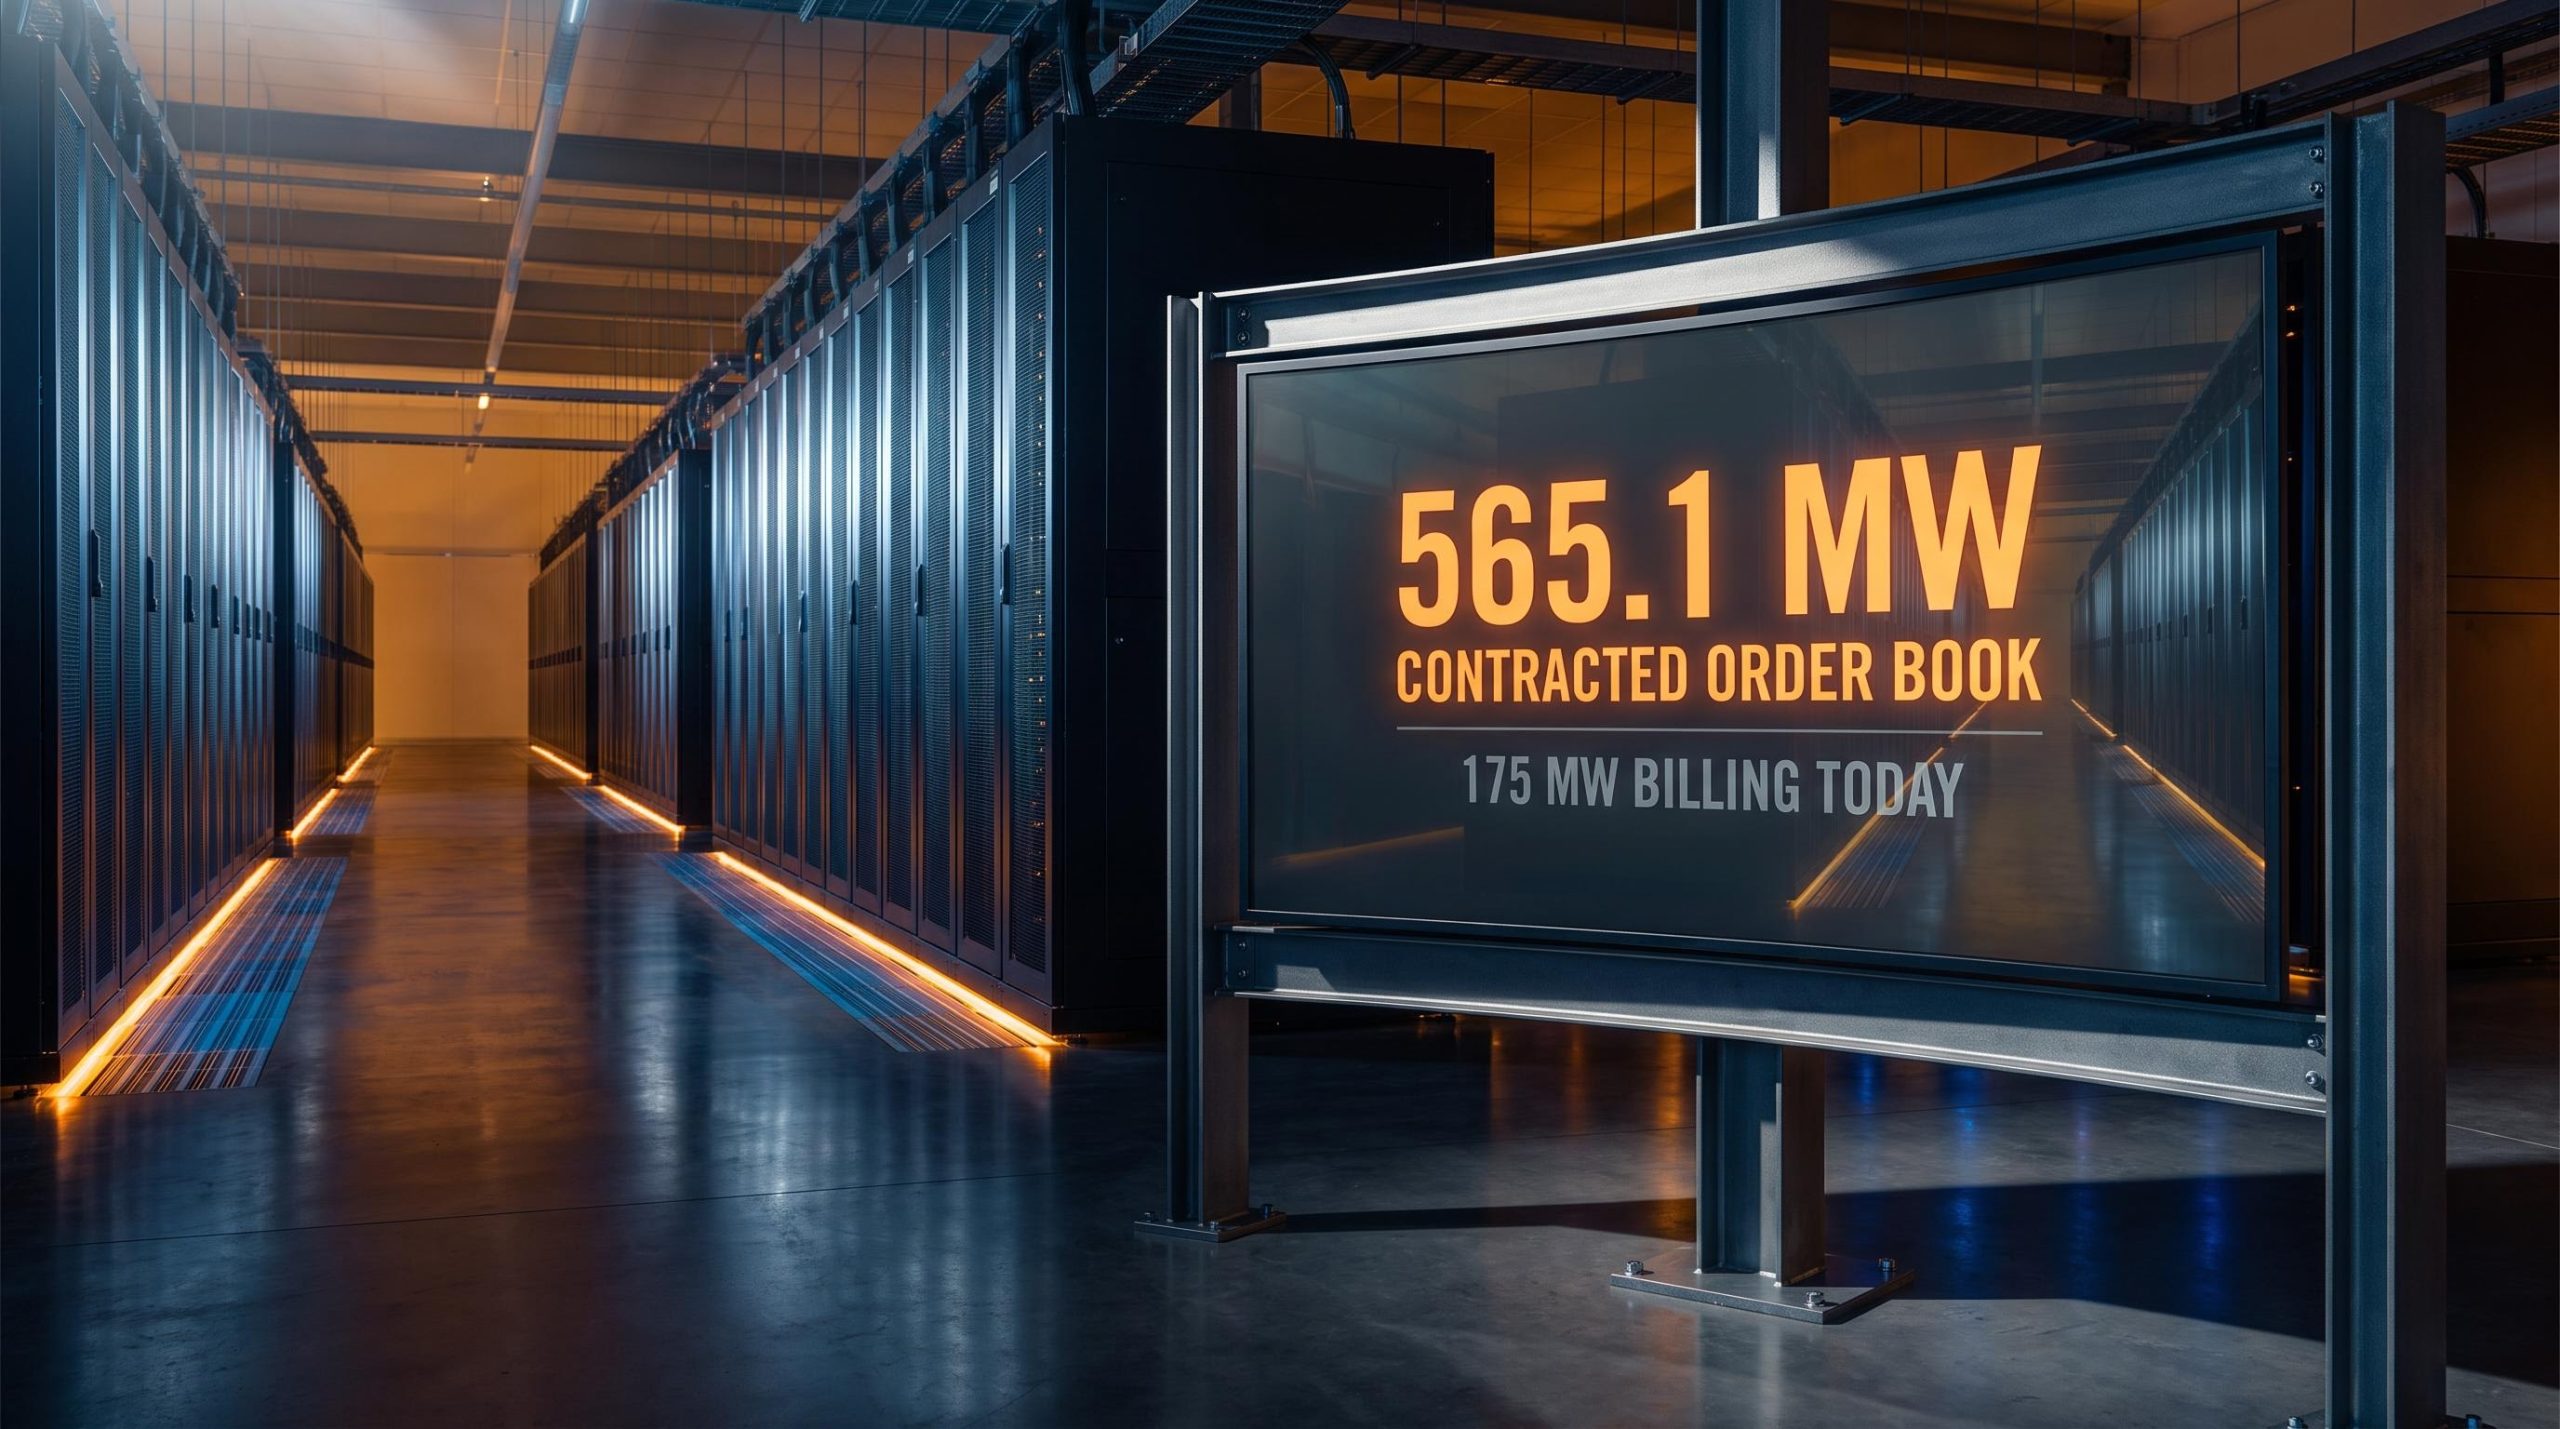
This is not a speculative buildout chasing customers who may or may not arrive. NextDC closed FY2026 with a forward order book of 565.1 MW of contracted capacity against just 175 MW currently billing. The gap between what the company is invoicing today and what its customers have already committed to is the structural engine behind a 52-58% revenue growth target, and it reframes how you should evaluate the risk.
Here is a framework for assessing whether that FY2027 guidance represents genuine value creation or a growth story the market has already priced in. By the end, you will know where the execution risk actually sits, how the capital structure funds this buildout, why two prominent analysts disagree on fair value by more than $3.00 a share, and whether NextDC at current prices fits your specific investment profile.
Why the 55% revenue target is more credible than it looks
A 55% revenue growth target from an ASX 100 infrastructure company should invite scepticism. That is the right starting position. What dismantles it is the mechanism behind the number.
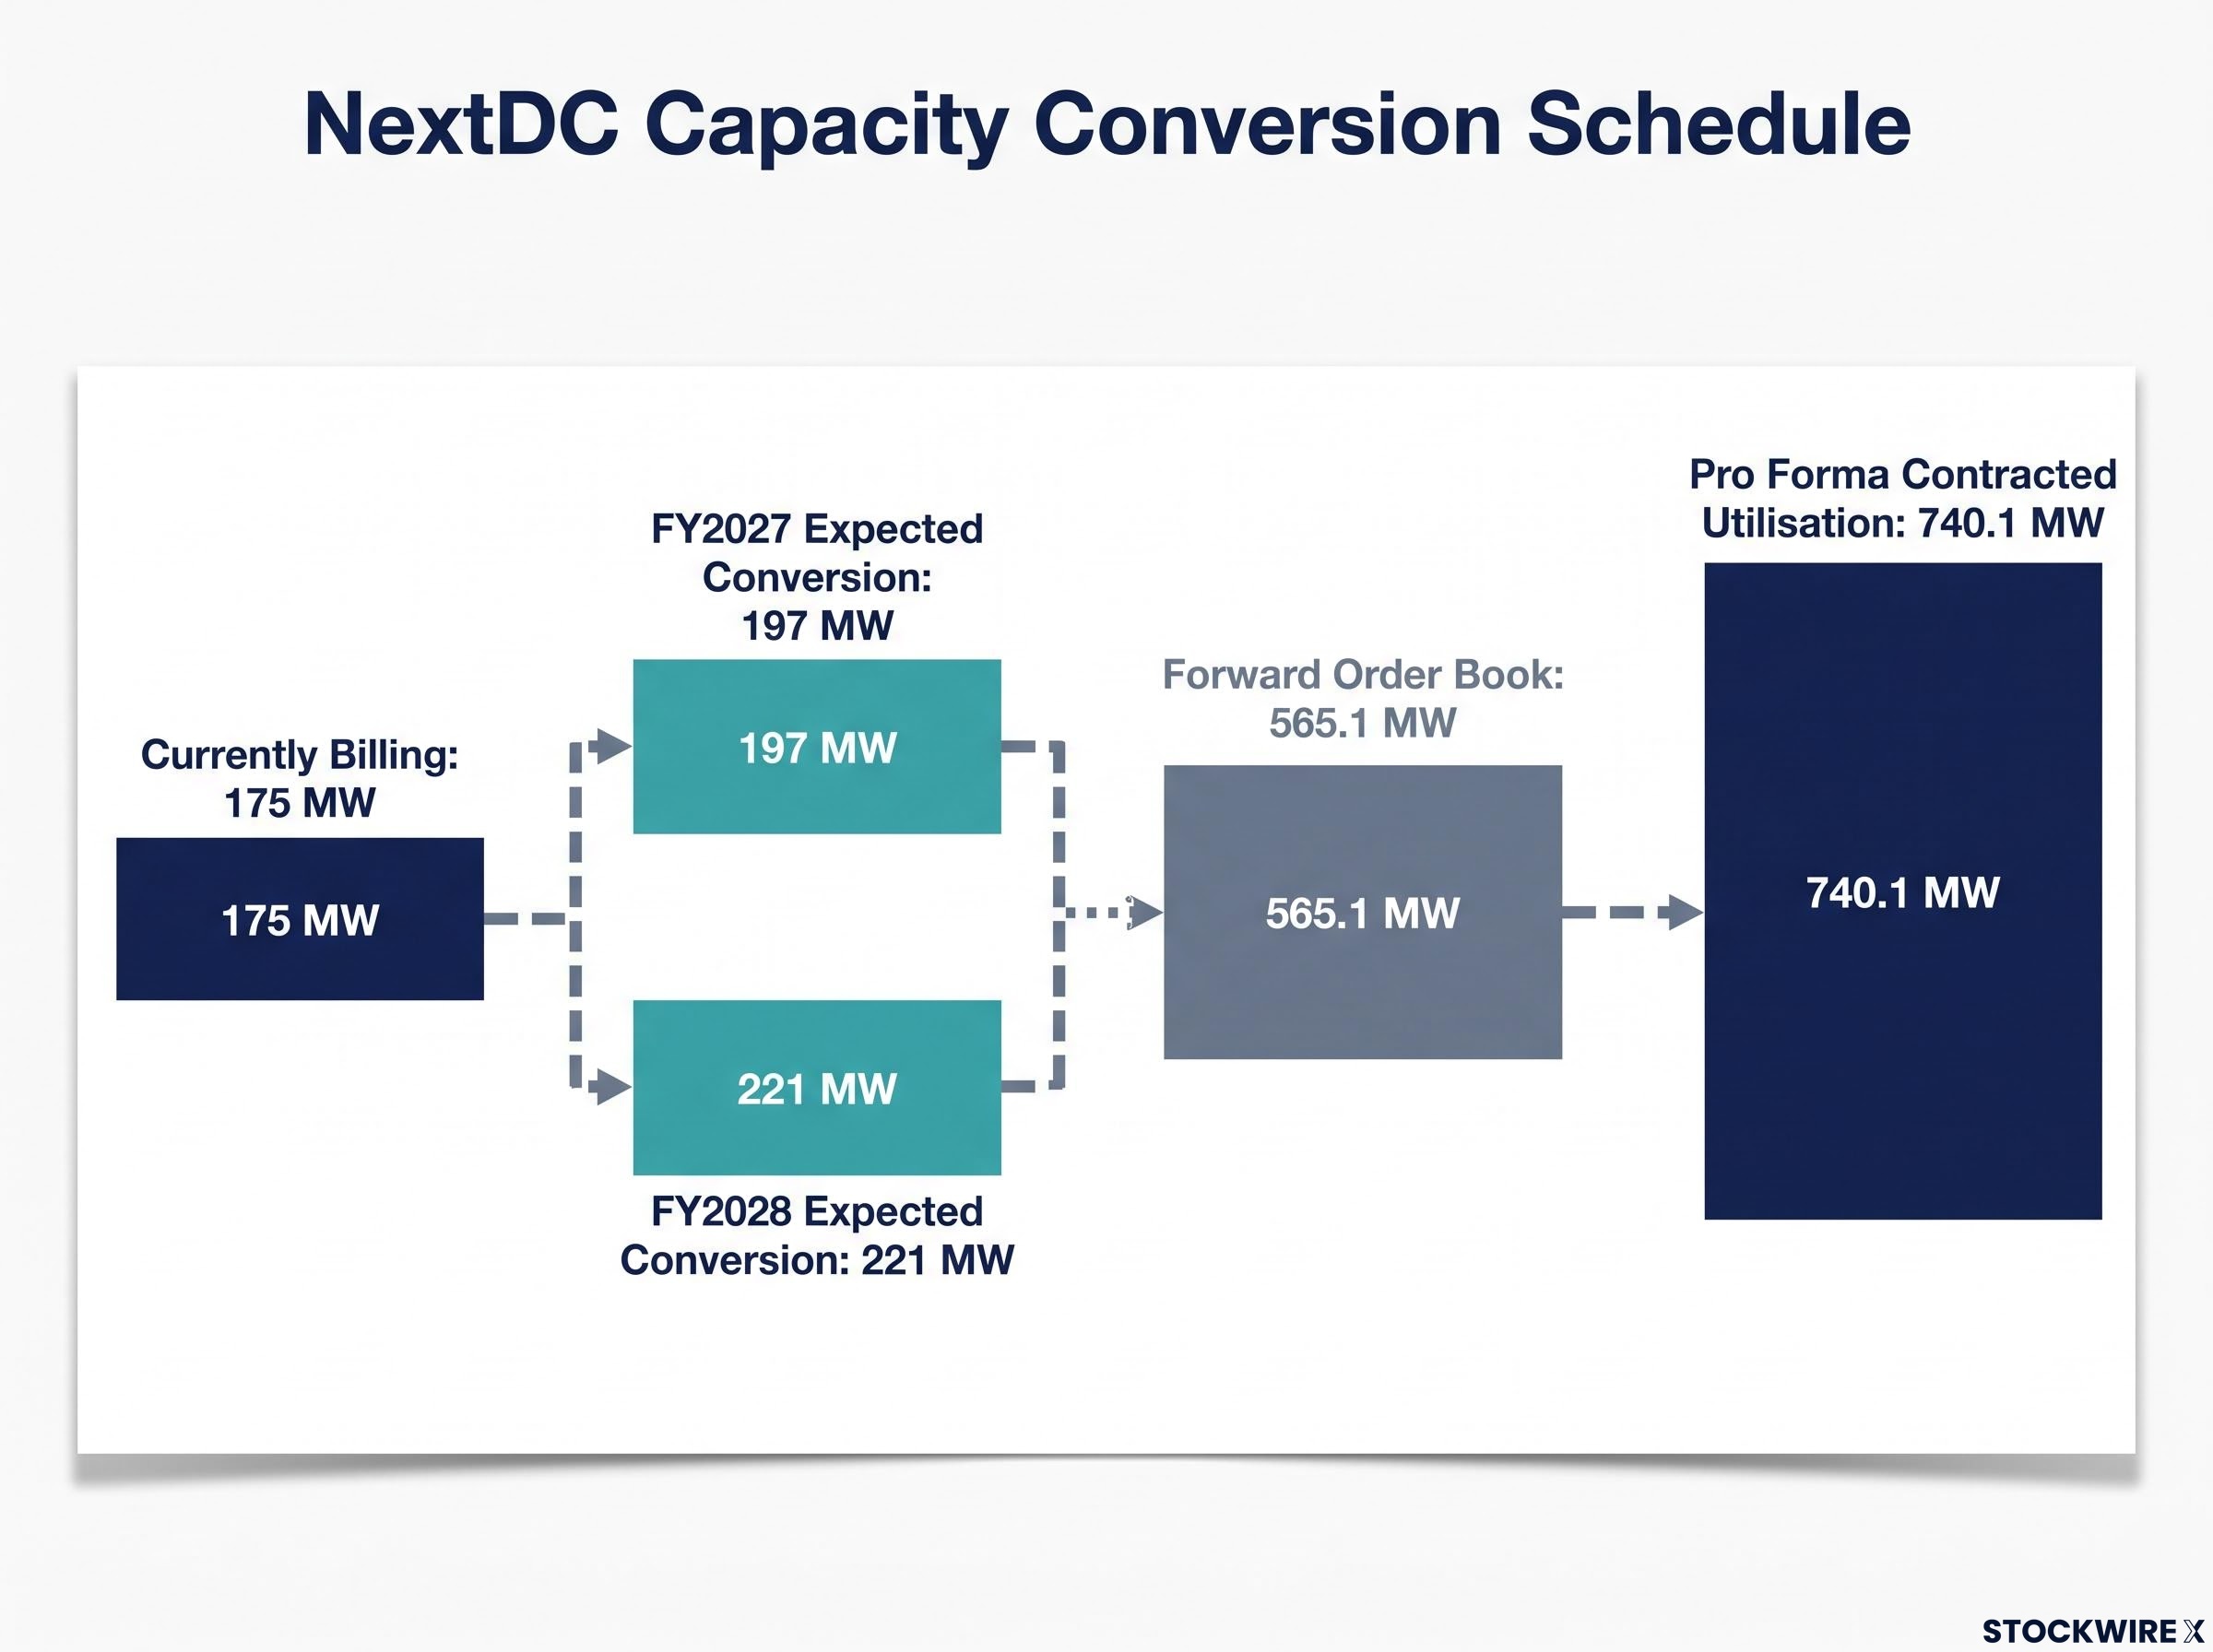
NextDC currently bills 175 MW of data centre capacity. Its contracted utilisation, the capacity customers have already signed for but that has not yet been built, commissioned, and switched on, stands at 740.1 MW on a pro forma basis. That is a forward order book of 565.1 MW sitting between today’s revenue and the guidance target.
FY2027 net revenue guidance of $615-$640 million, up from $405 million in FY2026, does not depend on winning new customers. It depends on converting existing contracts into operational, billable capacity. Management expects 197 MW to convert to billing in FY2027 and a further 221 MW in FY2028. Morgan Stanley estimates that approximately 74% of the total order book should become billable within two years.
The FY2026 year alone produced 495 MW of new contract wins, underscoring how contracted demand has surged well ahead of current revenue. What you are looking at is a conversion schedule, not a sales forecast.
The S4 Western Sydney facility anchors a significant portion of the forward order book, with the single 250MW contract signed at S4 in April 2026 representing the largest capacity addition in a single transaction in the company’s history and lifting pro forma contracted utilisation by 60% in one quarter.
| Metric | FY2026 Actual | FY2027 Guidance |
|---|---|---|
| Net Revenue | $405 million | $615-$640 million (+52-58%) |
| Underlying EBITDA | $248.8 million | $385-$410 million (+55-65%) |
| Capex | $3.4 billion | $5.25-$5.75 billion (+55-69%) |
| Billing MW Conversion | 175 MW billing | +197 MW converting in FY2027 |
Morgan Stanley characterised the capex increase as “driven by higher demand and a strong development pipeline,” maintaining an overweight rating with a target price of $19.00.
Where the execution risk actually lives
The risk is not demand. The contracts exist. The risk sits in three specific operational categories: construction timelines, power and grid availability, and supply chain constraints. If data centre builds fall behind schedule, contracted megawatts do not convert to billing on time, and the revenue step-up compresses into later periods. Grid access in particular is becoming a bottleneck across Australian infrastructure projects. These are measurable risks with observable lead indicators, which makes them monitorable, but they are real.
When big ASX news breaks, our subscribers know first
What $5.5 billion in capex demands from the balance sheet
The FY2027 capex range of $5.25-$5.75 billion includes approximately $500 million of reimbursable customer fit-outs. Even netting that out, the core capital programme approaches the company’s entire prior investment history compressed into twelve months.
NextDC’s FY2027 capex alone approaches the $9.2 billion the company spent cumulatively from its founding in 2011 through to FY2026, a single-year programme that rivals a decade of prior investment.
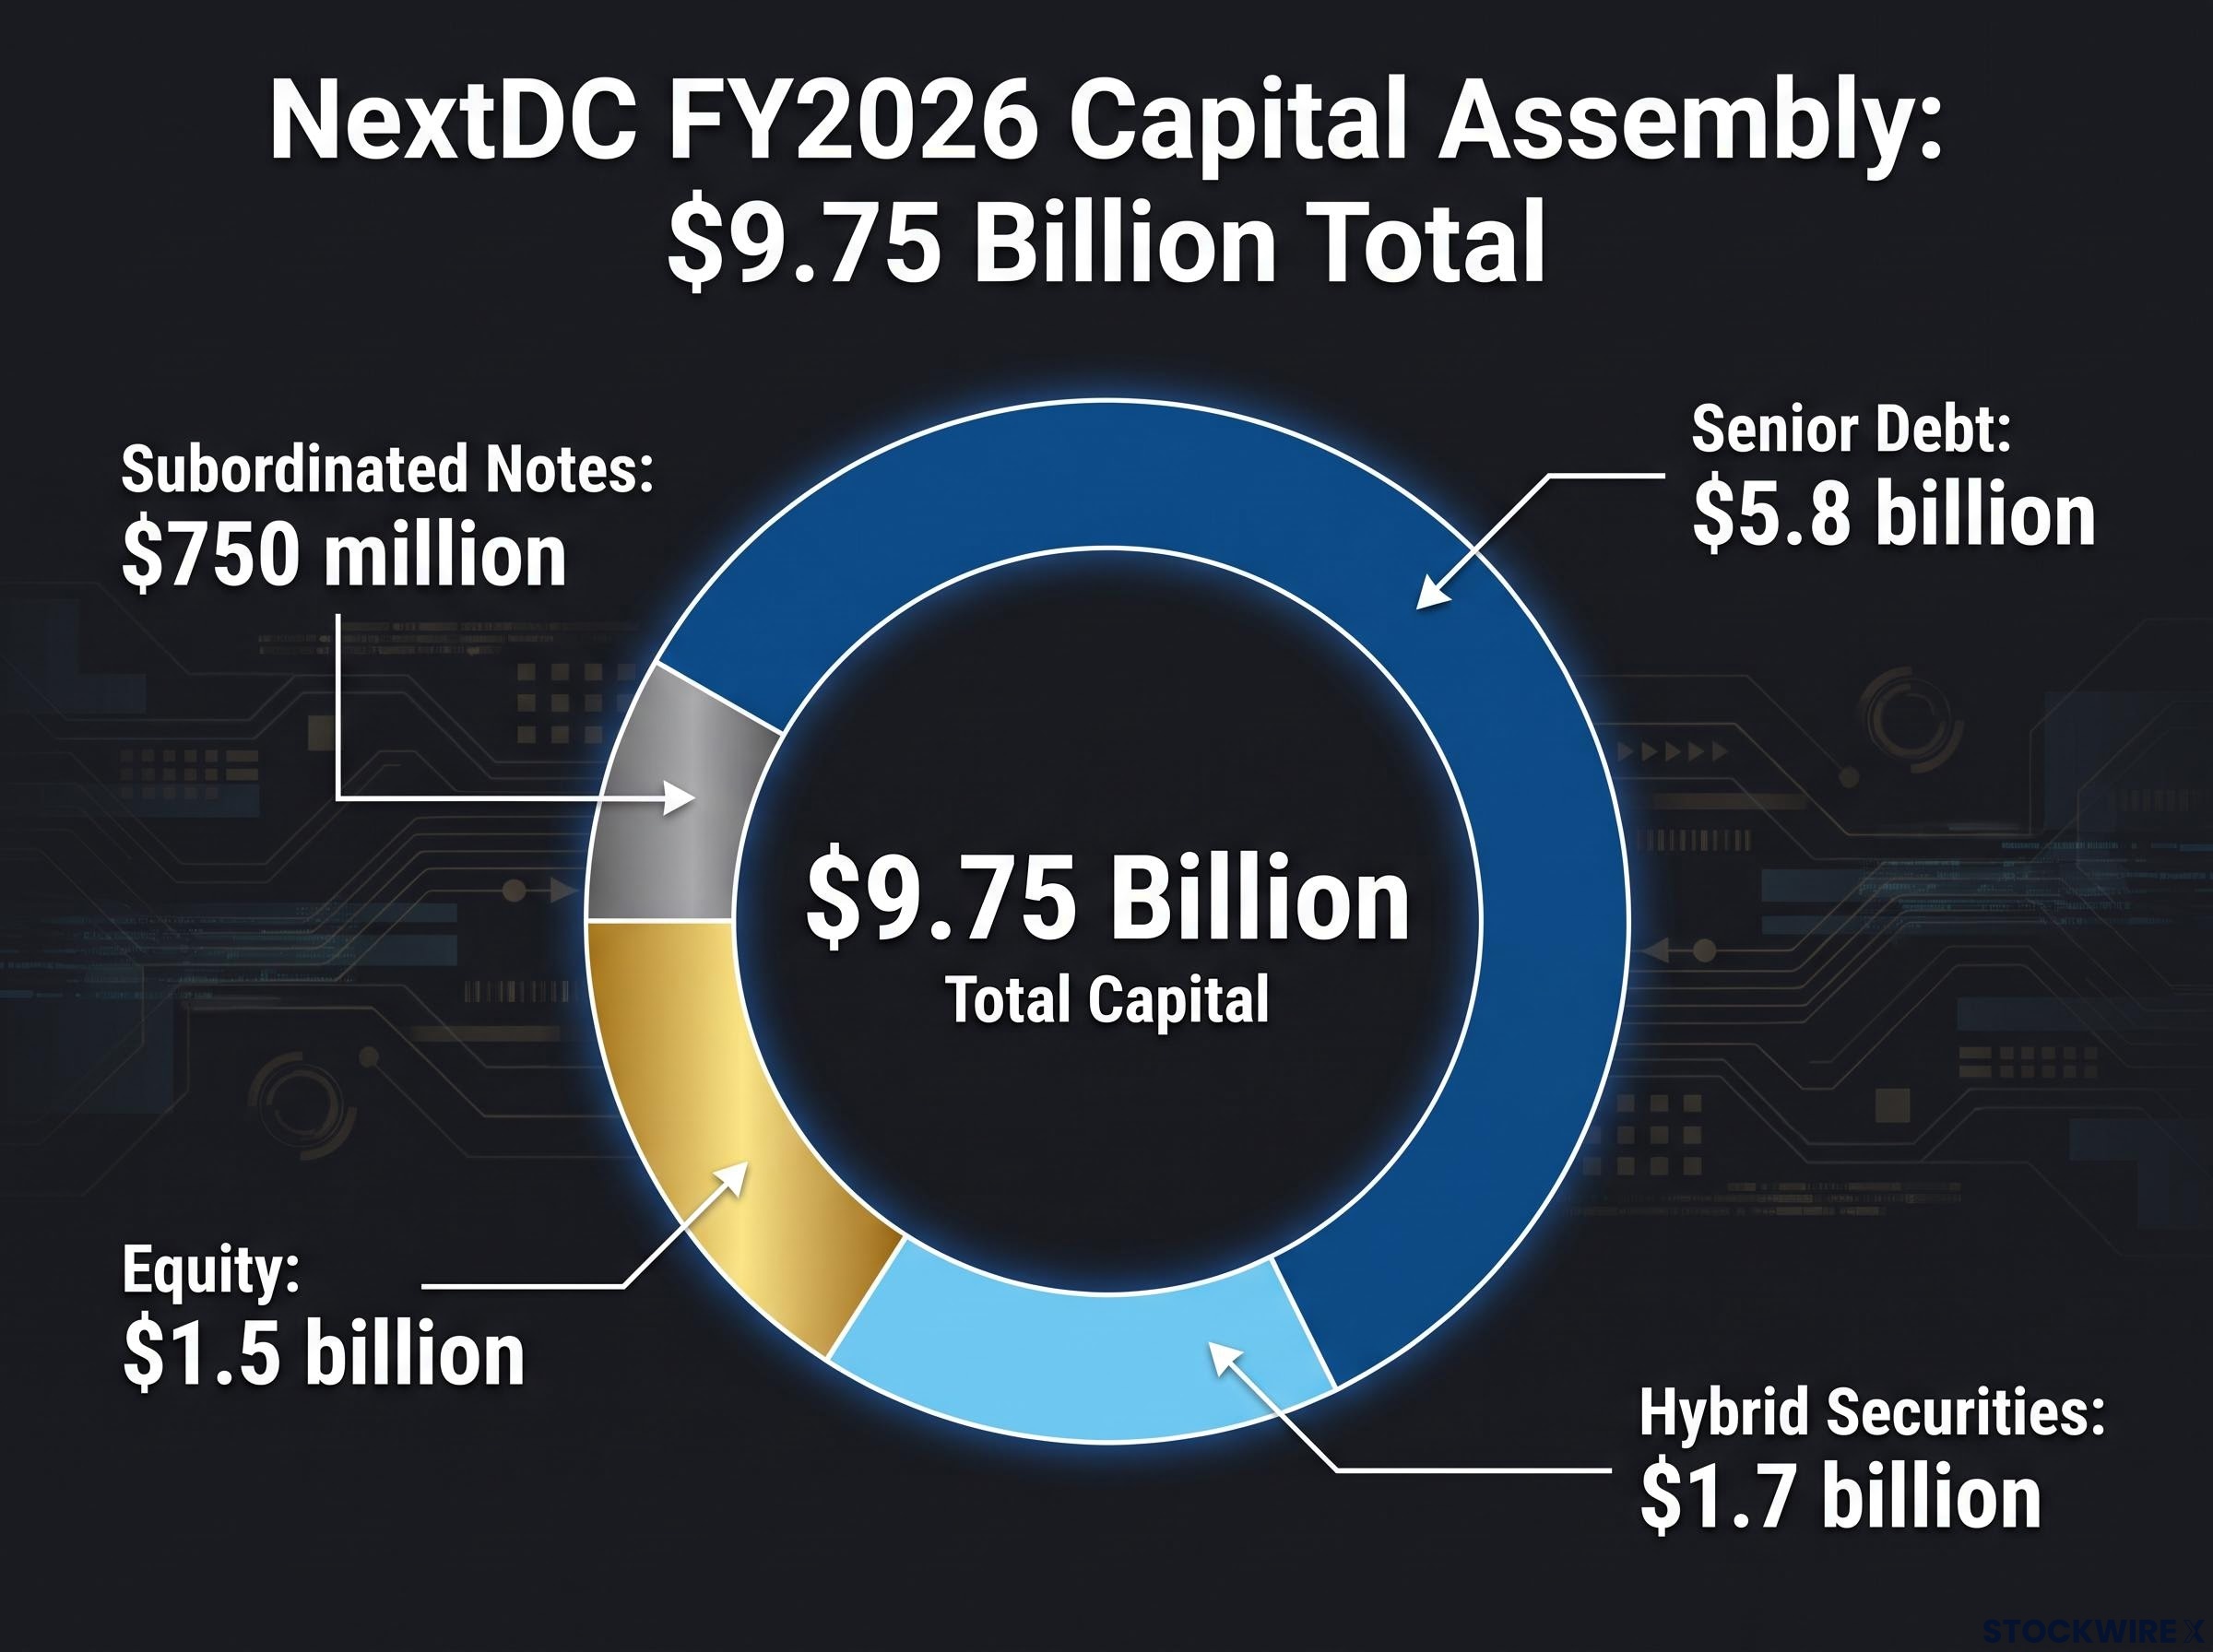
To fund this, NextDC assembled $9.75 billion in fresh capital across FY2026, structured across four distinct instrument categories:
- $5.8 billion in senior debt
- $750 million in subordinated notes
- $1.7 billion in hybrid securities
- $1.5 billion in equity
This is not a company that went to the equity market cap in hand. Management structured the capital stack across senior secured, subordinated, hybrid, and equity layers, each carrying a different cost profile and a different position in the repayment hierarchy. The effect is to manage weighted average cost of capital across the cycle rather than relying on any single instrument.
The hybrid securities structure NextDC used in April 2026 was deliberately engineered to avoid creating new ordinary shares, with no equity conversion feature, which helps explain why a $1.7 billion raise was met with a 21.6% share price rally rather than the dilution-driven sell-off that typically accompanies large capital programmes.
Available pro forma liquidity at 30 June 2026 stood at $8.676 billion, comprising cash of $876 million plus undrawn facilities. That backstops the near-term programme, but the sheer scale of ongoing capex means further capital market access will be required over time.
Dilution and joint venture risk as ongoing features
At this scale, further equity raises are probable rather than merely possible. Each raise is only value-neutral or accretive if the return on invested capital from new projects clears the cost of equity. If it does not, existing shareholders absorb the dilution without commensurate value creation.
Joint venture structures, where NextDC sells down partial stakes in stabilised assets to institutional partners, offer a capital recycling mechanism that could reduce the frequency of equity raises. But joint ventures introduce their own execution and timing risks. A sale that takes six months longer than planned leaves a funding gap somewhere else in the programme.
Decoding the divergent analyst views on NextDC’s fair value
At approximately $13.81-$13.87 in late August 2026, NextDC sits at different distances from two prominent fair value estimates, and the gap between them tells you something important about the valuation question.
| Source | Valuation | Implied Upside | Methodology |
|---|---|---|---|
| Morningstar (Dan Baker) | $15.60 | ~13% | Conservative DCF; stock rated “fairly valued” |
| Morgan Stanley | $19.00 | ~37-38% | Overweight; higher execution confidence, more aggressive terminal value |
| Current Price | ~$13.81 | — | Market pricing (late August 2026) |
Morningstar analyst Dan Baker published a fair value estimate of $15.60 per share on 1 September 2026, concluding that the stock is trading in line with its intrinsic worth at current market prices.
The spread between $15.60 and $19.00 is not a discrepancy you can arbitrage by picking the “right” analyst. It reflects a genuine divergence in methodology. Morningstar’s DCF is conservative on discount rate assumptions; for a long-duration asset with back-loaded cash flows, a small increase in the discount rate compresses intrinsic value materially. Morgan Stanley’s higher target reflects greater confidence in execution speed and a more aggressive view on terminal value.
CBRE’s 2026 Asia-Pacific data centre outlook identifies AI workload intensity and hyperscaler forward commitments as the primary drivers of regional capacity expansion, providing independent third-party context for the contracted demand profile that underpins NextDC’s 565 MW order book.
The stock’s price-to-book ratio sits at roughly 2.4 times, and its estimated beta of approximately 1.95 (directional estimate, not independently verified) confirms the market is pricing this as a high-volatility, long-duration growth equity. On the cash flow side, Morningstar notes that cumulative free cash outflow across the prior five years reached approximately negative $6.8 billion, with a projected further $7.9 billion in outflows over the following four years before longer-term generation improves.
What this tells you is that your own view on interest rates and execution speed directly determines whether you see value here. The valuation question is genuinely open, not settled, and the spread between these targets is the market telling you so.
Who should own NextDC at current prices, and who should wait
The suitability question is not about risk appetite in the abstract. It turns on three specific investor characteristics: time horizon, tolerance for prolonged negative free cash flow, and comfort with a complex, levered capital structure that will periodically return to capital markets.
More suitable for
- Long-horizon growth investors comfortable underwriting multi-year negative free cash flow in exchange for potential scale advantages in AI-driven digital infrastructure
- Investors with a specific view on AI infrastructure demand in Australia and Asia-Pacific, backed by the 565 MW forward order book as a confidence anchor
- Investors who can actively monitor order book conversion and capex discipline on a quarterly basis
Less suitable for
- Income investors requiring near-term dividends or visible free cash flow; the projected $7.9 billion in FCF outflow over the next four years means capital returns are structurally inaccessible over that period
- Investors with a sub-five-year horizon; this is a 10-to-15-year infrastructure growth story, and the value creation sits beyond the current buildout phase
- Investors uncomfortable with refinancing risk, leverage, or episodic equity dilution as persistent features of ownership
The “wait” case is not a dismissal. A more cautious investor should look for one of three triggers: an inflection toward positive free cash flow, a wider discount to intrinsic value than the current 13% below Morningstar’s estimate, or clearer evidence on return on invested capital from the first completed large-scale AI facilities.
AI infrastructure investment on the ASX spans more than one vehicle: colocation operators like NextDC, property trusts like Goodman Group, and network services providers like Megaport each represent a different risk and return profile within the same structural trend, which matters for investors deciding how much concentration they want in a single operator at this stage of the cycle.
In 2025, interconnection revenue accounted for roughly 8.6% of NextDC’s net recurring revenue, offering a secondary signal worth tracking. It measures ecosystem stickiness beyond raw capacity billing and indicates whether NextDC’s facilities are becoming network hubs rather than just power shells.
For investors who do own the stock, three monitoring variables matter most:
- Order book conversion rate per quarter: Are contracted megawatts converting to billed megawatts at the pace management projected?
- Capex discipline relative to guidance: Is the actual spend tracking within the $5.25-$5.75 billion range, or is cost escalation emerging?
- Joint venture execution timeline: Are asset sell-downs proceeding on schedule, or is the capital recycling mechanism stalling?
What the order book conversion rate will tell you long before the revenue does
The analytical tension at the centre of this stock is clear. The growth is credible and contract-backed. The valuation is not deeply discounted. The execution risk is real but measurable, and it sits in construction timelines and grid access rather than in whether customers exist.
The single forward-looking indicator that matters most is whether contracted megawatts are converting to billed megawatts at the pace management has projected. This is the leading indicator that validates or challenges the entire thesis before quarterly revenue figures confirm it. If the 197 MW scheduled to convert in FY2027 arrives on time, the revenue guidance is simply arithmetic.
If execution holds, Morningstar’s fair value of $15.60 looks conservative and Morgan Stanley’s $19.00 target becomes progressively more credible. If execution slips, the current price of approximately $13.81 offers limited margin of safety for a stock with an estimated beta of approximately 1.95. The asymmetry is real, and the order book conversion rate is where you will see it first.
This article is for informational purposes only and should not be considered financial advice. Investors should conduct their own research and consult with financial professionals before making investment decisions. Past performance does not guarantee future results. Financial projections are subject to market conditions and various risk factors.