

Cromwell delivers 5% FFO growth as platform scale expands in FY26
In its FY26 results presentation released 27 August 2026, Cromwell Property Group reported Funds From Operations (FFO) up 5.0% to $110.3m (4.2 cps), with assets under management climbing 11.4% to $4.7bn and net tangible assets (NTA) rising 3.6% to 57.5 cps.
The result marked a return to profit, with statutory profit swinging to $135.8m from a $22.6m loss in FY25. Management outlined FY27 distribution guidance of 3.1 cps per security, up from FY26’s 3.0 cps.
The presentation attributed the growth to a new industrial platform, institutional mandates and disciplined capital management. FY26 also marked the adoption of FFO as the primary earnings measure, replacing Operating Profit, which the company said provides a clearer view of operating performance and “improving comparability with industry peers.”
When big ASX news breaks, our subscribers know first
FY26 results at a glance
The following table summarises the key full-year metrics reported in the presentation. AUM, gearing and related figures exclude 475 Victoria Ave, Chatswood, which was sold 14 July 2026.
| Metric | FY26 | FY25 | Change |
|---|---|---|---|
| FFO | $110.3m / 4.2 cps | $105.0m / 4.0 cps | +5.0% |
| Statutory profit | $135.8m | ($22.6m) | Return to profit |
| NTA | 57.5 cps | 56.0 cps | +3.6% |
| AUM | $4.7bn | $4.2bn | +11.4% |
| Gearing | 31.6% | 28.2% | +3.4pts |
| Liquidity | $370.8m | $504.3m | Lower |
| Distribution | 3.0 cps | 3.0 cps | Flat (FY27 guidance 3.1 cps) |
CEO Commentary
Chief Executive Officer Jonathan Callaghan framed the FY26 result as evidence of the platform building scale, with growth driven by new institutional mandates, the specialist industrial platform and strategic co-investments.
Building scale through strategic growth
The FY26 result was underpinned by expansion across Cromwell’s investment management platform, with group platform funds under management (FUM) up 11.4% on FY25. Management pointed to institutional capital as a central driver of the year’s growth.
Key growth pillars outlined in the presentation include:
-
Institutional capital growth of $748m in new mandates, comprising the $478m Cromwell Industrial Partnership acquisition, $113m in additional industrial mandates and the $157m Creek Street venture.
-
The acquisition of a specialist industrial platform, adding industrial development expertise and broadening investment management capabilities.
-
Newly established relationships with PAG and Straits, expanding access to institutional capital.
-
Strategic co-investments of 19.9% CIP and 5% 100 Creek Street, reinforcing partner alignment.
The capital-light Brisbane office venture with PAG, struck at approximately $159 million with Cromwell retaining the management role on a 5% co-investment, illustrates how the group is growing its fee-earning platform without heavy balance sheet deployment.
- Corporate costs down 17%, supported by the sale of the European operations and reduced onshore expenses.
These moves diversify income streams and broaden institutional access, positioning the platform as a potential engine of future earnings.
Investment Management platform gains momentum
Investment Management FUM reached $2.4bn, up 17.4% on FY25, while segment EBIT rose 77.1% to $14.7m, driven by the industrial platform, development activity and performance fees from Phoenix Funds following improved fund performance.
Three development projects advanced during the year. Kilsyth Connect was completed in June 2026, Stage 2 of Cavan Connect commenced, and Barton1 progressed on time and to budget, with completion due prior to the end of FY27.
Understanding FFO and why it matters for property investors
Funds From Operations (FFO) is an earnings measure used by real estate investment trusts (REITs). It strips out non-cash items, such as property revaluations, to show the underlying cash a portfolio generates from day-to-day operations.
Cromwell moved from Operating Profit to FFO in FY26 to provide a clearer view of operating performance and improve comparability with industry peers.
Related terms investors will encounter include NTA (net tangible assets per security, or the book value backing each security), the cap rate (capitalisation rate, a yield measure used to value property), and WALE (weighted average lease expiry, the average time until leases across a portfolio expire).
For investors, FFO helps judge whether distributions are supported by genuine operating earnings rather than one-off accounting gains.
Portfolio performance and capital position
The Investment Portfolio’s seven stabilised assets demonstrated valuation resilience, with valuations up 4.7% to $2.1bn and a $93.7m valuation uplift contributing to the NTA increase. Portfolio occupancy was 95.6% (from 97.6%), while WALE moved to 4.6 years (from 5.0 years).
The weighted average cap rate expanded to 7.20% (from 7.07%), influenced by market movements and asset-specific leasing positions. Rental reversion of 8.7% was achieved over the year, with future rental reversion potential of 8.7% flagged.
At 400 George Street, Brisbane, a temporary nine-month vacancy of 7,000 sqm ended with new occupation commencing 1 July 2026. A completed lobby upgrade supported the Queensland State Government’s exercise of its lease option, securing approximately 20,800 sqm through to 2030, and underpinned a $98m valuation uplift to $450m.
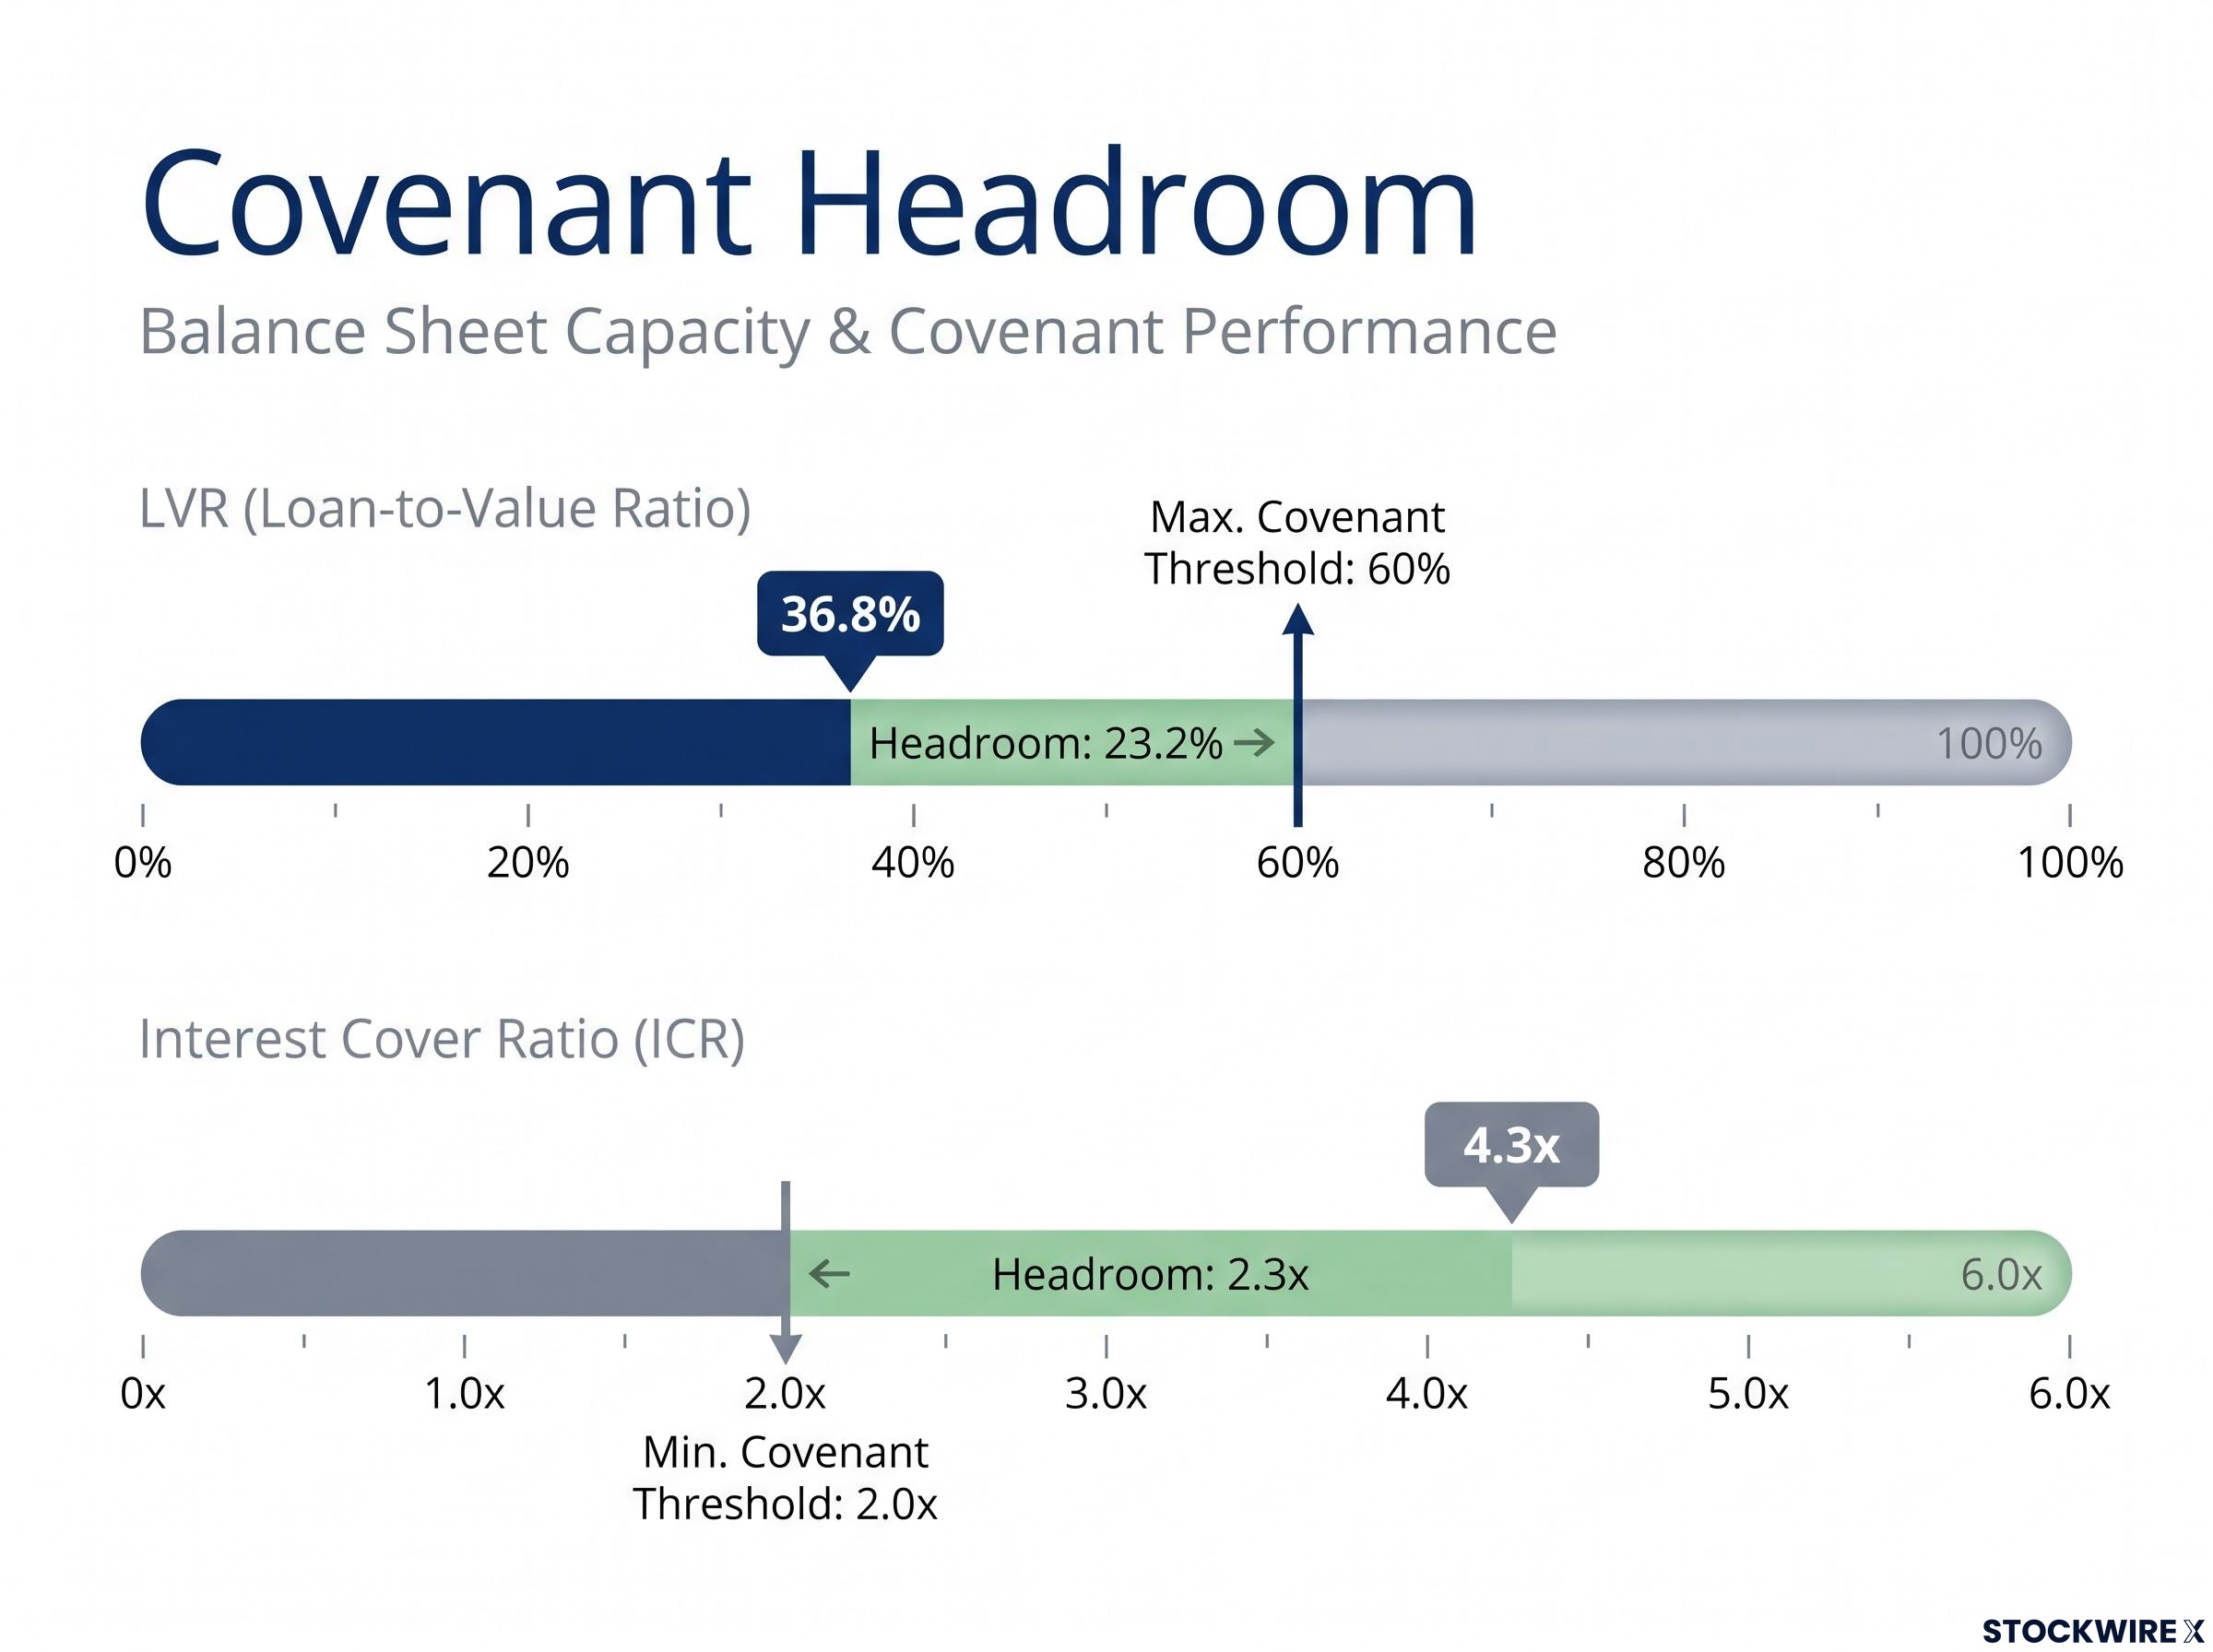
The balance sheet retained significant headroom:
The Chatswood joint venture exit, completed on 14 July 2026 with the settlement of Cromwell’s 50% stake in 475 Victoria Avenue, represents the asset recycling component of the group’s broader capital management strategy, freeing headroom for redeployment into higher-conviction positions.
-
Gearing of 31.6%, well within range, with an LVR of 36.8% against a 60% covenant.
-
Interest cover ratio (ICR) of 4.3x against a 2.0x covenant.
-
Interest rate hedging of 85.5% and a weighted average debt cost of 5.0%.
-
Liquidity of $370.8m and a weighted average debt maturity of 3.2 years.
This covenant headroom supports future capital deployment and growth opportunities.
Market outlook and FY27 priorities
Management’s forward view, as outlined in the presentation, described capital sentiment as cautious but recovering, with wariness around macroeconomic and geopolitical uncertainty. Limited new supply is expected to support a tightening of vacancy rates and rental growth across commercial property.
Cromwell noted its portfolio is more concentrated in better-performing precincts and that its assets typically outperform their market. FY27 distribution guidance was set at 3.1 cps per security, up from 3.0 cps.
The three FY27 priorities outlined are:
-
Investment management growth through new mandates, partnerships and co-investment, progressing Barton1 toward completion and pursuing a partial institutional sell-down and capital recycling, alongside strategic M&A.
-
Driving Investment Portfolio performance through key leasing initiatives, tenant retention and embedding ESG considerations.
-
Disciplined capital and cost management to preserve balance sheet flexibility while focusing on accretive, sustainable earnings growth.
The FY26 result provides the platform scale and capital flexibility that management intends to carry into its FY27 growth roadmap.
Don’t Miss the Next ASX REIT Mover
Big News Blast delivers FREE breaking ASX announcements straight to your inbox within minutes of release, complete with in-depth analysis already done for you. Join 20,000+ investors who stay ahead of the market on property and beyond. Click the “Free Alerts” button at the top of the page to get started.