
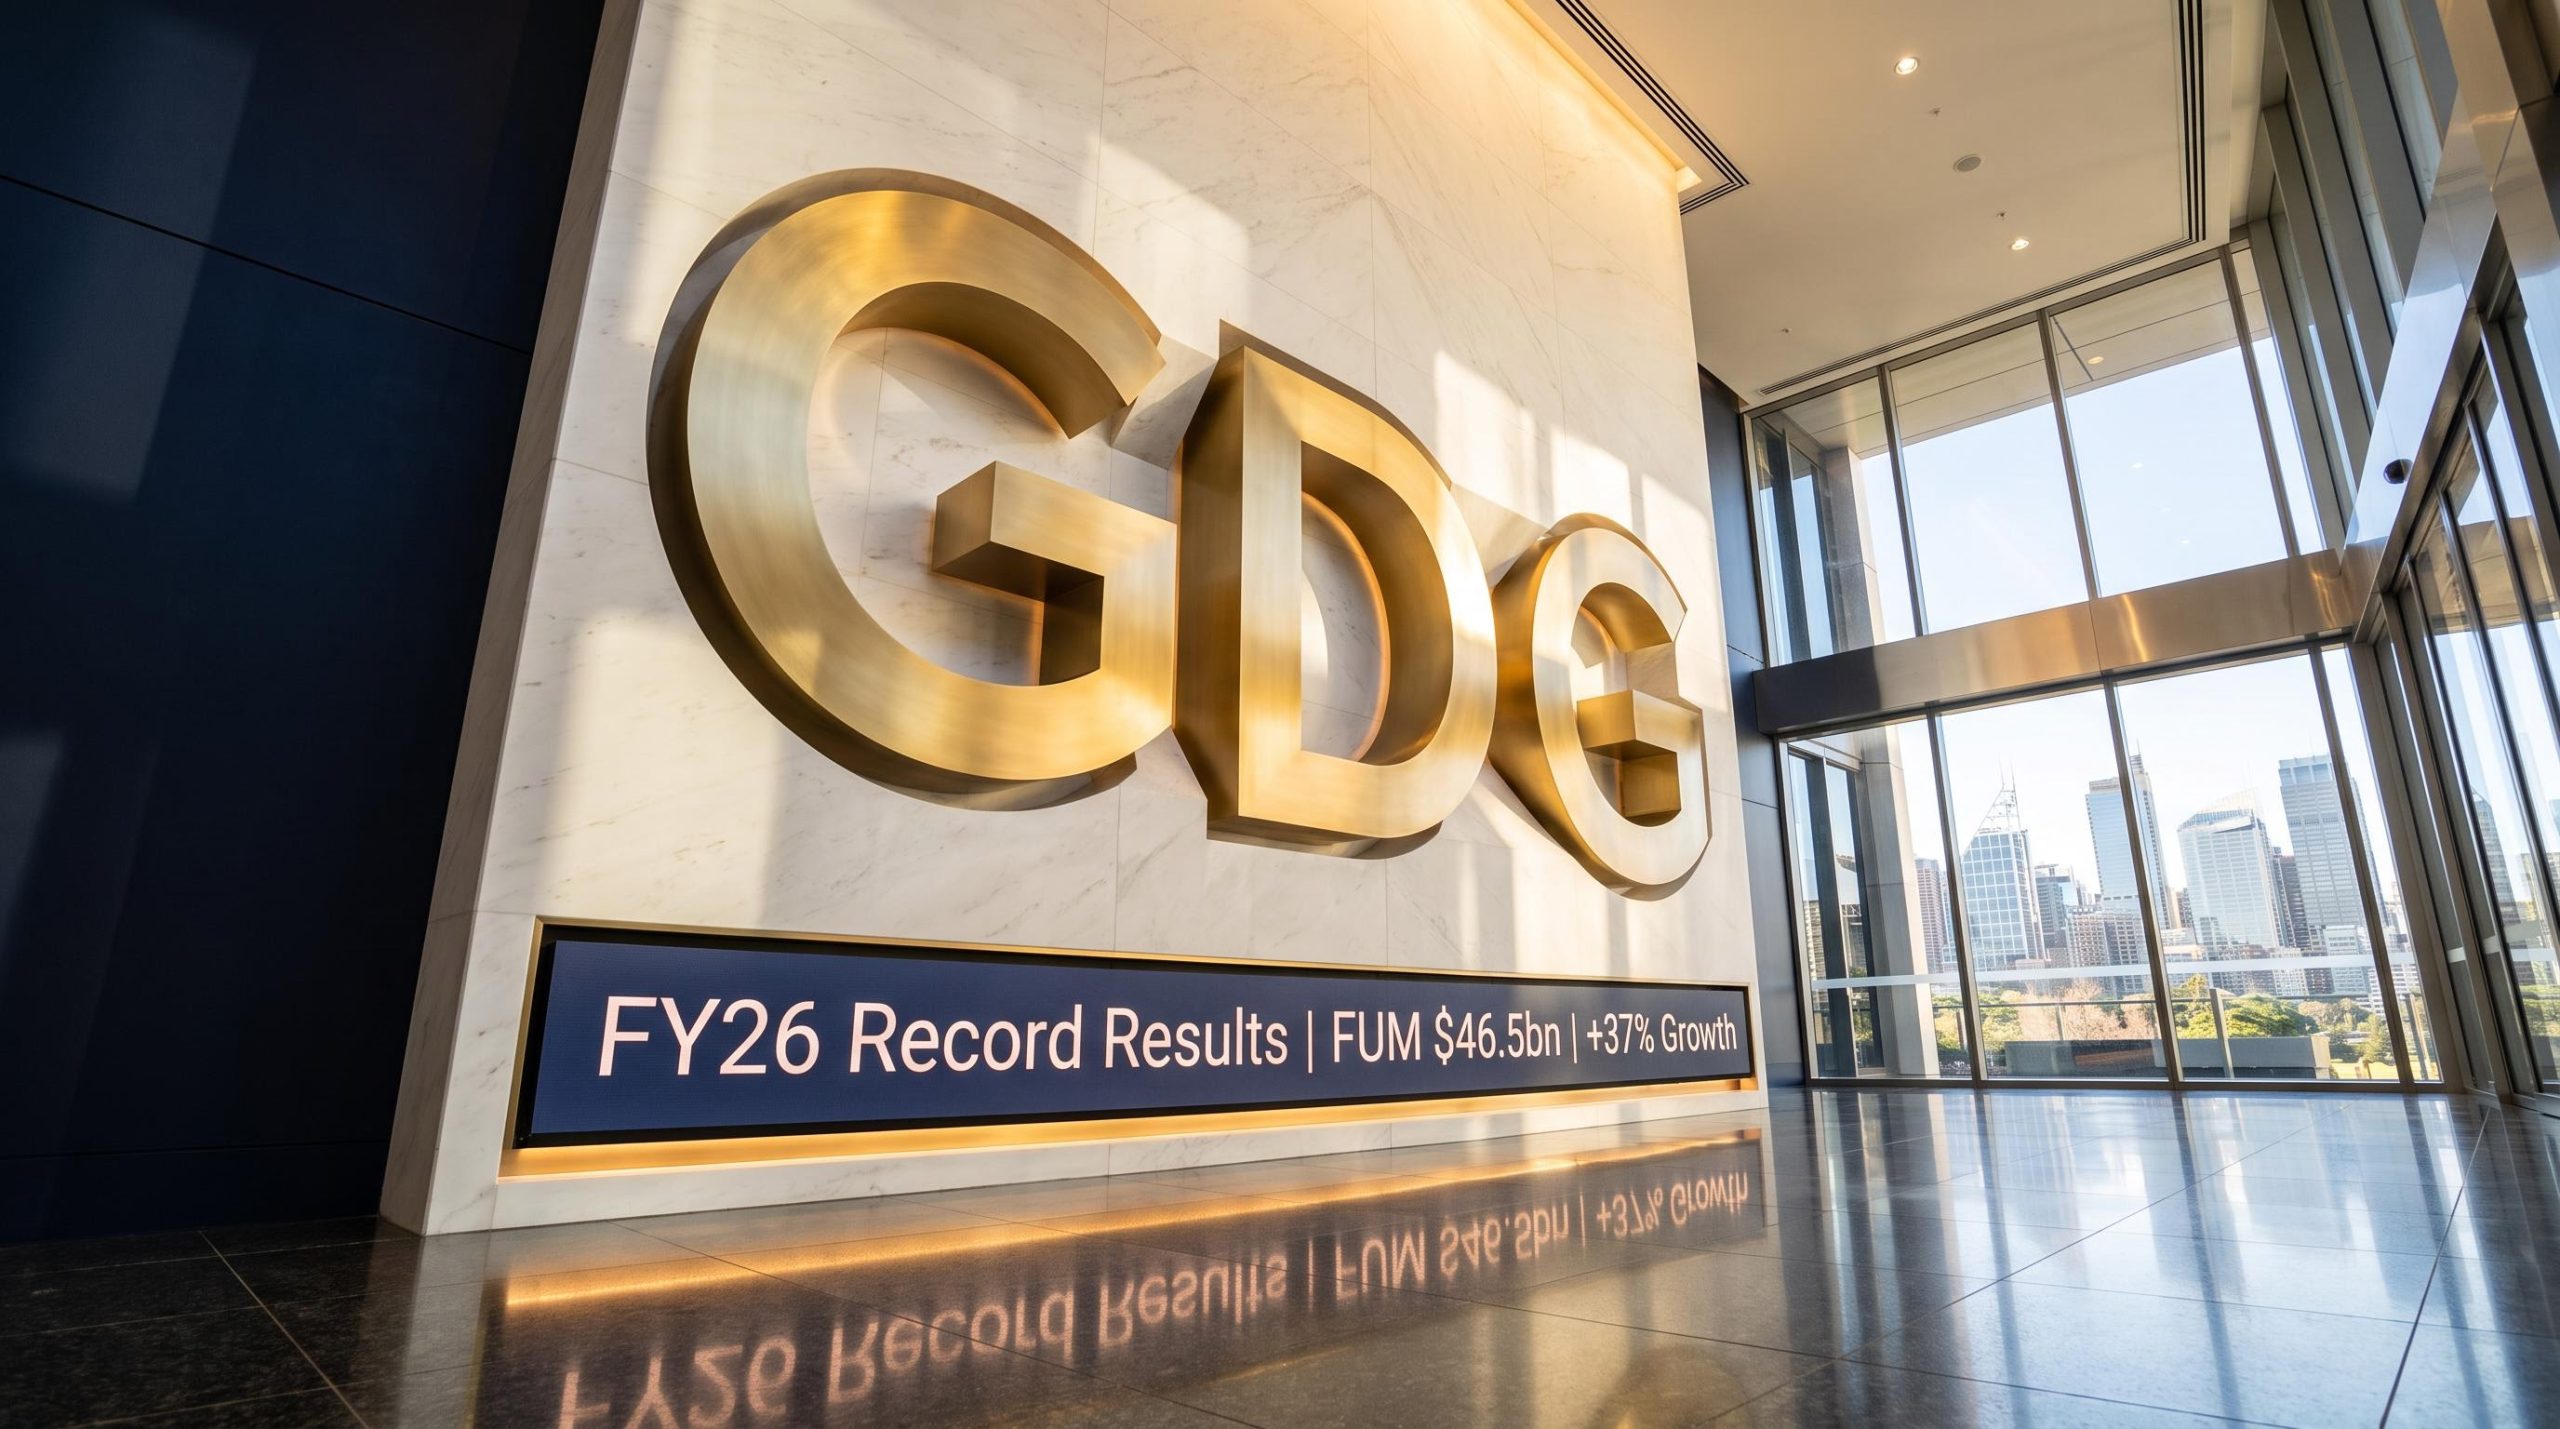
Generation Development Group posts record FY26 with FUM up 37% to $46.5bn
In its FY26 results presentation delivered on 27 August 2026, Generation Development Group outlined a record full-year result, with Group funds under management (FUM) rising 37% to $46.5bn. The presentation, led by Group Chief Executive Officer Grant Hackett OAM and Chief Financial Officer Andrew Mellor, detailed record flows across all three businesses: Generation Life, Evidentia Group and Lonsec.
Management highlighted record Group net inflows of $9.7bn (up 19%), Total Revenue of $178.7m (up 23%) and Underlying net profit after tax (NPAT) of $40.7m (up 21%).
The diversified financial services group holds #1 positions in investment bonds and managed accounts, with the presentation positioning the company to capture structural, demographic and legislative tailwinds across its core markets.
When big ASX news breaks, our subscribers know first
FY26 highlights — record flows across all three businesses
The presentation detailed how record performance was distributed across the Group’s three divisions. Net inflows were led by managed accounts, while Generation Life delivered its strongest percentage growth.
-
Generation Life net inflows of $1.3bn (up 61%)
-
Evidentia Group net inflows of $8.4bn (up 14%)
-
Lonsec researched products up 9% to 2,001; iRate subscribers up 13% to 5,629
The company noted continued market leadership positions across all three operating divisions, supported by the operating metrics below.
| Business | Metric | Value | Change |
|---|---|---|---|
| Generation Life | Investment Bond gross inflows (12-month) | $1.54bn | 52% |
| Generation Life | Active financial advisers | 2,913 | 10% |
| Evidentia Group | Managed Account net inflows (12-month) | $8.4bn | 14% |
| Evidentia Group | Key client relationships | 9 of top 10 licensees | — |
| Lonsec | Average spend per active SuperRatings client | $129k | 9% |
CEO Grant Hackett OAM
Presentation theme
The FY26 presentation framed the result around disciplined execution, sustained growth and targeted investment, with each division delivering record sales, FUM growth or an expanded service offering. No direct verbatim quotation from the Group CEO was disclosed in the presentation materials.
What are investment bonds and managed accounts?
Generation Development Group’s growth is driven by two core product engines, both of which produce recurring FUM-based revenue.
Investment bonds are tax-effective, long-term wealth and estate planning structures held outside superannuation. They are used by advisers to help clients accumulate and transfer wealth in a tax-efficient manner over extended timeframes.
Managed accounts, including separately managed accounts (SMAs) and managed discretionary accounts (MDAs), are portfolio solutions that advisers use to deliver scalable, governed investment advice to clients.
Both are considered “sticky” FUM businesses, generating recurring revenue over long durations. The presentation noted the average investment term across all active Investment Bonds now exceeds 15 years (up from 14.5 years in FY25), reinforcing the long-term, recurring and resilient nature of the revenue base.
Segment financial performance
The presentation detailed a three-division earnings story, with management emphasising operating leverage and margin expansion. Generation Life delivered the strongest earnings growth, with Underlying EBITDA up 57%, while Lonsec continued to generate high-margin, predictable cashflow.
| Business | Revenue | Rev Change | Underlying EBITDA | EBITDA Change |
|---|---|---|---|---|
| Generation Life | $73.9m | 34% | $23.3m | 57% |
| Evidentia Group | $58.8m | 26% | $25.1m | 22% |
| Lonsec | $45.8m | 7% | $22.8m | 15% |
| Group | $178.7m | 23% | $59.2m | 18% |
Generation Life revenue includes the Income Tax Rebate, and its Underlying EBITDA margin expanded to 32% (up 5pp). Lonsec, described as a high-cashflow, market-leading brand, delivered a margin of 50% (up 3pp).
Consolidated result
The consolidated result showed broad-based growth across the Group’s key measures.
-
Total Revenue $178.7m (up 23%)
-
Underlying EBITDA $59.2m (up 18%)
-
Underlying NPAT (after annuity business costs) $40.7m (up 21%)
-
Underlying EPS 10.2 cents (flat, with underlying profit growth offset by growth in shares issued)
-
Full-year dividend 2.0 cents fully franked, including a final dividend of 1.0 cent declared
Statutory NPAT was $31.9m (down 17%).
A “once in a lifetime” TAM opportunity — the strategic thesis
Management framed the investment thesis around structural, demographic and legislative tailwinds across its core markets, describing the total addressable market (TAM) opportunity as “once in a lifetime”.
-
The Investment Bond TAM is expected to reach approximately $60bn FUM by 2035, with Generation Life holding a record 59% share of annual market inflows to March 2026 and a 39.1% share of market FUM
-
Division 296 super tax is expected to drive increased demand for structures outside superannuation
-
The managed account sector is forecast to exceed $520bn by 2030, with Evidentia ranked #1 at 12.9% share and growing approximately 1.8x system
-
Superannuation assets are projected to grow from $4.5tn to $12.4tn by 2045
-
An estimated $5.4tn is expected to pass between generations over the next 20 years, supporting continued estate-planning demand
These dynamics position the Group to capture regulatory and demographic tailwinds across all core markets, though the outcomes remain subject to market conditions and legislative developments.
Integration complete and a disciplined growth roadmap
The presentation covered strategic execution and forward priorities. The integration of Evidentia and Lonsec Investment Solutions was completed in June 2026, delivered on time and within budget, forming the Evidentia Group as one scalable, differentiated wealth business.
The Xplore Wealth migration, completed in May 2026, transferred $1.8 billion in MDA portfolios onto the HUB24 platform and pushed Evidentia’s Implemented Portfolios business past $4 billion in FUM, validating the M&A integration capabilities that underpin the broader growth roadmap.
Additional strategic initiatives outlined included:
-
The acquisition of Encore Advisory Services, expanding consulting and practice transformation capabilities
-
The launch of Lonsec Governance Solutions to meet growing demand for governance support and investment oversight
-
Increasing distribution capabilities through strategic partnerships, including BlackRock, Colonial First State and others
Management also outlined a disciplined, capital-light and partnership-led approach to AI deployment across the Group, underpinned by a Board-endorsed AI Governance Framework. The company noted the approach is productivity-led, with no reliance on AI for near-term revenue growth.
Balance sheet strength
The presentation detailed a strong balance sheet supporting disciplined capital allocation.
-
Cash and cash equivalents of $114.8m; Net Assets of $731.9m
-
A new $50m NAB debt facility, with $40m drawn at year end
-
A corporate net cash position of $57.5m, providing balance sheet flexibility for disciplined capital allocation and selective M&A
The Group’s strategic acquisition framework targets sustainable 15%–20% earnings growth through earnings-accretive bolt-ons aligned to strategy, while maintaining a conservative balance sheet.
Outlook — three-to-five-year objectives on track
Closing on forward guidance, management outlined that its three-to-five-year objectives remain on track, subject to market conditions.
-
Across the Group, the company expects to continue to outperform system growth and expand market share in FY27
-
Individual product revenue margins are expected to remain broadly stable
-
FY27 Group underlying operating expense growth is expected to remain broadly in line with the growth rate in FY26
-
Generation Life capex in FY27 and FY28 is expected to be approximately 5%–15% per annum of FY27 Generation Life total revenue
-
An ongoing net cash position is expected to support disciplined capital allocation and balance sheet flexibility
Management positioned the Group to convert structural, demographic and legislative tailwinds into sustained FUM, earnings and shareholder value over the medium term.
Stay Ahead on ASX Financial Services News
Get breaking ASX announcements delivered to your inbox within minutes, complete with in-depth analysis already done for you. Join 20,000+ investors who rely on Big News Blast for FREE real-time alerts the moment market-moving news hits. Click the “Free Alerts” button to stay ahead before the market moves.