

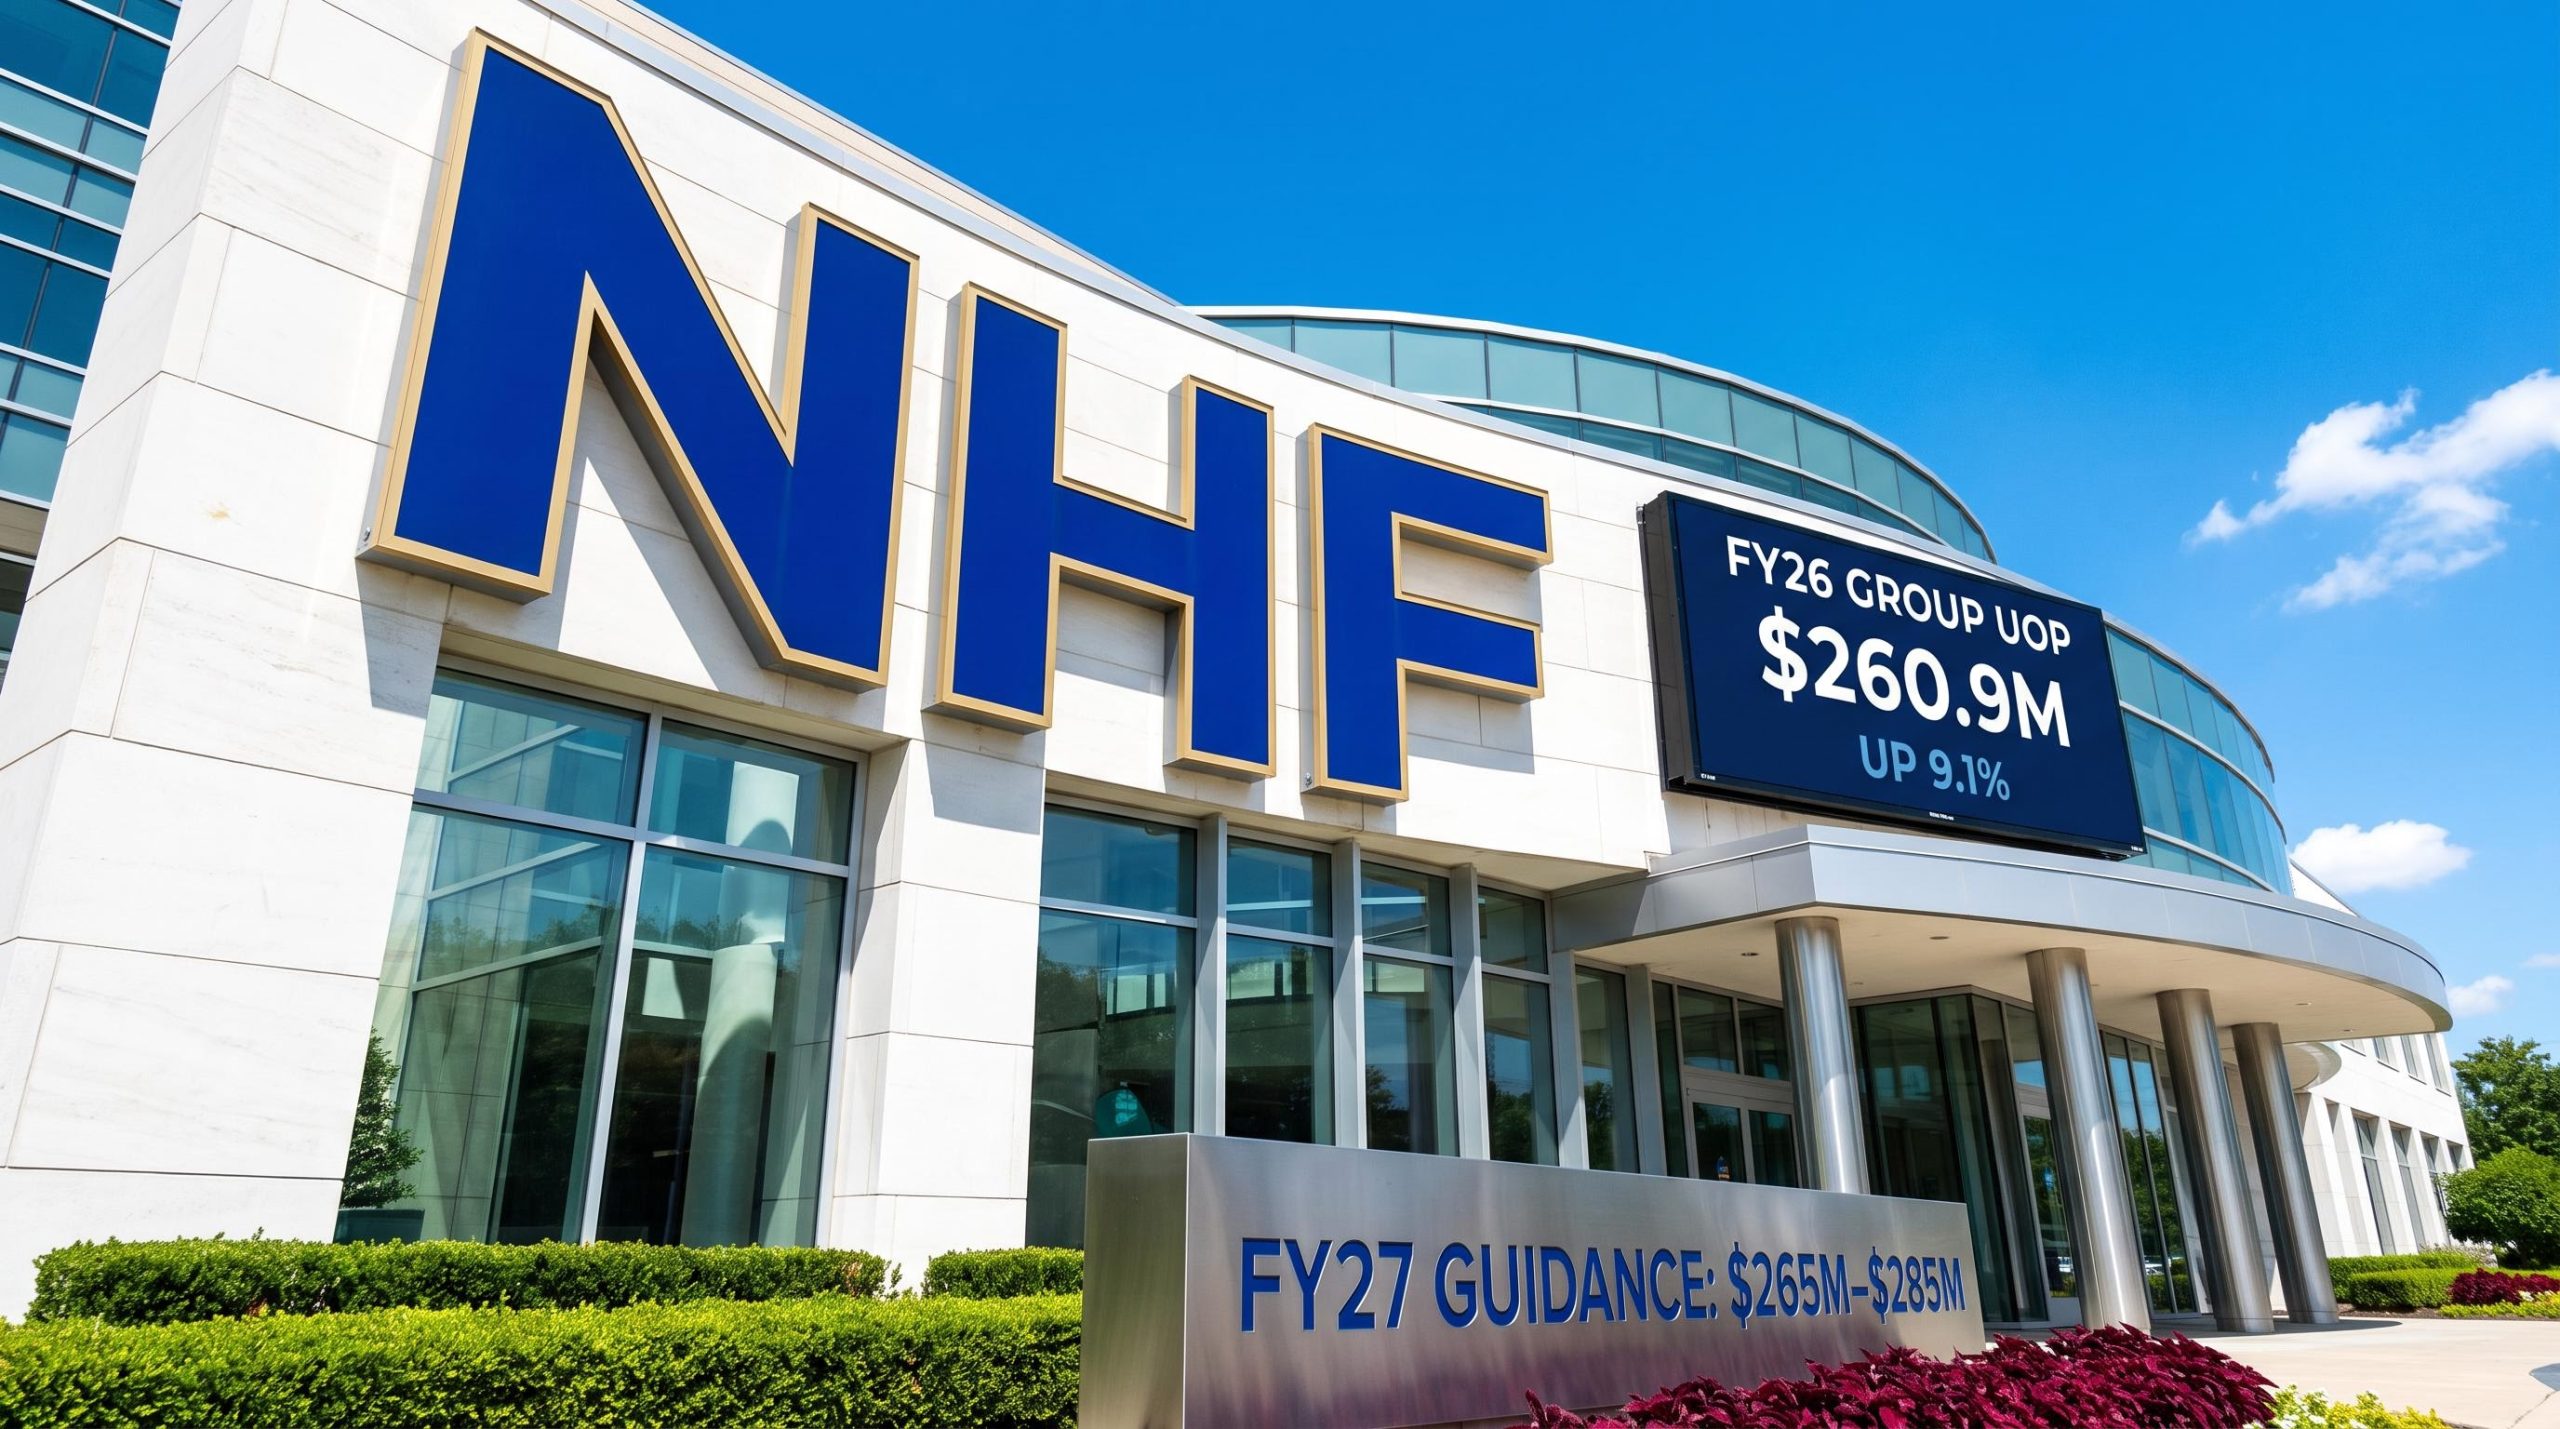
nib delivers 9.1% lift in underlying operating profit as diversification strategy pays off
In its FY2026 full year results presentation, released on 24 August 2026, nib holdings reported Group underlying operating profit (UOP) of $260.9 million for the financial year ended 30 June 2026, up 9.1% and landing within its guidance range of $257m to $267m.
The result was supported by continued top-line revenue growth, with Group revenue rising 6.2% to $3.8 billion, and by a strengthening contribution from the company’s diversified adjacent businesses.
Net profit after tax (NPAT) came in at $186.9 million, down 5.9%. The decline reflects a normalisation against the prior year, which benefited from unusually high investment returns and a low effective tax rate, rather than any deterioration in underlying operating performance. Total persons covered edged up 0.7% to 1,952,948, and the Board declared a full-year dividend of 34.0 cps fully franked, inclusive of a 5c special dividend.
When big ASX news breaks, our subscribers know first
FY26 Group results at a glance
Management noted that all business segments contributed positively to the FY26 result. The headline metrics are summarised below.
| Metric | FY26 | FY25 | Change |
|---|---|---|---|
| Group revenue | $3.8b | $3.6b | ▲ 6.2% |
| Group UOP | $260.9m | $239.2m | ▲ 9.1% |
| NPAT | $186.9m | $198.6m | ▼ 5.9% |
| Operating expense ratio | 16.6% | 17.7% | ▼ 110bps |
| Gearing ratio | 15.2% | 20.1% | ▼ 490bps |
| Net operating cash flow | $199.1m | $165.7m | ▲ 20.2% |
The presentation framed the year as one of structural simplification, with management pointing to a business now more focused on its core. As a key FY26 highlight, the company noted that nib Group is now more simplified, more efficient and more focused on core health insurance and related services.
Diversified earnings engine: adjacent businesses now a third of Group earnings
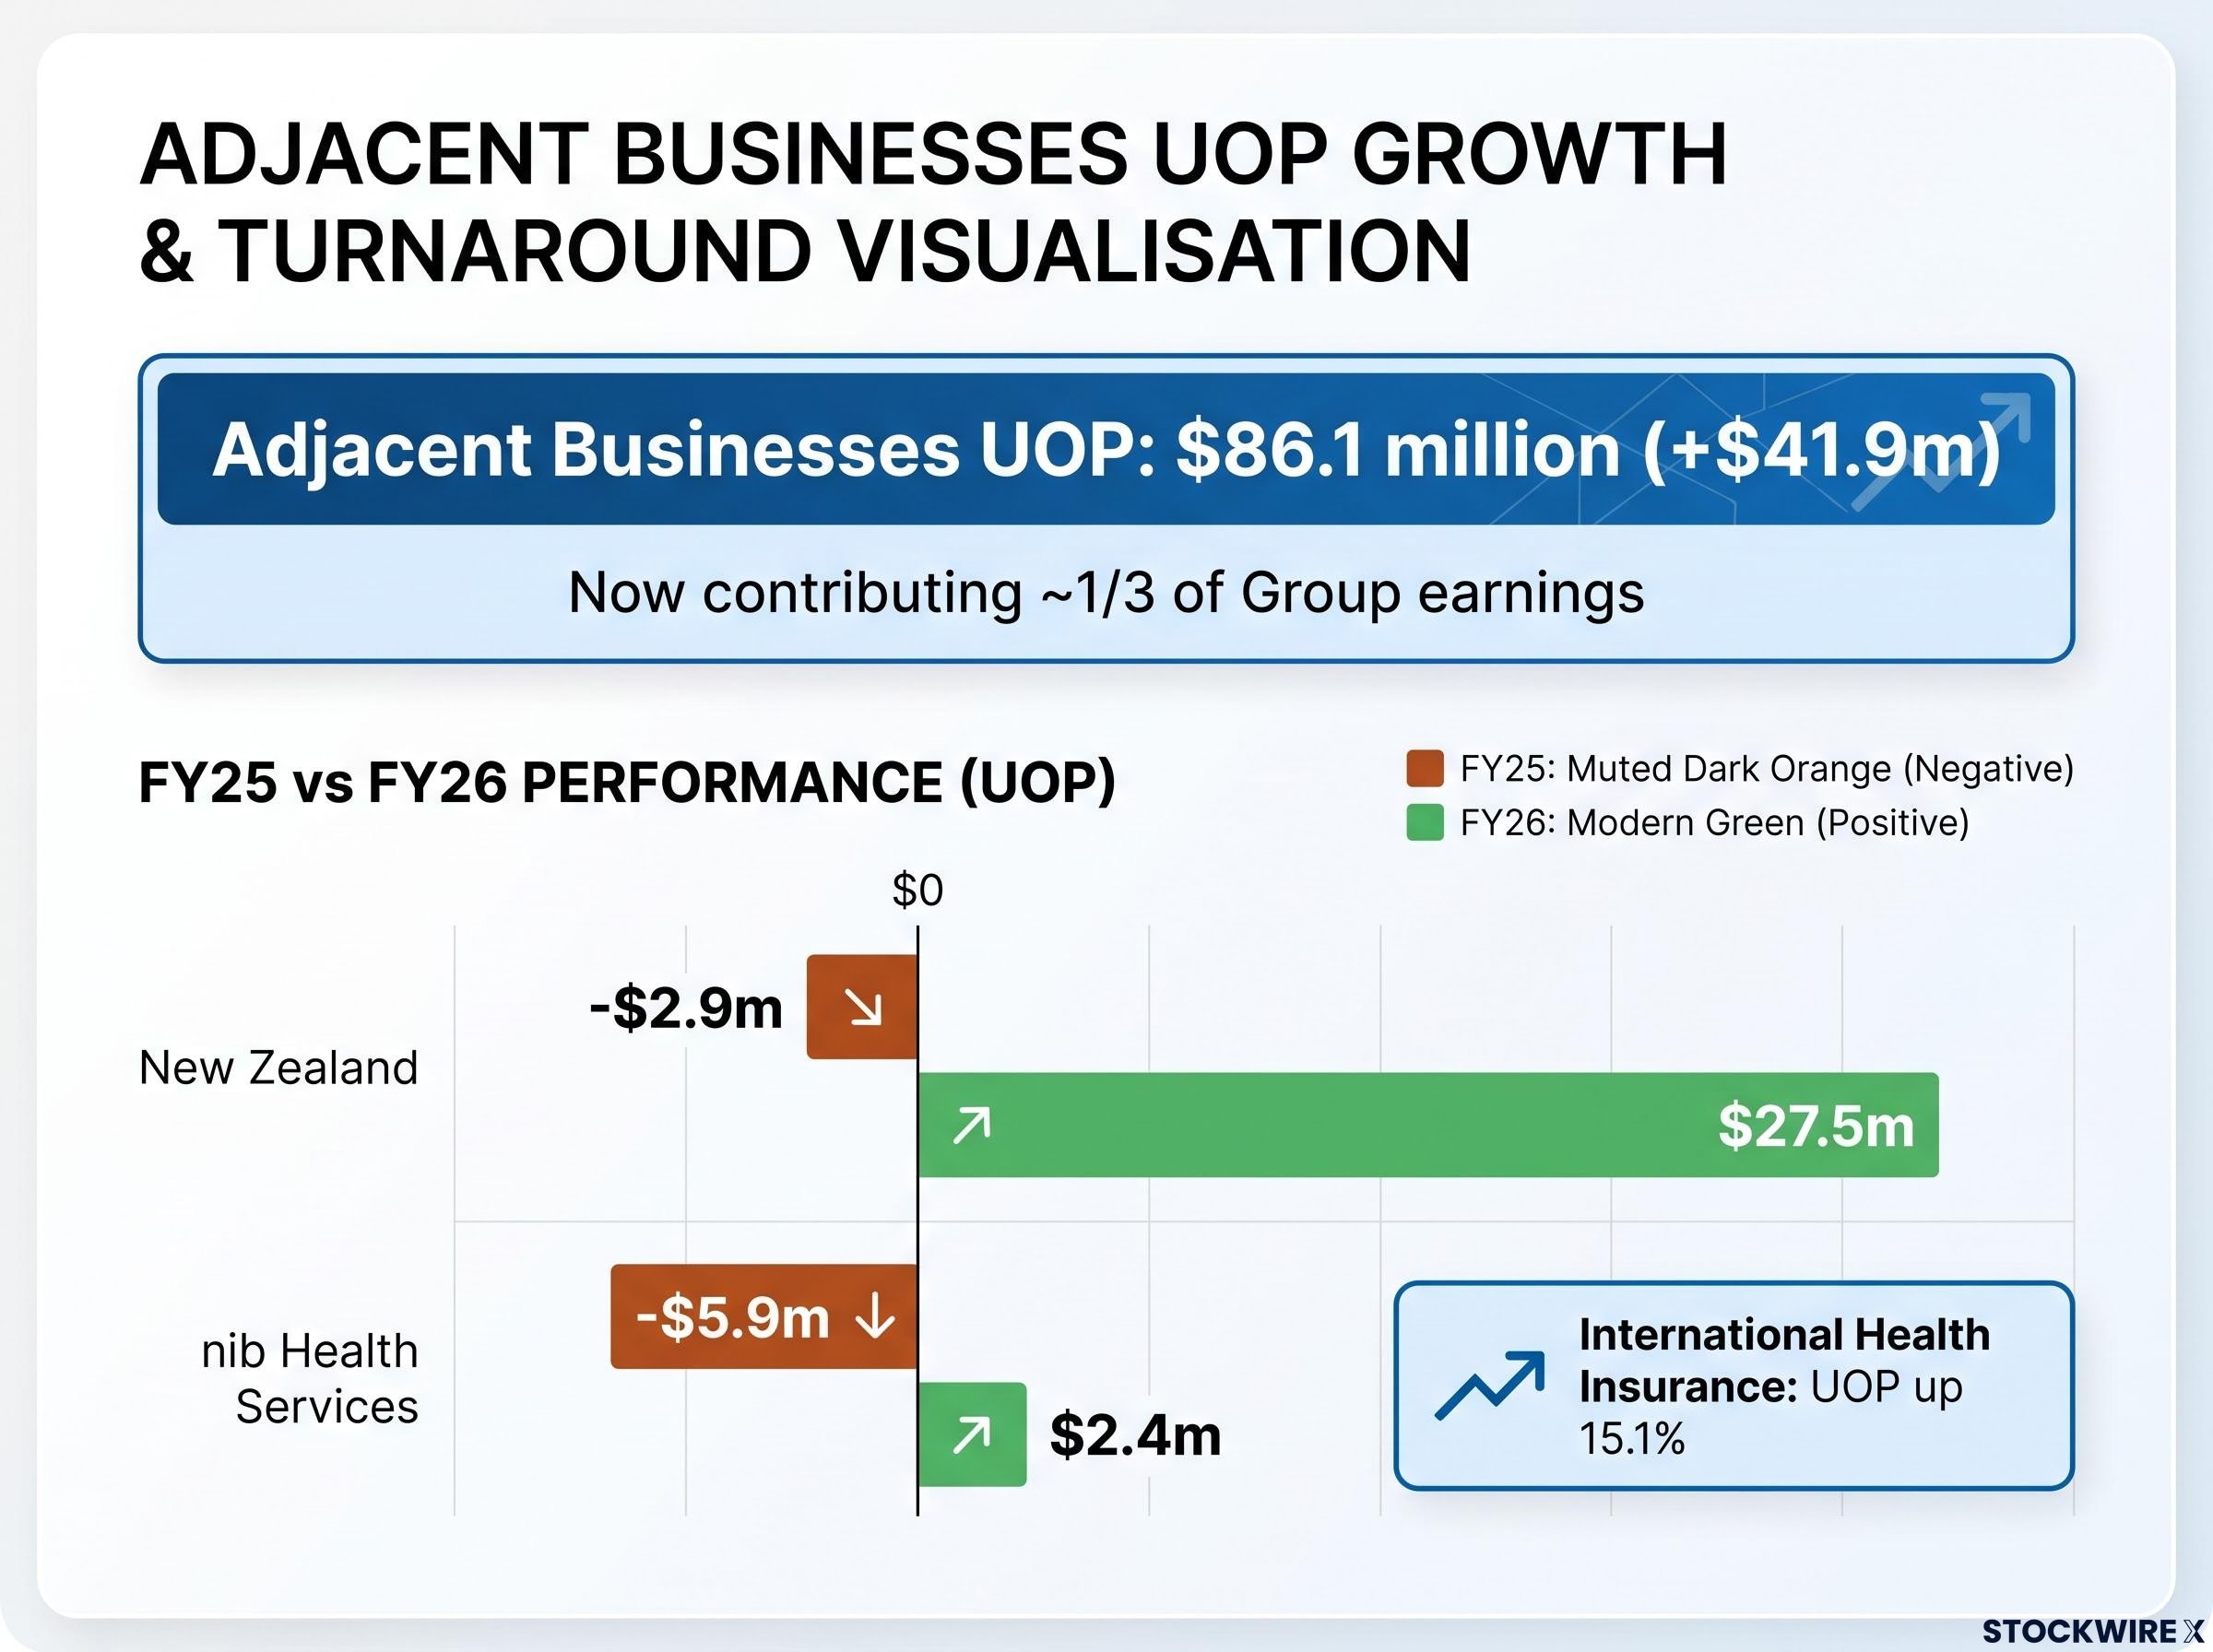
A central theme of the presentation was the growing weight of nib’s adjacent businesses. These lifted UOP to $86.1 million, an increase of $41.9 million, and now contribute around one third of Group earnings, on a 100% basis for Honeysuckle Health and Midnight Health.
The result was driven by strong performances across several segments:
-
International health insurance: UOP up 15.1%, net margin up 120bps, and a net promoter score (NPS) of +62.
-
New Zealand: returned to profitability with UOP of $27.5m, a turnaround from a -$2.9m loss in FY25, reflecting disciplined pricing and claims recovery actions.
-
nib Health Services: delivered full-year profitability of $2.4m UOP, up from a -$5.9m loss, with ItsMyGroup now facilitating over 10% of industry private health insurance (PHI) sales.
For investors, the shift reduces reliance on the core Australian PHI cycle and increases exposure to higher-growth adjacent markets.
Australian residents: disciplined growth with margins held in target range
The core Australian residents segment reported UOP of $187.9 million, down 9.6%, with net margin of 6.2% held within the 6–7% target range. Policyholders rose 1.9% to 751,091, with the company repositioning its portfolio toward higher-value segments.
Notably, 85% of net growth landed in the target Silver category, up sharply from 46% in FY25. Claims inflation moderated to 4.1% (or 4.5% including NSW bed rate changes), while the non-marketing management expense ratio fell to 5.3%, described in the presentation as the lowest since 2007.
The margin discipline on display in FY26 reflects lessons from a challenging FY25 environment, where claims growth exceeding premium increases compressed net margins across the Australian private health insurance sector and forced disciplined repricing ahead of the April 2026 cycle.
The segment also delivered $57m in out-of-pocket savings for members through the nib First Choice network. Management noted that elevated risk equalisation volatility (around $10m above trend) and higher offer costs pressured margins during the year, offset by productivity gains.
What is underlying operating profit, and why it matters here
UOP is nib’s preferred measure of operating performance. It strips out amortisation of acquired intangibles, one-off transactions, M&A and integration costs, finance costs, net investment income and tax, leaving a cleaner view of how the core business is trading.
Why does this matter this year? Statutory NPAT fell 5.9%, largely because FY25 carried unusually high investment income and a low effective tax rate. UOP, by contrast, shows the operating business grew 9.1%. The measure helps investors separate genuine operating trends from one-off accounting and market noise.
Productivity and AI: $61m of value created
The presentation positioned productivity and AI as a structural margin lever rather than a one-off cost exercise. The company created $61 million of value in FY26 through its productivity agenda, up from $18m in FY25, taking cumulative savings since FY24 to $79m. The Group operating expense ratio has now fallen 160bps since FY24 to 16.6%.
Key digital and AI proof points included:
-
86.3% of Australian residents claims processed via automation, with almost 95% processed within 24 hours.
-
345k queries handled across 700+ employees using nibGPT, the company’s internal AI frontline tool.
-
26k+ hours of manual effort saved in the Australian contact centre through AI call summaries and chat.
-
Customers per FTE up 11.5% on FY25.
A lower cost to serve creates flexibility to invest in customer value and defend margins within the target range.
Balance sheet strength and capital returns
The presentation highlighted a materially strengthened balance sheet. The gearing ratio improved 490bps to 15.2%, supported by a $71.8m reduction in debt. Net operating cash flow rose 20.2%, and free cash flow turned positive at $27.0m, from -$21.7m in FY25. The nib Health Funds PCA ratio stood at 1.65x.
Reflecting this strength, the Board raised its target dividend payout ratio by 5% to a range of 65–75% and declared a final dividend of 21.0 cps, inclusive of a 5c special dividend.
On the nib Travel front, the strategic review has been finalised. The sale of the World Nomads international travel insurance business to SiriusPoint, and the AU/NZ travel insurance businesses (excluding World Nomads) to Allianz Partners, are both expected to complete in 1H27.
The World Nomads divestment to SiriusPoint for $67.5 million in early 2026 marked the first leg of nib’s full travel insurance exit, with the subsequent AU/NZ business sale to Allianz Partners completing a portfolio simplification that management had signalled as a strategic priority.
| Indicative use of nib Travel sale proceeds | Amount |
|---|---|
| 2H26 special dividend (pre-receipt of funds) | ~$24m |
| Potential strategic investment capital | $15m – $30m |
| Additional capital management optionality (post-receipt) | $43m – $58m |
| Expected net proceeds after transaction costs (1H27) | ~$97m |
The company expects to receive net proceeds of approximately $97m in 1H27, with FY28 deferred consideration estimated at $0m to $10m. Management flagged that the special dividend (around $24m) was declared prior to receipt of these funds. A new long-term Allianz Partners distribution agreement will generate commission income into the nib Health Services segment, aligning with the company’s move toward a capital-light distribution model.
FY27 outlook and strategic priorities
Management outlined a forward roadmap centred on productivity, disciplined capital allocation and completion of the nib Travel sale. The company is targeting FY27 Group UOP of $265m to $285m (excluding nib Travel), subject to risk equalisation outcomes, and anticipates significantly lower one-off costs.
Key FY27 focus areas outlined in the presentation include:
-
Targeting further improvement in the Group operating expense ratio through simplification, digital-first execution and AI.
-
Australian residents: targeting sustainable, high-quality policyholder growth and underlying net margin within the 6–7% target range.
-
International and New Zealand: targeting ongoing strong contributions to Group UOP.
-
Health & Insurance Services: targeting positive UOP growth.
-
nib Thrive positioned to respond to NDIS reforms, with mandatory compliance from October 2027 expected to favour scaled, compliant plan managers.
The FY26 result presents a picture of a simplified and more diversified nib, with productivity momentum, a stronger balance sheet and capital return optionality from the pending nib Travel proceeds.
Stay Ahead on ASX Healthcare and Finance News
Get FREE breaking ASX alerts delivered to your inbox within minutes of release, complete with in-depth analysis. Join 20,000+ subscribers already tracking the market-moving news that matters. Click the “Free Alerts” button at Big News Blast to make sure the next major announcement lands with you before the market moves.