
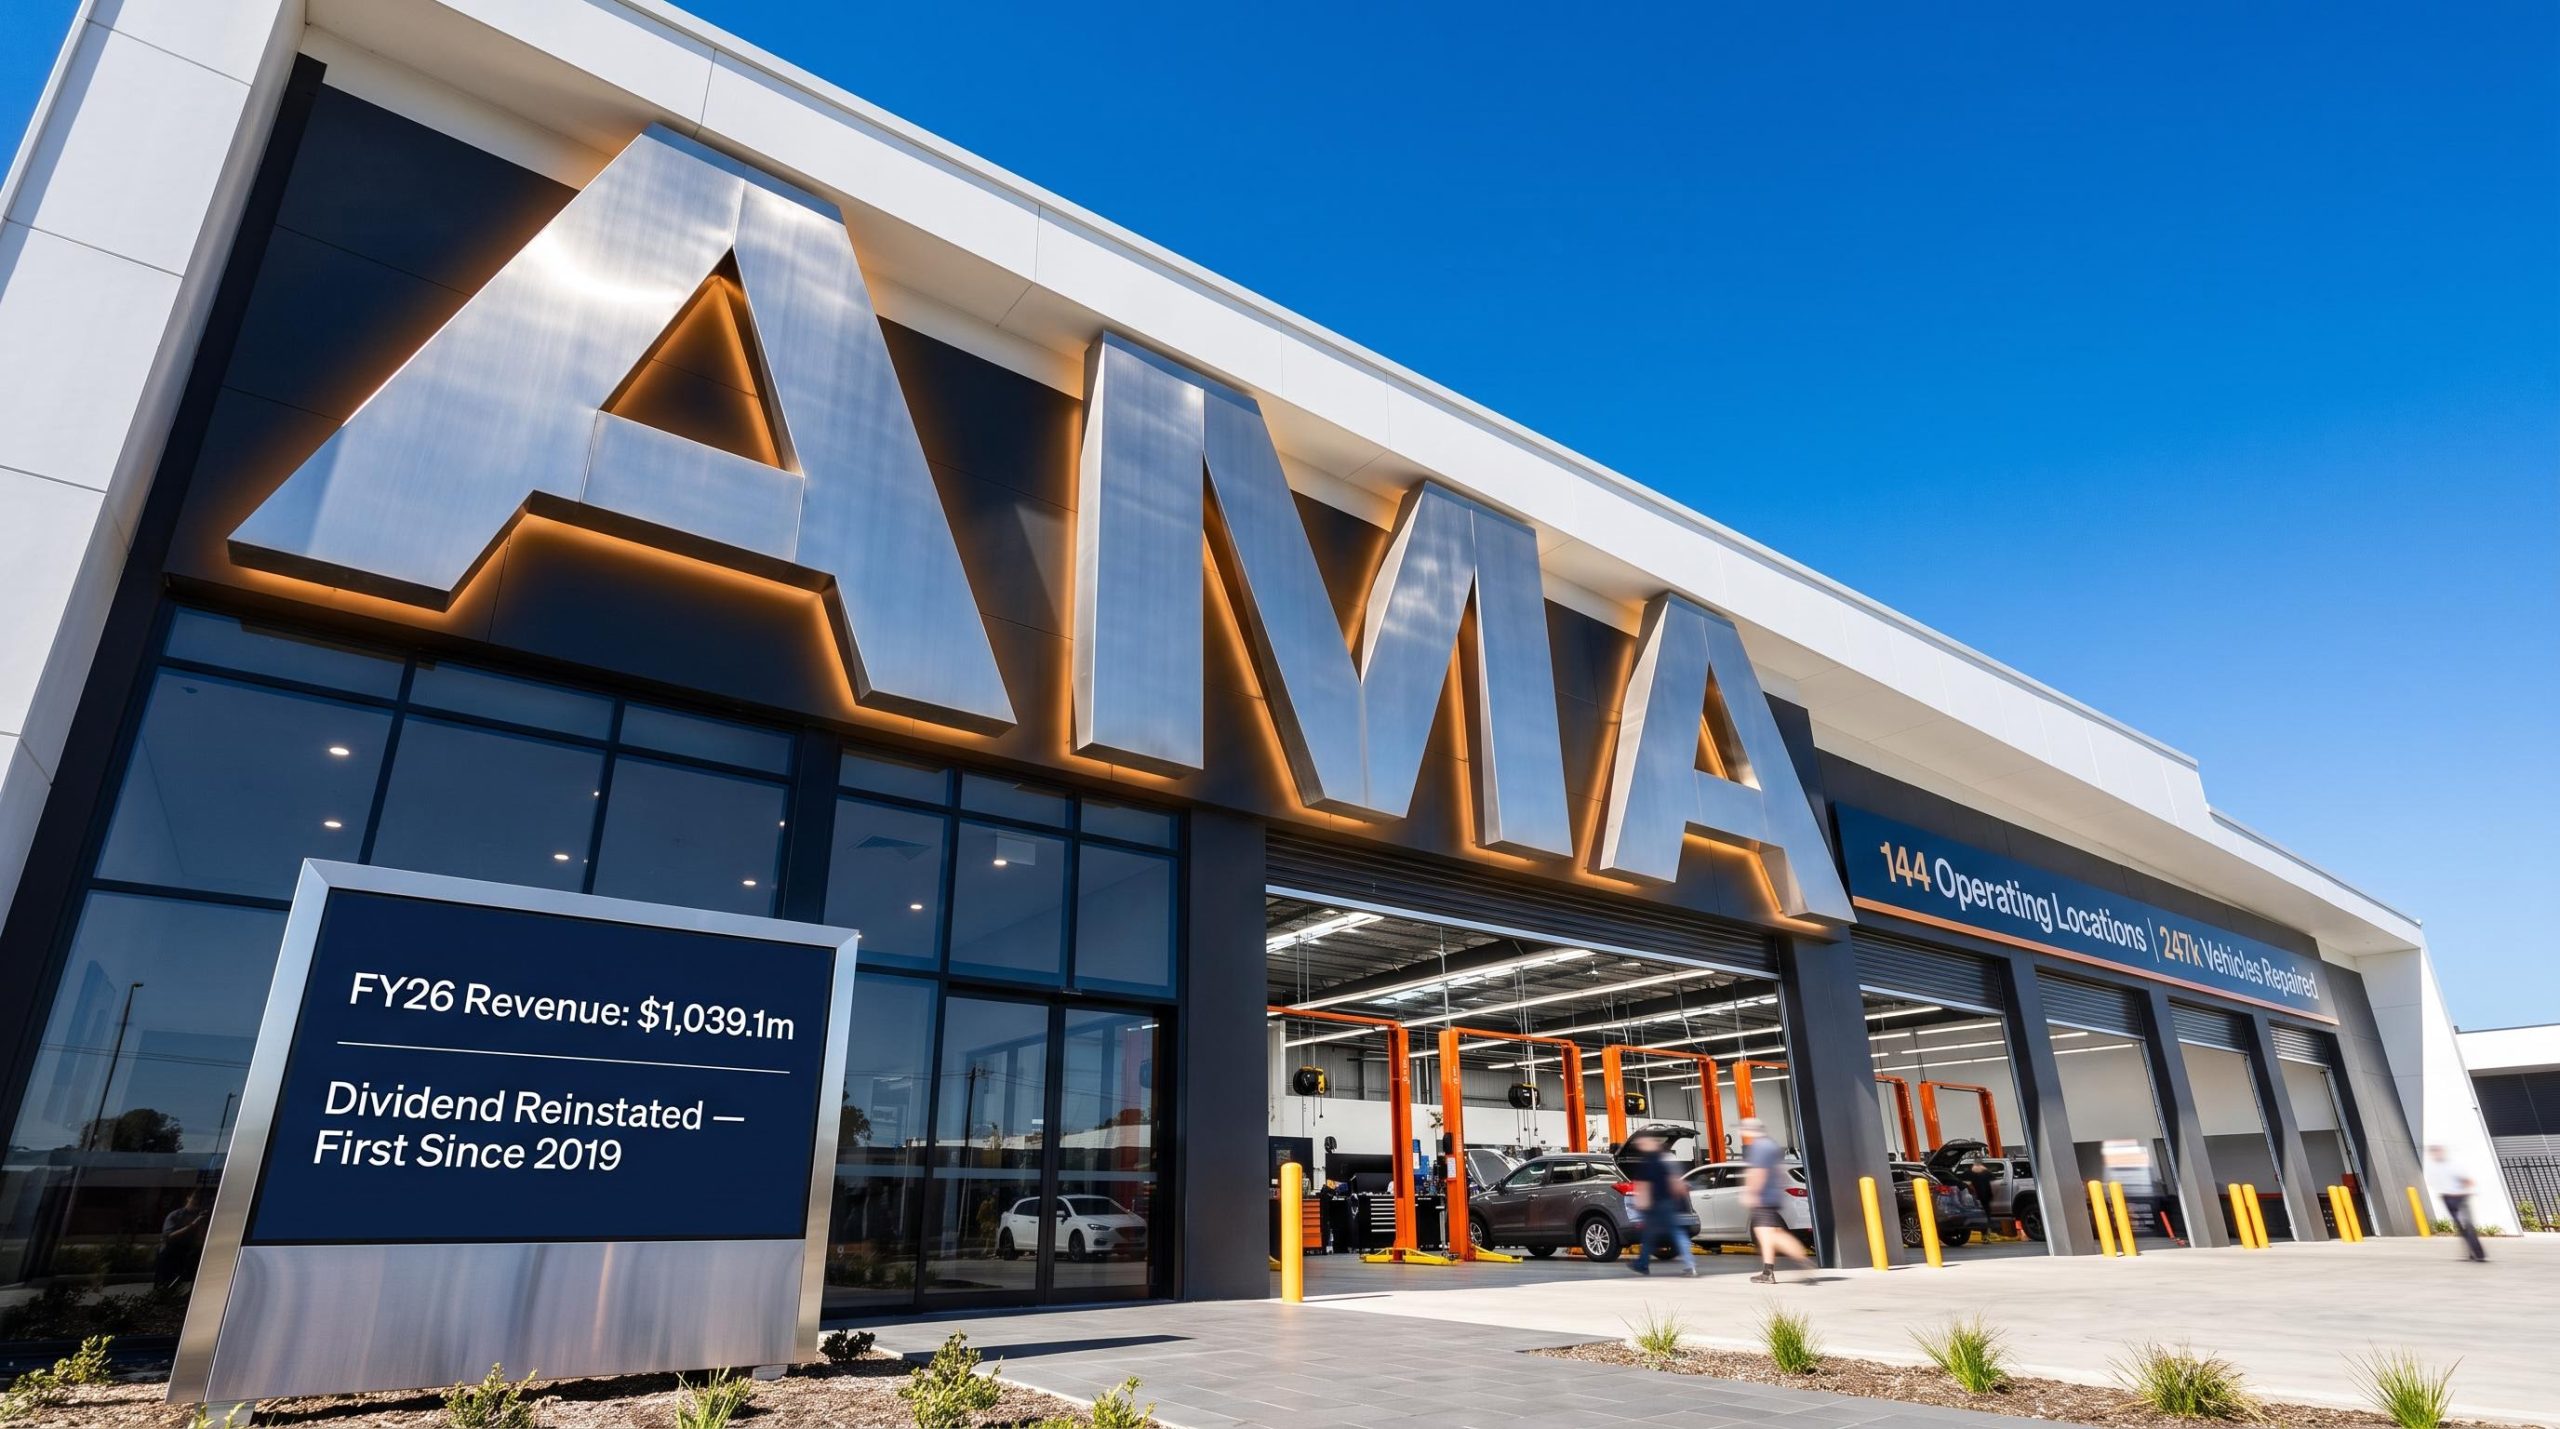
AMA Group returns to profit and reinstates dividend in record FY26 result
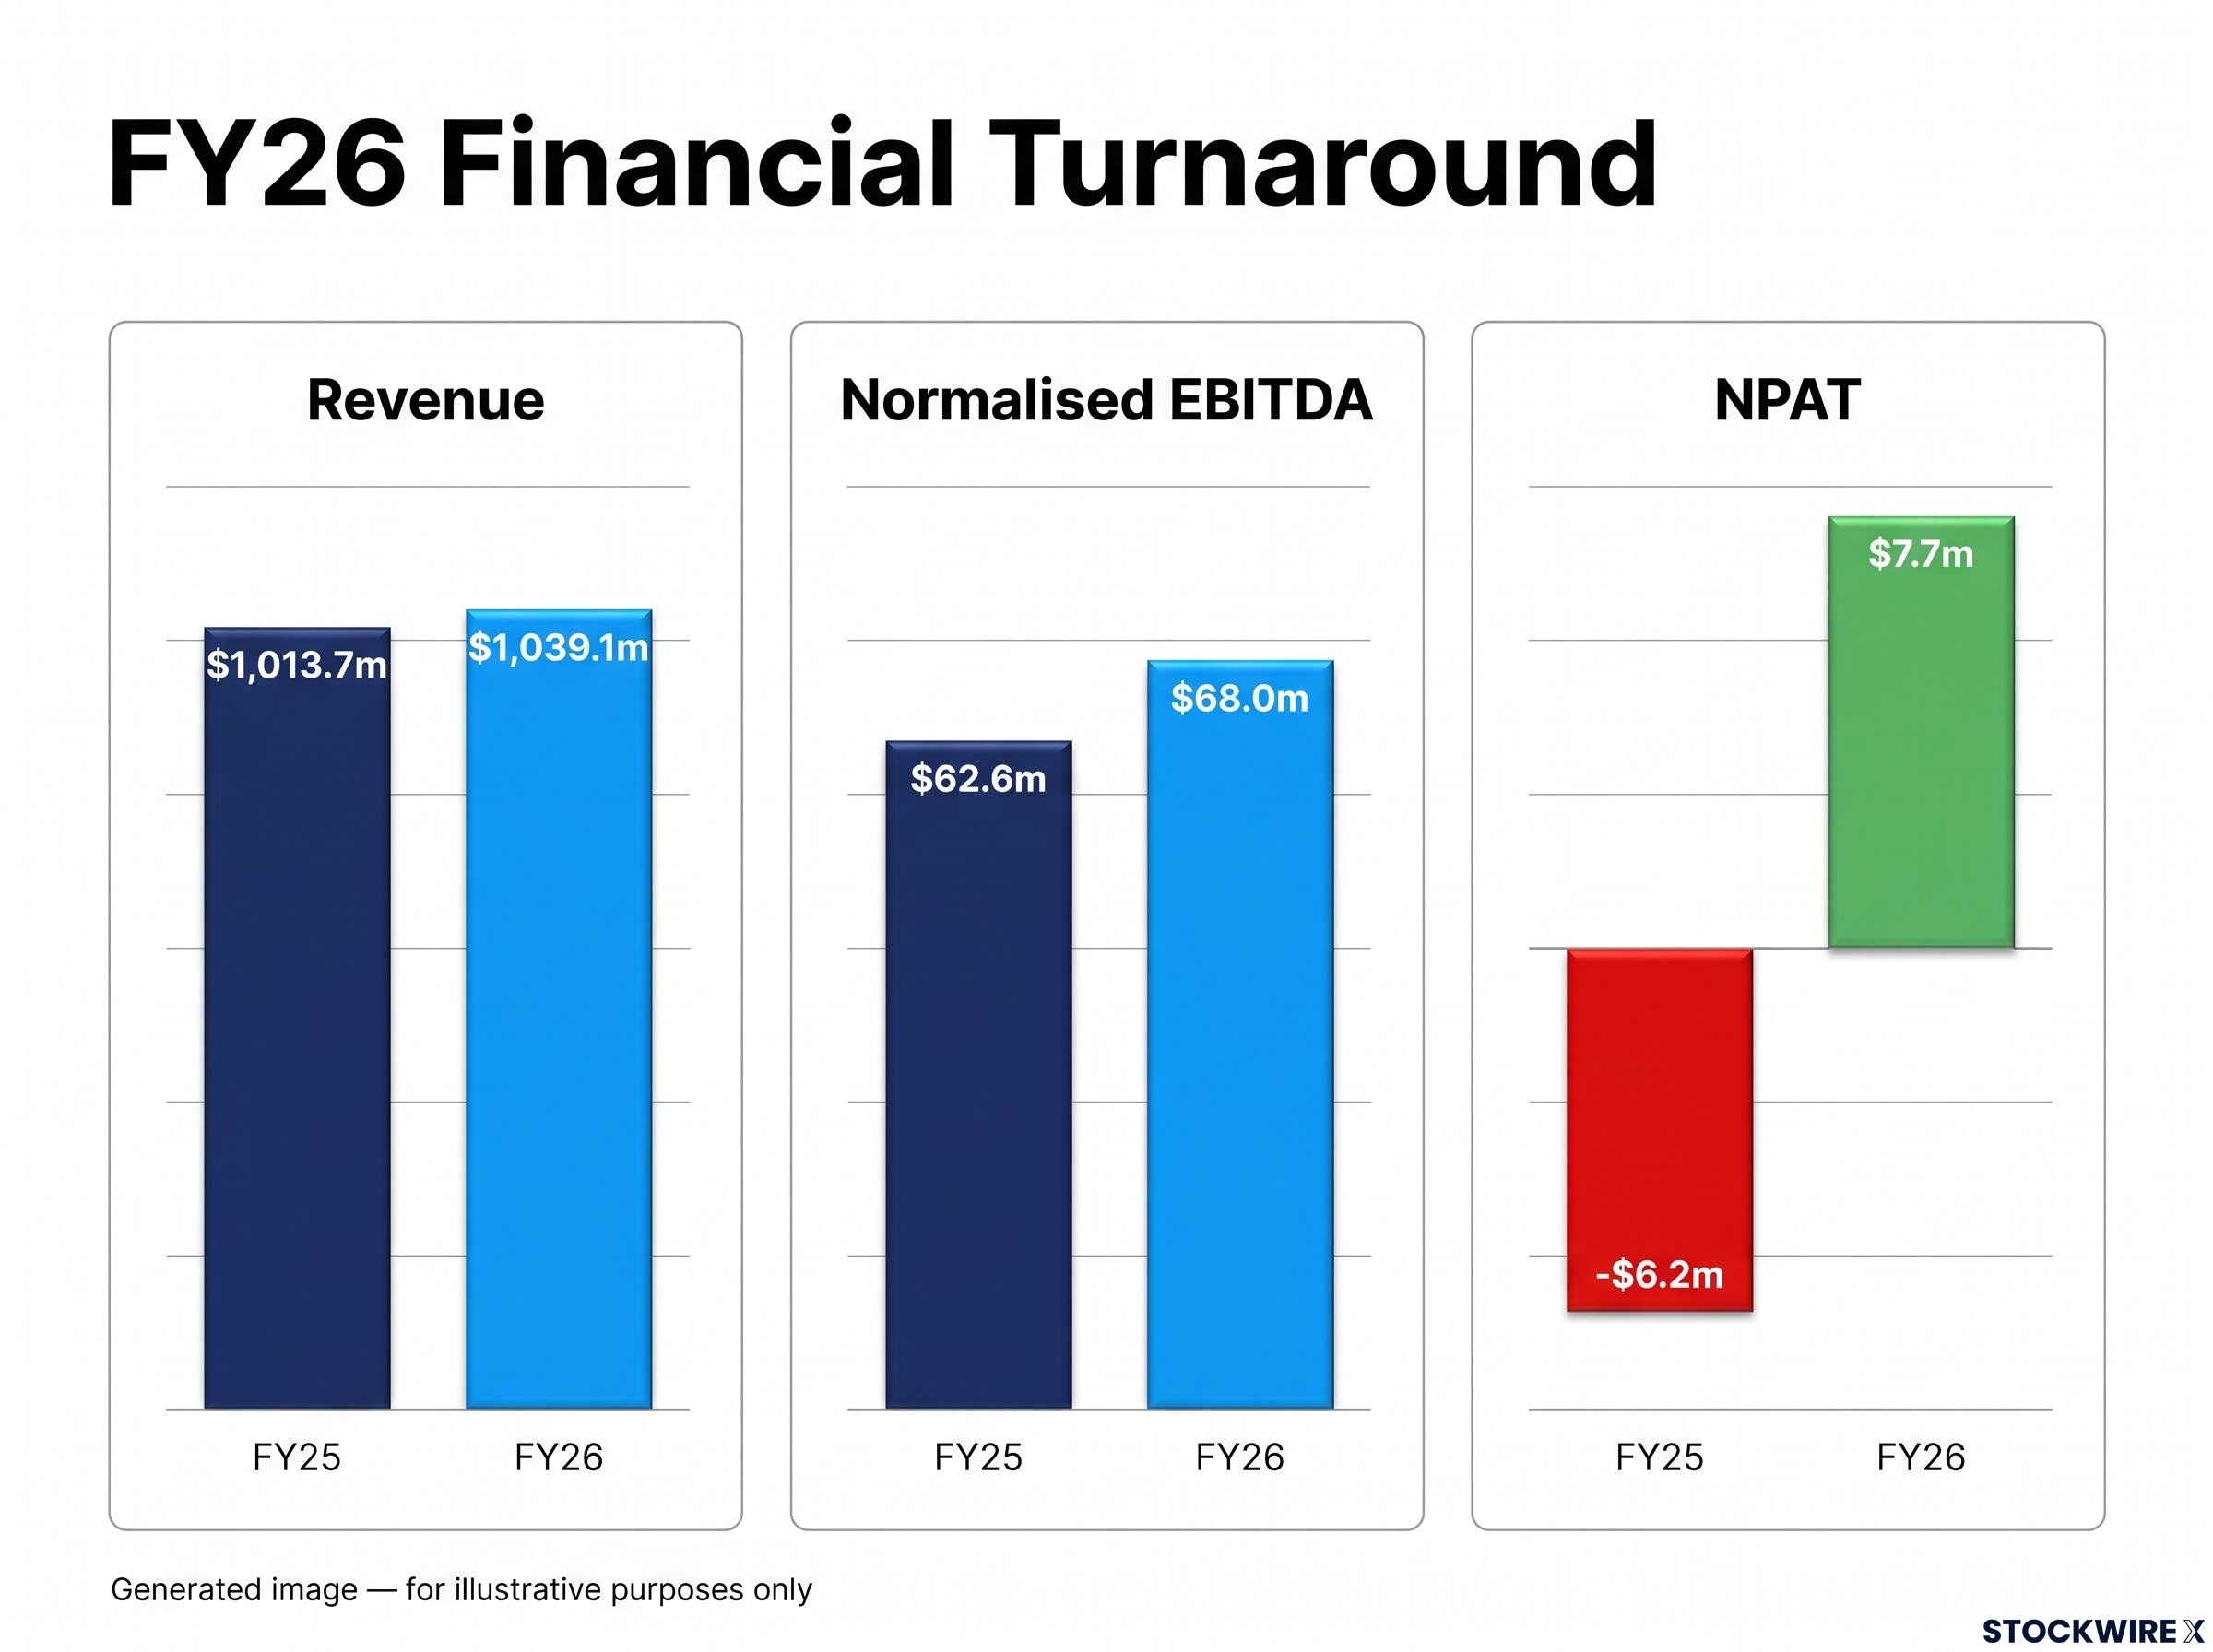
In its FY26 full year results presentation, delivered 21 August 2026, AMA Group outlined a record revenue result of $1,039.1m alongside a return to statutory profit for the completed financial year (1 July 2025 to 30 June 2026).
The collision repair group reported NPAT of $7.7m, a $13.9m turnaround from the prior year’s $6.2m loss. Management also confirmed a 0.5c dividend for FY26, the first dividend declared since 2019.
Normalised pre-AASB 16 EBITDA came in at $68.0m, up 8.6% on FY25. The presentation framed the period as a broad-based improvement across most operating segments, supported by a strengthened balance sheet and clearer forward guidance.
When big ASX news breaks, our subscribers know first
FY26 by the numbers: record revenue and a profit turnaround
The presentation detailed group revenue and other income of $1,039.1m, up $25.4m (+2.5%) on FY25. Core Vehicle Collision Repair revenue reached $994m, up 2.6% year-on-year.
Normalised pre-AASB 16 EBITDA rose to $68.0m from $62.6m, lifting the margin from 6.2% to 6.5%. Management noted that Q4, traditionally the strongest quarter for repair volumes, was affected by elevated fuel prices and public transport concessions.
Operating cash flow (net of all lease costs) was $32.8m, down $11.3m. The company attributed this primarily to an $11.6m increase in income tax paid, reflecting higher taxable earnings following the return to profit.
| Metric | FY26 | FY25 | Change |
|---|---|---|---|
| Revenue | $1,039.1m | $1,013.7m | +$25.4m |
| Normalised EBITDA (pre-AASB 16) | $68.0m | $62.6m | +$5.4m |
| Normalised EBITDA % | 6.5% | 6.2% | +0.3pt |
| NPAT | $7.7m | ($6.2m) | +$13.9m |
| Operating cash flow | $32.8m | $44.1m | −$11.3m |
| EPS | 1.39cps | (1.65cps) |
Segment performance: where the growth came from
The presentation walked through AMA’s operating segments, reinforcing a diversification story spanning drivable repairs, complex collision work, heavy vehicles, specialist services and parts supply.
Segment highlights included:
-
Capital SMART achieved a Normalised EBITDA margin of 10.6%, in line with expectations. Drivable repairs softened from March amid geopolitical events, while 3 new sites opened (SA, NSW, TAS) and 2 closed.
-
AMA Collision delivered improved volume, revenue and EBITDA, lifting its margin to 2.8%, up 0.8% from FY25.
-
Wales Heavy Vehicle was impacted by fewer large-scale repairs, though Q4 was its strongest quarter of the year, with recovery expected in FY27.
-
Specialist Businesses recorded strong growth, with EBITDA up $4.1m and margin rising to 8.6%, up 6.0% from FY25.
-
ACM Parts returned to profit, posting Normalised EBITDA of $2.3m, up $7.0m, and is now operating in a consistent and profitable manner.
Management reiterated that vertical integration, combining vehicle repair services with automotive parts sourcing and supply, provides a key competitive advantage.
| Segment | FY26 Revenue | Normalised EBITDA | EBITDA % |
|---|---|---|---|
| Capital SMART | $490.7m | $51.9m | 10.6% |
| AMA Collision | $379.7m | $10.6m | 2.8% |
| Wales | $76.7m | $7.7m | 10.0% |
| Specialist | $65.6m | $5.6m | 8.6% |
| ACM Parts | $97.1m | $2.3m | 2.3% |
Understanding vertical integration in vehicle repair
Vertical integration describes a business that owns multiple stages of its supply chain rather than relying on external providers. In AMA’s case, the group operates both the repair network (SMART, Collision, Wales and Specialist) and the parts supply arm (ACM Parts).
Why does this matter to investors? Owning the parts supply chain gives the group greater control over repair quality, turnaround times and costs. It also captures margin that would otherwise flow to third-party suppliers, and can act as a defensive competitive moat.
Think of it as a repairer that also runs its own parts warehouse, keeping more of each repair dollar in-house. ACM Parts’ return to profitability suggests the integrated model is now contributing to group earnings rather than dragging on them.
A strengthened balance sheet supports capital returns
The presentation highlighted financial position improvements supporting the dividend decision. Net Debt was broadly stable at $18.4m (versus $17.7m at FY25), and the Group met all financial covenants during the period.
Finance costs – other fell $12.7m, following the refinancing of the Group’s senior bank debt and lower levels of average debt. Free cash flow was $2.5m, calculated as the $32.8m operating cash inflow less $30.3m in capital expenditure.
Management noted that current capex includes catch-up spend from prior years and is expected to decrease over time, with regular maintenance capex in the range of $12.5m–$15.0m annually.
The Group outlined a four-part capital management program:
-
Capital expenditure for organic growth
-
Funding M&A for inorganic growth
-
Dividend program, the first since 2019
-
On-market share buy-back, initiated this year
FY27 outlook: guidance and the path to 10% margins
For FY27, AMA Group expects Normalised pre-AASB 16 EBITDA in the range of $75m–$80m, subject to ordinary business trading conditions. The presentation also reaffirmed a medium-term ambition to reach a pre-AASB 16 EBITDA margin of 10% within 3 years, leveraging the vertically integrated structure.
By segment, management expects Capital SMART to deliver another strong result with a margin in the 10%–11% range, Wales to have a better year as heavier repair mix improves, and both Specialist Businesses and ACM Parts to continue growing profitability.
Continued organic growth within the existing footprint was flagged, alongside efficiency initiatives incorporating AI. The company also stated that future dividends are expected.
Management Outlook
Management outlined a target of reaching a pre-AASB 16 EBITDA margin of 10% within three years, supported by organic growth within the existing footprint and the group’s vertically integrated structure.
The investment takeaway
The FY26 presentation positioned AMA Group as a diversified, vertically integrated collision repair operator that has returned to profit, reinstated its dividend, strengthened its balance sheet and set clear margin-expansion targets.
Scale credentials underpin the story, with 3,500+ team members across 144 operating locations, and 247k vehicles repaired in FY26. With stated capacity for organic growth within the existing footprint and a 10% margin ambition, the forward narrative centres on execution against guidance rather than expansion for its own sake.
Don’t Miss the Next ASX Industrials Turnaround Story
Big News Blast delivers FREE breaking ASX announcements straight to your inbox within minutes of release, complete with in-depth analysis so the work is already done. Join 20,000+ investors staying ahead of the market on results, dividends and guidance updates. Click the “Free Alerts” button to start receiving alerts the moment news breaks.