
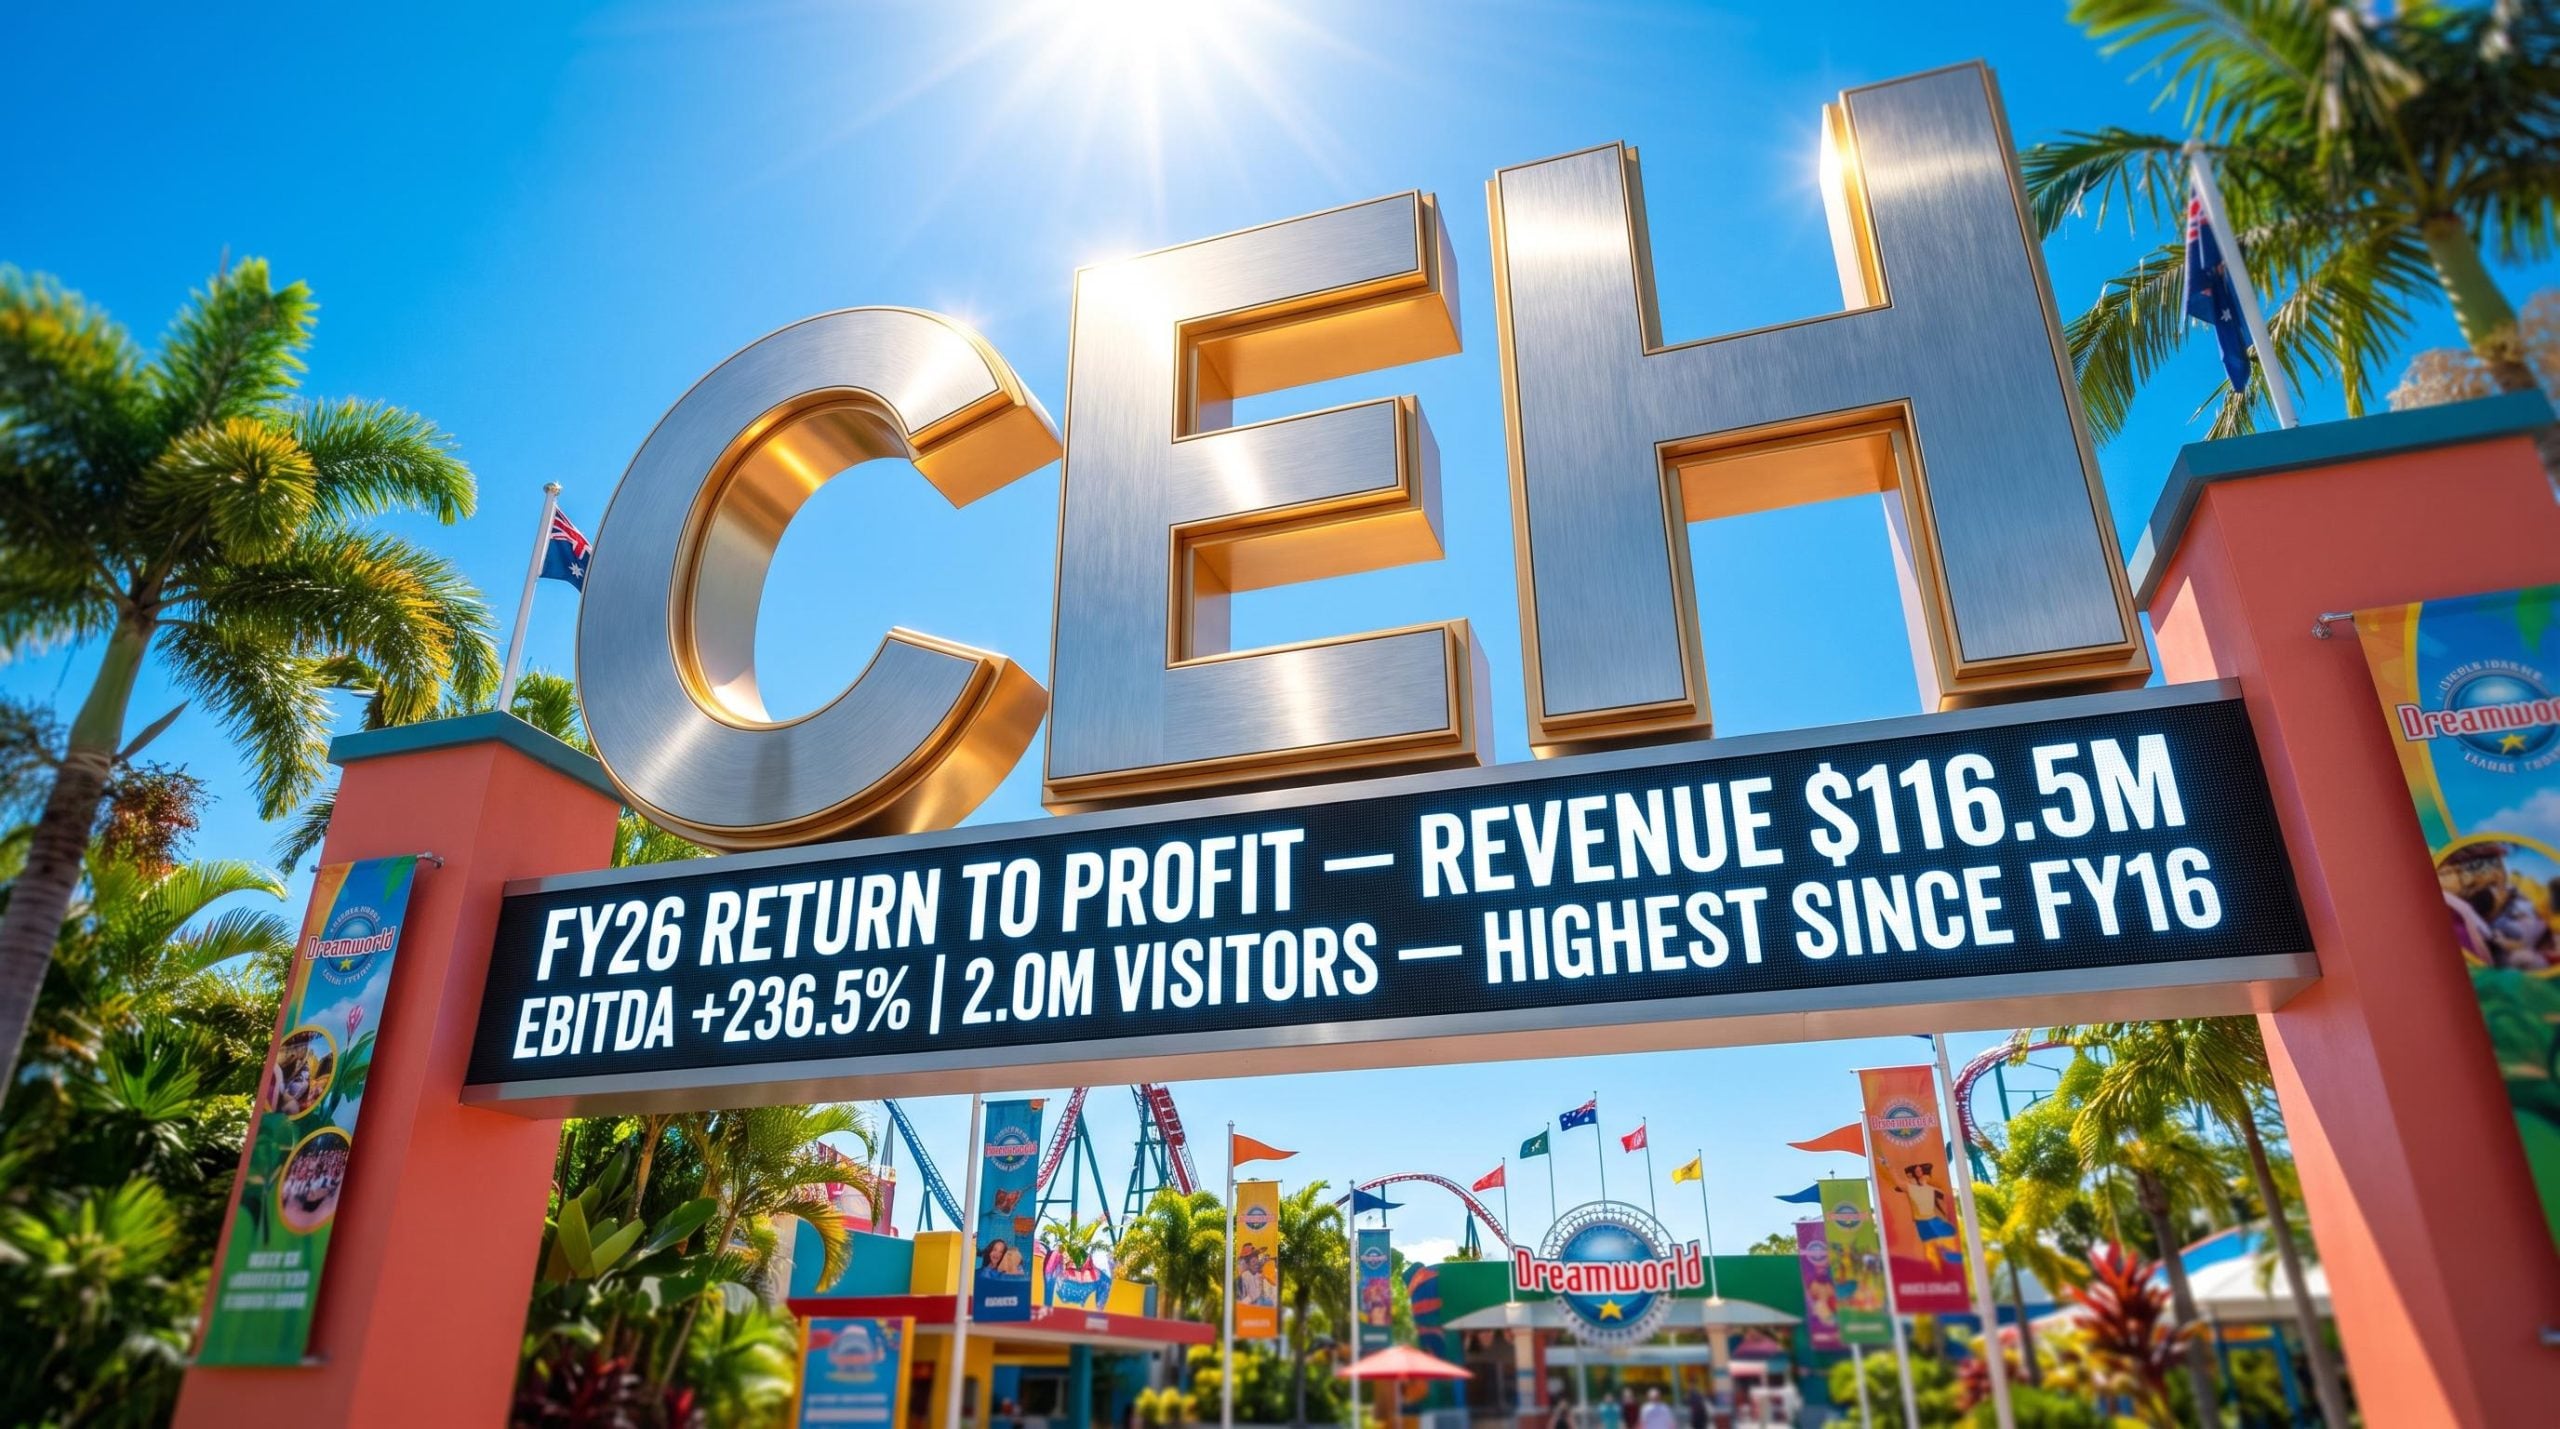
A return to profit as FY26 caps a multi-year turnaround
In its FY26 full-year results presentation dated 21 August 2026, Coast Entertainment Holdings reported a return to net profitability for the 53-week period, delivering consolidated net profit after tax (NPAT) of $6.1 million, compared with a $0.1 million loss in FY25.
Management framed the result as the culmination of a multi-year turnaround rather than a one-off. Notably, the improvement was achieved despite the prior year benefiting from $5.8 million of one-off insurance recoveries, which underscores the strength of the underlying trading recovery.
The presentation was built around three pillars: operating performance, self-funding cash generation, and unlocked land value. Operating revenue reached $116.5 million, up 20.8%, while Group EBITDA excluding Specific Items climbed 236.5% to $13.8 million.
When big ASX news breaks, our subscribers know first
FY26 financial results — significant operating leverage on display
The headline story management presented was operating leverage. Revenue rose 20.8%, yet EBITDA excluding Specific Items surged 236.5%, illustrating how incremental visitation flows through a largely fixed cost base.
The company noted this marked the third consecutive year of positive Group EBITDA. The balance sheet remained debt-free, with a fully undrawn $20 million bank facility renewed in December 2025 providing funding flexibility.
| A$m | Reported FY26 | Reported FY25 | Variance |
|---|---|---|---|
| Operating revenue | 116.5 | 96.4 | +20.8% |
| EBITDA excl Specific Items | 13.8 | 4.1 | +236.5% |
| EBITDA | 13.5 | 9.3 | +45.0% |
| Net profit/(loss) | 6.1 | (0.1) | Return to profit |
Cash generation and capital position
Operating cash flow more than doubled to $19.7 million (FY25: $9.7 million), reflecting stronger trading and higher annual pass sales. Management emphasised the self-funding narrative: operating cash flow fully funded both the $16.0 million of capital expenditure and the $3.7 million on-market share buyback during the year.
The capital position at year-end included:
-
Cash on hand of $35.0 million at 30 June 2026
-
A debt-free balance sheet, with a fully undrawn $20 million bank facility
-
FY27 development capex guidance of approximately $17.0 million, the largest component of which relates to replacement of the Motocoaster attraction
Understanding revenue per cap — why “yield dilution” is actually a growth signal
Reported revenue per cap softened 5.9% on a like-for-like basis, a figure that could appear negative at first glance. The presentation detailed why the mechanic behind it reflects growth, not weaker spending.
Annual pass revenue is recognised evenly (straight-line) over 12 months, but each passholder visit is counted immediately. As a result, more passholder visits mathematically dilute the average per-visit figure even as total revenue rises. The simplified illustration below shows the effect:
-
A single day ticket priced at $109 equals one visit, recognised in full on entry, producing $109 per cap.
-
An annual pass priced at $169 may deliver two or more visits, with revenue spread over 12 months, diluting the per-visit figure while total revenue grows.
The evidence supports this interpretation. On a like-for-like basis, visitation grew 26.5% against revenue growth of 19.0%, and deferred revenue rose 58.7% to $20.2 million, reflecting cash received but not yet recognised. Management pointed to margin as the truer measure: EBITDA margin excluding Specific Items rose 7.3 points to 16.1%, the highest since FY16. Over the longer term, total revenue per cap sits 40% above FY16 levels, with in-park revenue per cap up 62%.
Operational momentum — highest attendance since FY16
The result was underpinned by three sequenced FY26 launches: WILD with Australian Geographic (September 2025), the return of Big Brother (November 2025), and the King Claw thrill ride (December 2025). Management noted King Claw opened on time and on budget as the fastest Gyro Swing in the Southern Hemisphere.
Guest experience credentials remained strong, with the company achieving the best guest satisfaction rating of the Gold Coast theme parks for a 5th consecutive year, and retaining the Gold Coast’s highest-rated holiday experience on the Global Review Index, alongside 98% attraction uptime.
Headline operating metrics included:
-
Total visitation of 2.0 million, up 29.3% (+26.5% LFL), the highest since FY16
-
Ticket sales up 33.0% (+24.0% LFL), surpassing FY16 levels
-
Passholder base up 67% versus June 2025
-
Record F&B and Retail revenue, up 22.7% LFL
-
The launch of Australia’s first Annual Dining Pass at Dreamworld
Guest sentiment featured in the presentation via independently sourced reviews, including the following five-star Google review from June 2026:
Dreamworld guest review (Google, June 2026)
“We had a lovely day out with our daughter and 3 young grandchildren. The annual pass is great value and the food pass is the cherry on top… We brought our kids to dreamworld in the 90s, now grandkids and the joy is just fantastic. Thanks dreamworld!!”
Unlocking hidden value — the $1.08 proforma NAV story
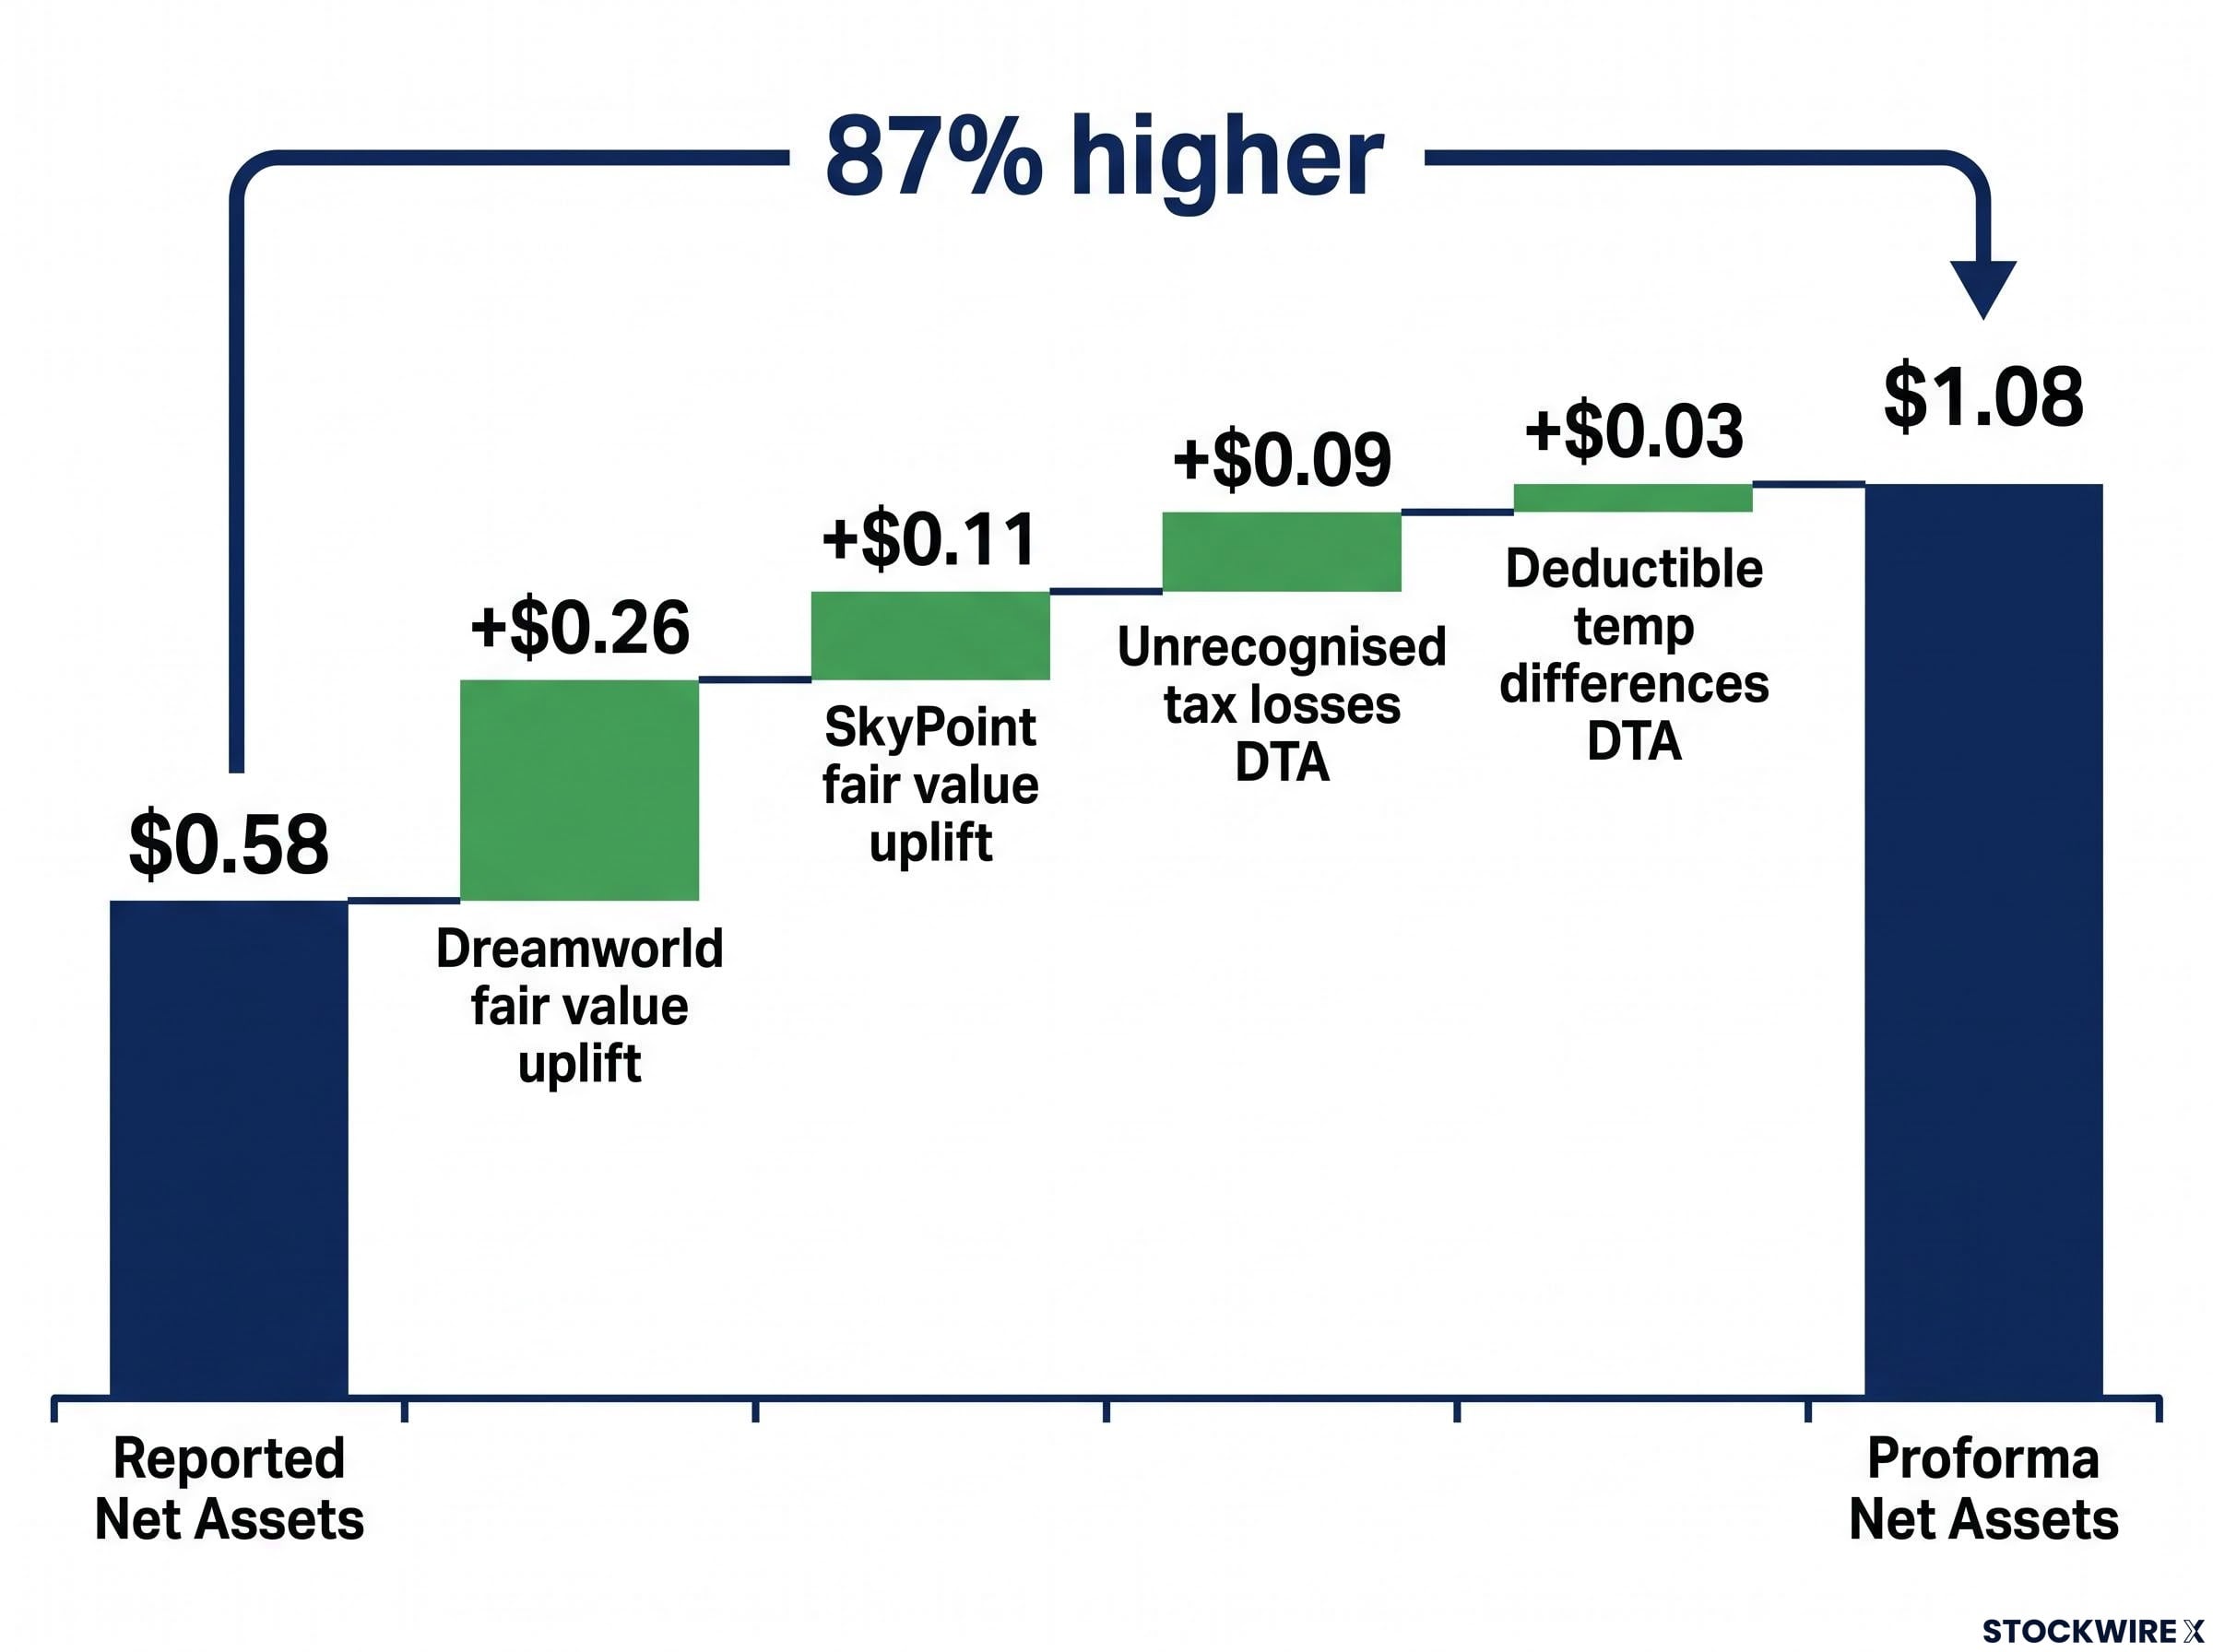
The central investment angle management outlined was the significant asset value sitting off the balance sheet. Reported net assets stood at $0.58 per share, while unaudited proforma net assets were calculated at $1.08 per share, some 87% higher.
The catalyst was the July 2026 development application (DA) approval for the 55-hectare Coomera landholding, which permitted four core precincts, including the Gateway and Town Centre Transition precincts allowing hotel, high-density residential, health and education uses.
The Coomera development approval, granted by the Queensland Government in July 2026, established the Dreamworld Development Code across the 55-hectare freehold landholding and unlocked four distinct precincts spanning hotel, high-density residential, eco-tourism and health care uses.
Independent valuations by CBRE determined Dreamworld’s fair value at $295.9 million, above its book value of $193.2 million, and SkyPoint’s at $51.7 million, above its book value of $10.2 million. The company flagged that the Dreamworld valuation includes conditional uplifts and is stated on a gross basis, excluding transaction costs and yet-to-be-determined development and access costs. To progress the opportunity, CEH has appointed Barrenjoey Advisory to lead a review of capital and funding options for the DA.
| Component | $m | Per share |
|---|---|---|
| FY26 reported Net Assets | 224.2 | $0.58 |
| Dreamworld fair value uplift | 102.7 | $0.26 |
| SkyPoint fair value uplift | 41.5 | $0.11 |
| Unrecognised tax losses DTA | 36.5 | $0.09 |
| Deductible temp differences DTA | 13.5 | $0.03 |
| Proforma Net Assets | 418.4 | $1.08 |
In total, $50.0 million of deferred tax assets remain unrecognised on the balance sheet, comprising $36.5 million from total available tax losses of $136.1 million and $13.5 million from deductible temporary differences of $45.0 million.
Strategy for growth and what comes next
Management presented three strategic growth levers: growing attendance and revenue; operational excellence; and transforming Dreamworld into a multi-day destination through accommodation, conference and precinct assets.
The demand upside thesis centred on recovery headroom. FY26 attendance of 2.0 million remains 17% below the 2.4 million recorded in FY16, while Gold Coast international visitation sits at 63% of pre-COVID levels (China at 30%). Structural tailwinds highlighted included the Brisbane 2032 Olympics, associated with around $7 billion of venue investment and an expected 10 million visitors, and Dreamworld’s 50th anniversary in 2031.
The July 2026 trading update showed revenue up 10% (+7% LFL) and visitation up 12% LFL, though management cautioned that growth is moderating against a strong comparative and a softer consumer environment, and that current trading should not be taken as a guide to future performance.
The near-term pipeline management outlined includes:
-
Lost Mine Mayhem, the Motocoaster re-theme, planned to open in late 2027 at a cost of up to $20 million while retaining the existing track.
-
New event formats, including Christmas in July and an expanded year-round calendar.
-
Recurring revenue initiatives, including the Annual Dining Pass and the Dreamworld +PLUS loyalty programme.
-
The Coomera land, with a capital and funding review underway with Barrenjoey.
Management expressed optimism that consumer demand will continue to grow as macroeconomic conditions improve, while acknowledging the outlook remains dependent on that broader recovery.
Don’t Miss the Next Consumer Discretionary Turnaround
Breaking ASX news and in-depth analysis land in your inbox within minutes of release, completely FREE. Over 20,000 active subscribers already rely on Big News Blast to stay ahead of market-moving announcements the moment they drop. Click the “Free Alerts” button to join them and never be caught off guard by the next major consumer sector update.