
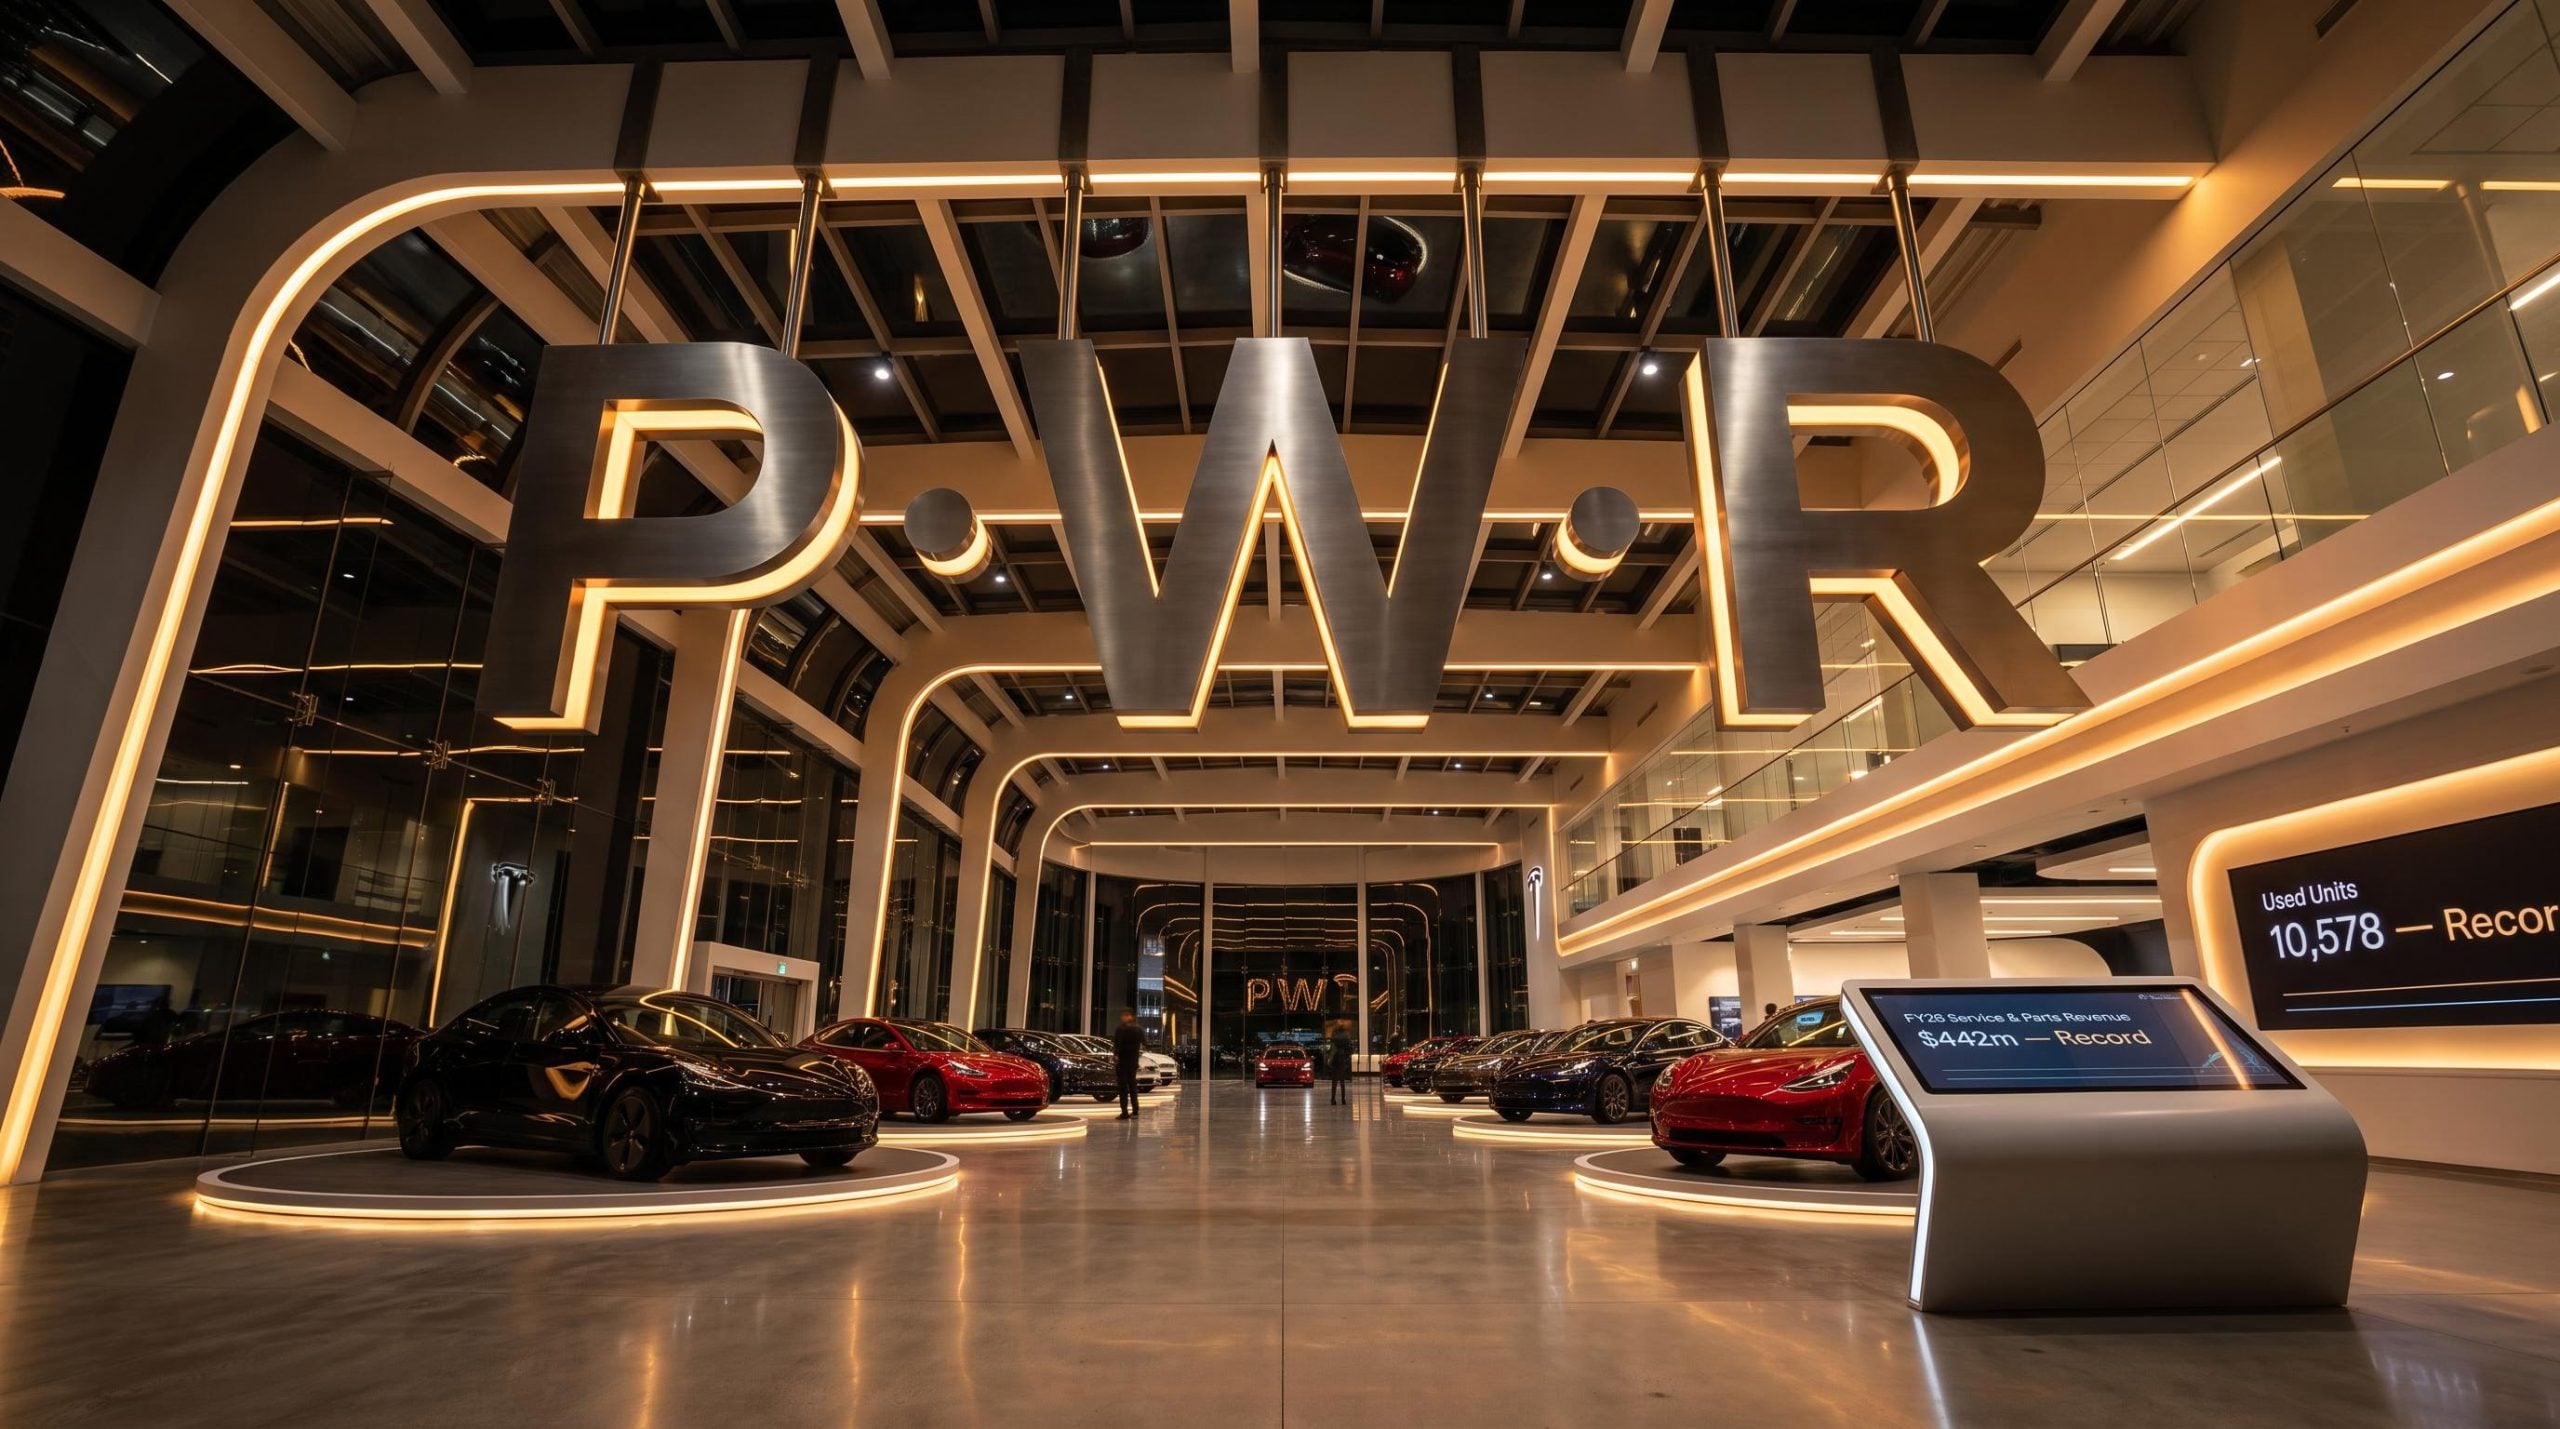
FY26 results: resilient revenue as Peter Warren repositions for growth
In its FY26 results presentation, released on 21 August 2026, Peter Warren Automotive (ASX: PWR) detailed a year of strategic repositioning against a backdrop of margin pressure and accelerating industry disruption.
Revenue and gross margin held firm across the completed period, yet underlying profit before tax (PBT) declined, driven by new vehicle margin compression and cost inflation. The group recorded revenue of $2,489m (up $6.7m), a gross margin of 16.3% (up 0.2 ppts), and underlying PBT of $14.5m (down $7.8m, or 35%). A total dividend for the year of 3.6c fully franked was declared, including a final dividend of 0.6c. Management positioned FY26 as a foundation-building year ahead of an anticipated FY27 earnings recovery.
When big ASX news breaks, our subscribers know first
FY26 results overview: revenue holds, earnings mix strengthens
The company delivered stable top-line performance while shifting its earnings mix towards higher-quality, recurring revenue streams. Revenue was largely flat as lower new vehicle average selling prices were offset by record used, service and parts volumes.
Gross profit rose 1.6% to $406.0m, with margin improving to 16.3% on a favourable mix. Underlying PBT was impacted primarily by operating cost growth tied to the business transition to new brands and broader inflationary pressures.
The FY26 earnings downgrade issued in late May flagged three converging headwinds: fuel price volatility tied to Middle East conflict, three RBA rate rises compressing buyer budgets, and intensifying competition from new market entrants, each of which is visible in the final underlying PBT result.
| Metric | FY26 | Change | Why it matters |
|---|---|---|---|
| Revenue | $2,489m | +$6.7m | Held firm despite lower new vehicle ASP |
| Gross margin | 16.3% | +0.2 ppts | Favourable used, service and parts mix |
| Underlying PBT | $14.5m | -$7.8m | New vehicle GPU pressure and cost inflation |
| Interest cost | $43.8m | -$5.3m | Lower average inventory, improved ageing |
| Leverage (net debt/EBITDA pre-AASB16) | 0.83 | from 0.65 (FY25) |
The presentation highlighted a series of record operational results underpinning this higher-quality growth narrative:
-
Used units of 10,578 (+876, +9%), a record
-
Service and parts revenue of $442m (+$19.9m, +5%), a record
-
Order bank of 6,349 units (+1,319 units)
-
Inventory ageing over 120 days improved to 26.1% (-3.4 ppts)
-
New units of 31,390 (+148)
For investors, the growth in back-end and recurring revenue streams provides a cushion against cyclical pressure on new-car margins, a dynamic that increasingly defines dealership profitability.
Why the market backdrop matters: the shift to value and new energy vehicles
The Australian automotive market is undergoing a structural shift, and understanding it helps explain both the pressure on FY26 earnings and the logic behind the company’s strategy.
Cost-of-living pressures, higher interest rates and reduced consumer confidence are driving value-seeking behaviour and stronger demand for fuel efficiency. Buyers are showing lower brand loyalty and greater willingness to consider newer entrants, particularly new energy vehicles (NEVs), a category covering hybrid, plug-in hybrid, electric and hydrogen-powered vehicles.
Two terms are central here. GPU, or gross profit per unit, measures the margin a dealer earns on each vehicle sold. New energy vehicle refers to lower-emission drivetrains gaining rapid market share. When new-car GPU falls, as legacy brands discount to compete with new entrants, dealer profitability is directly squeezed. This is why a dealer’s brand portfolio positioning matters so much to investors.
The scale of the competitive shift is notable:
-
67 brands are competing currently, up from 59 in 2025
-
A projected 75 brands by 2031, a 92% increase over the decade
-
Chinese brands now represent approximately 30% of the market, up more than 70% calendar-year-to-date to July
Intensifying competition pressures legacy brands but rewards dealers with exposure to fast-growing value and NEV brands.
The Chinese brand strategy driving future growth
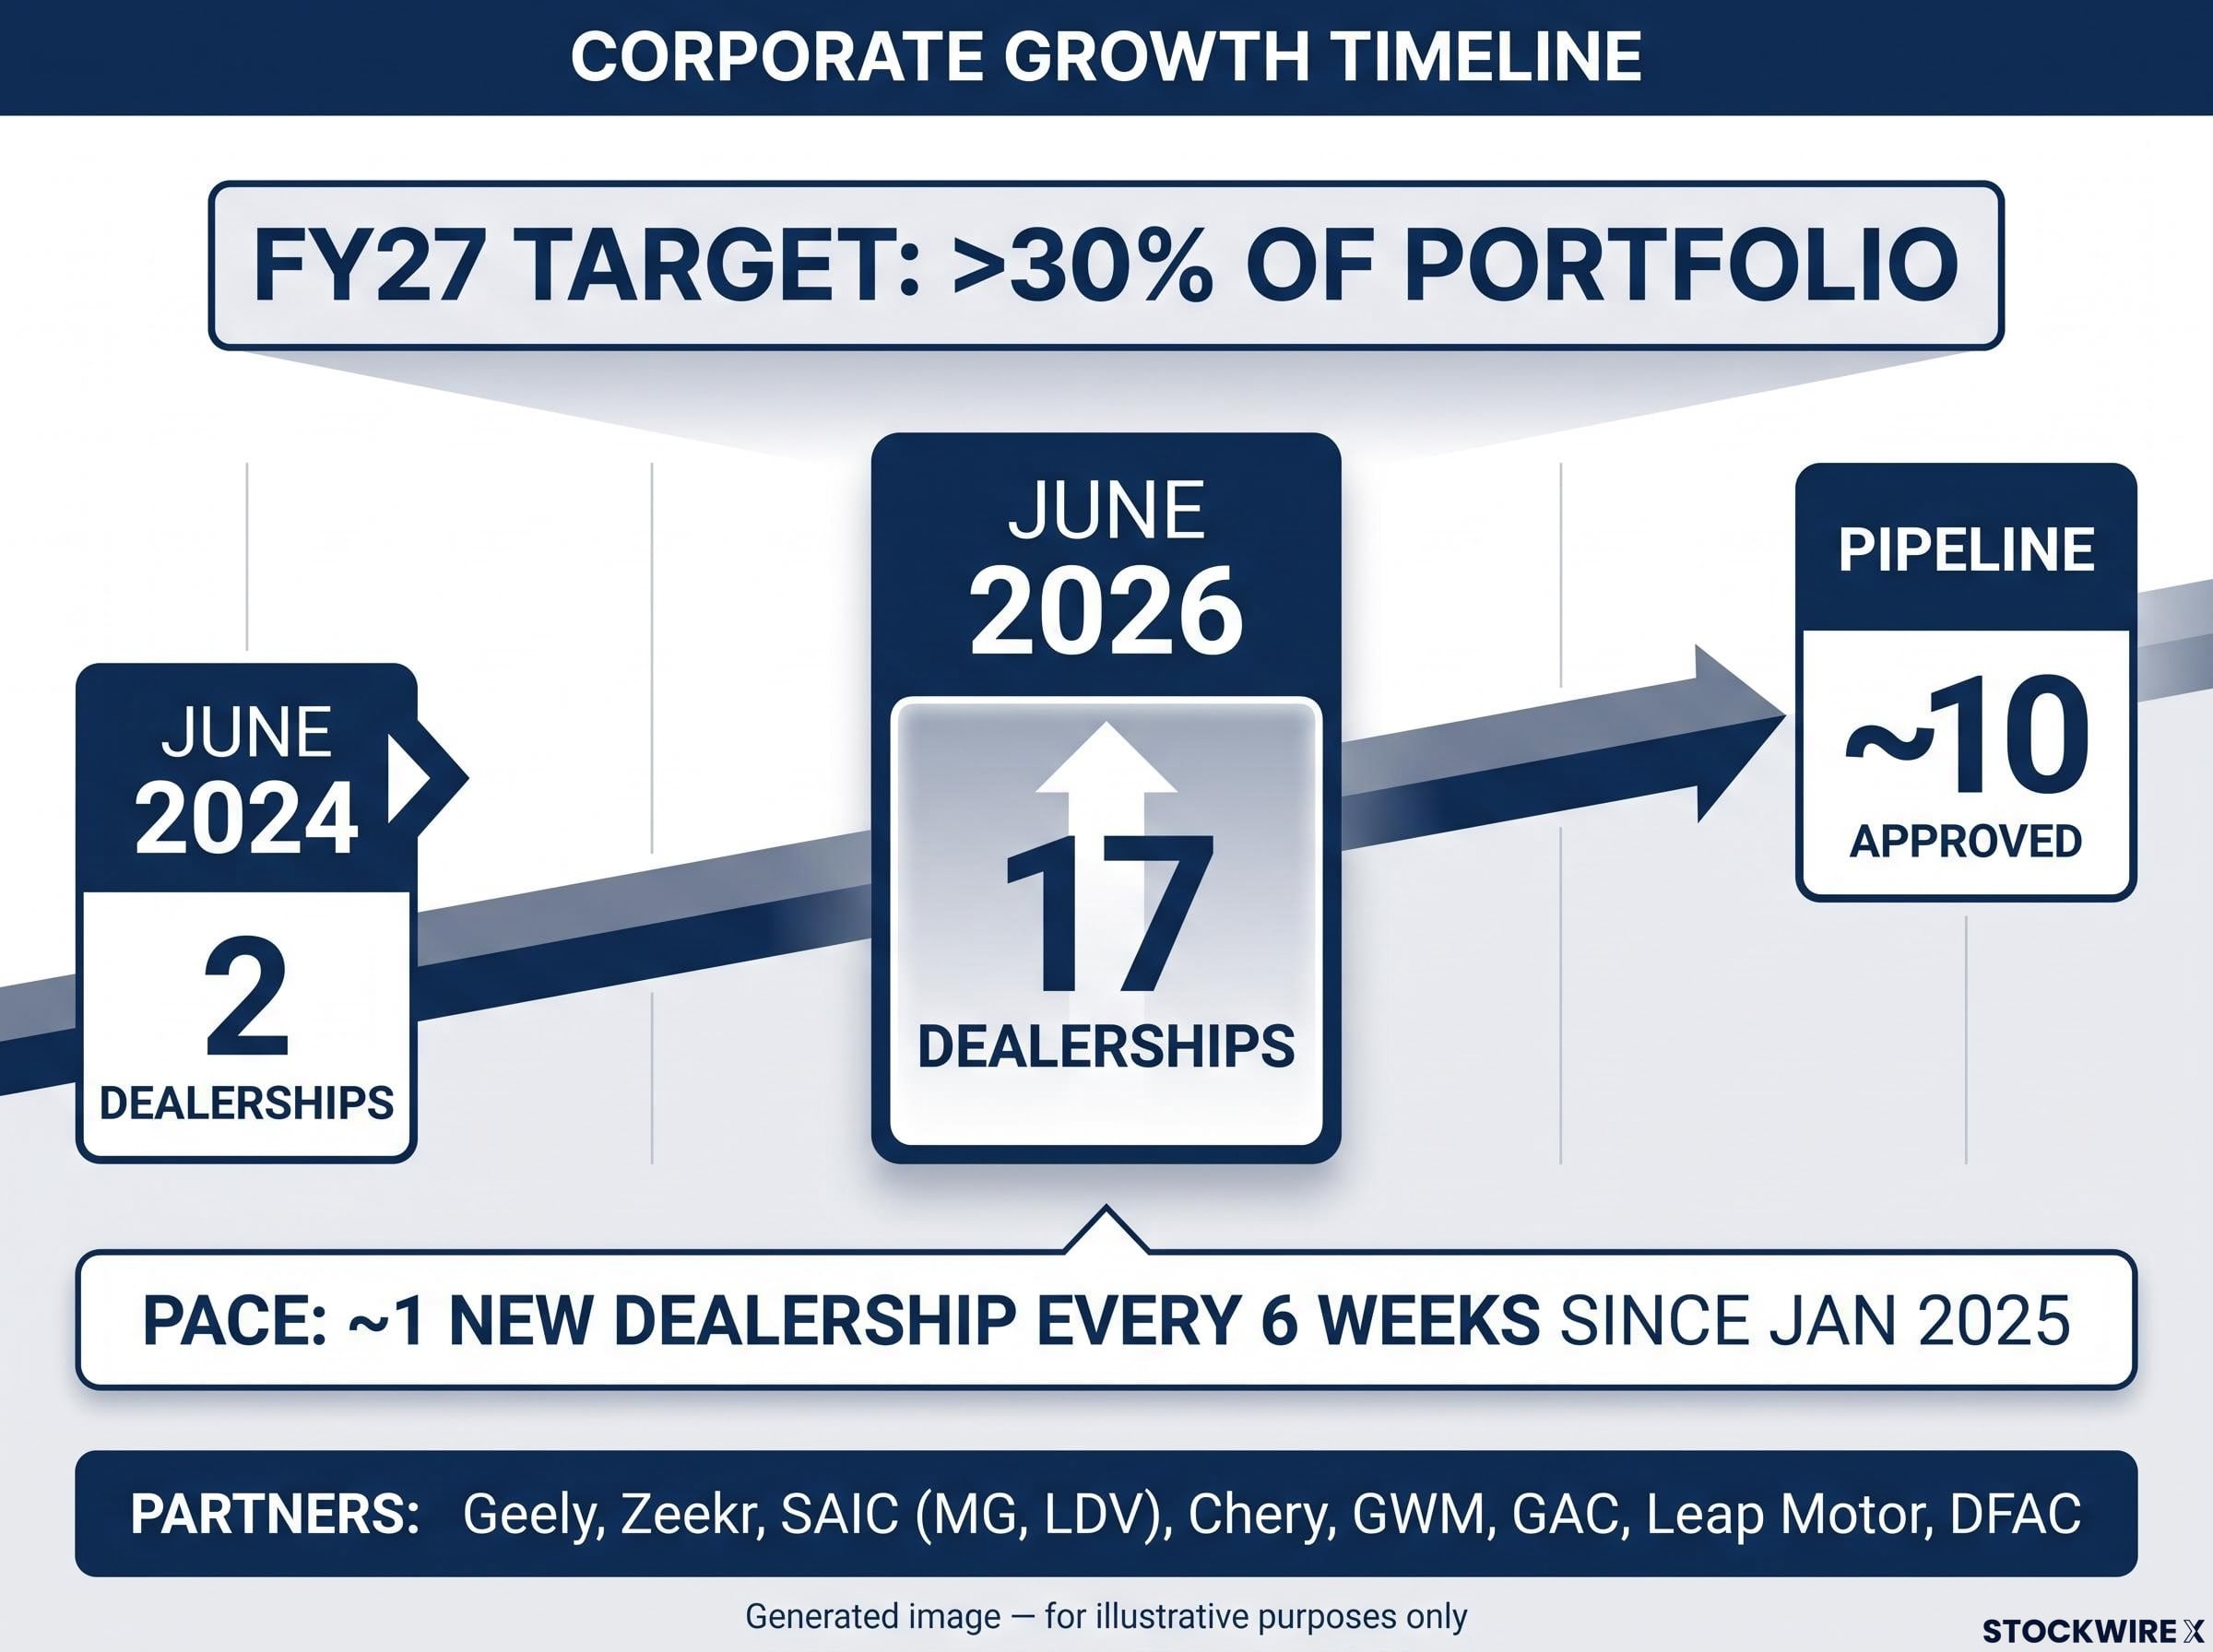
The core investment thesis of the presentation centres on management’s deliberate pivot towards Australia’s fastest-growing market segment. Peter Warren expanded its Chinese brand dealership count from just 2 (June 2024) to 17 (June 2026), and is targeting more than 30% of the PWAH portfolio in FY27.
Since January 2025, the company has added roughly one new Chinese brand dealership every 6 weeks on average, with approximately 10 additional dealerships approved and in the pipeline. The strategy is diversified across major Chinese groups, including Geely (Geely, Zeekr), SAIC (MG, LDV), Chery, GWM, GAC, Leap Motor and DFAC.
Geely: partnering with a global volume leader
The presentation stated that Peter Warren is Geely’s largest partner nationally, holding the highest sales and largest footprint of any dealer group in Australia. Management noted the Geely EX-2 was the best-selling car across all brands and segments in China, with more than 460,000 units sold, and the best-selling small EV worldwide.
The EX-2 is launching in Australia this month, with eight new models due within the following year, offering exposure to a brand only just beginning to scale locally.
Zeekr: exposure to the fastest-growing premium brand
Management described Zeekr, Geely’s premium sub-brand, as the fastest-growing premium brand in Australia despite operating locally for under two years. More than 90% of its year-to-date volume came from a single model, the 7X, with the 7GT, 8X and 9X arriving in early 2027.
The partnership expands Peter Warren’s exposure to the premium market and provides a platform for future value creation, illustrating why FY26 costs rose as the portfolio was repositioned.
Innovation and customer strategy: building operating leverage
The presentation detailed productivity and customer-retention initiatives underpinning margin resilience. Disciplined investment in data, automation and artificial intelligence (AI) is reported to be delivering measurable outcomes today.
Key metrics included:
-
$44m revenue generated from AI-converted service opportunities (+56% year-on-year)
-
44% of after-hours appointments captured via AI
-
2.9x improvement in customer win-back conversion
-
Service retention up 8 ppts; OEM Customer Satisfaction Index (CSI) up 7 ppts
-
220+ apprentices developed
These technology and retention initiatives support recurring, higher-margin revenue and scalable growth across the network.
Financial position and dividend
The group ended the period with a property-backed balance sheet retaining flexibility for potential consolidation opportunities. Operating cash flow after floorplan interest was $67.3m, representing 71.1% cash conversion.
Net debt stood at $47.4m, with net debt to EBITDA (after floorplan interest) of 0.7x. Owned property was valued at $243.7m, an LTV of 19.5%, with net tangible assets (NTA) of $1.48 per share. A final dividend of 0.6c fully franked brought the full-year dividend to 3.6c, at the upper end of the typical payout ratio. The Wakeling acquisition remains pending ACCC approval.
For readers wanting the full picture on how the transaction reached this point, our detailed coverage of the Wakeling acquisition status walks through the vendor Sunset Date decision, the interdependency between the two transaction documents, and what completion uncertainty means for the broader consolidation strategy.
Management’s stated outcome
“We enter FY27 with a stronger portfolio, higher-quality earnings and balance sheet capacity to act on market opportunities.”
FY27 outlook: converting positioning into earnings recovery
Management framed FY27 as the earnings recovery phase built upon the foundations delivered in FY26. The company expects three drivers to support improved performance:
-
Higher-quality earnings — shifting the mix towards higher-margin service, parts and used vehicles, with ongoing inventory and cost optimisation.
-
Brand portfolio-led growth — expansion with high-growth brands and deeper penetration in growth segments aligned to customer demand.
-
Disciplined capital deployment — preserved balance sheet flexibility, pursuit of EPS-accretive opportunities, and positioning for ongoing industry consolidation.
The presentation closed on its central forward theme: building a stronger Peter Warren today, to deliver higher-quality earnings growth tomorrow.
Don’t Miss the Next Consumer Sector Mover
Join 20,000+ investors receiving FREE breaking ASX news and in-depth analysis delivered to your inbox within minutes of release. Stay ahead of market-moving announcements the moment they drop. Click the “Free Alerts” button at Big News Blast to get real-time coverage across ASX consumer and automotive sectors before the market moves.