

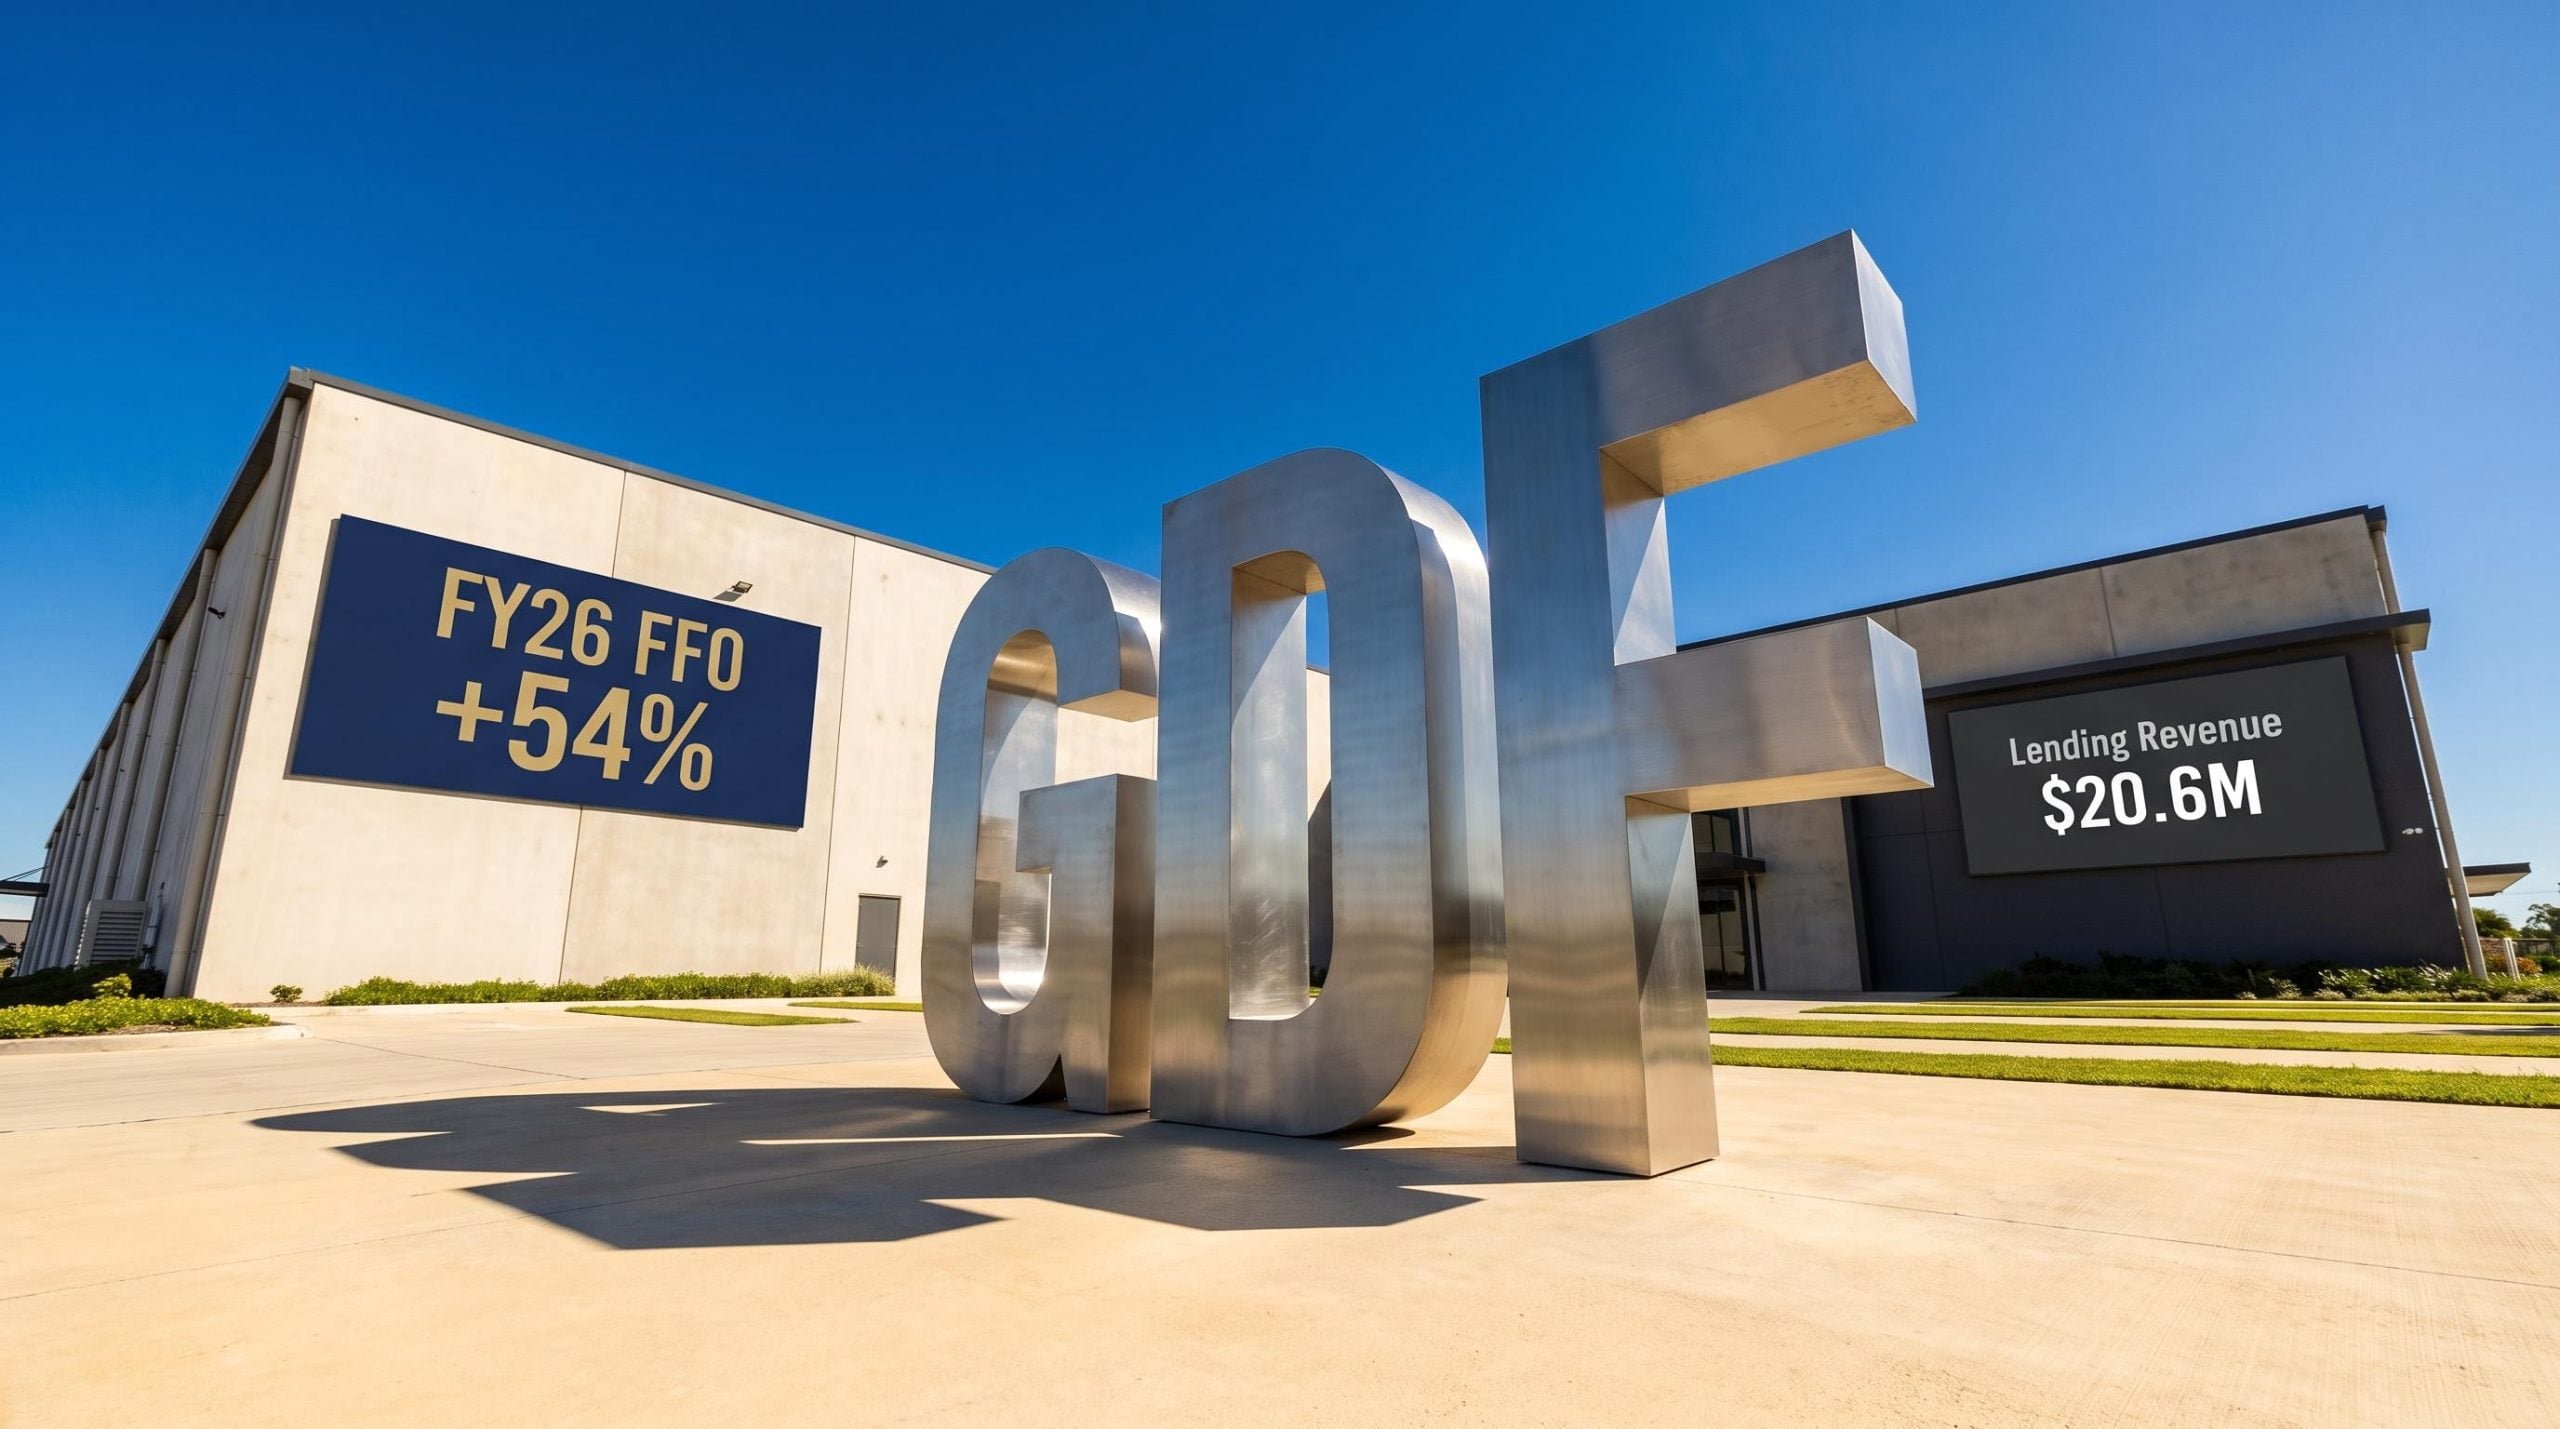
FY26 results: FFO per security jumps 54% as lending pivot reshapes Garda’s earnings
In its FY26 results presentation dated 30 July 2026, Garda Property Group reported funds from operations (FFO) per security of 11.1 cps, up 54% on FY25’s 7.2 cps. The result reflects a period in which the group’s real estate lending business scaled meaningfully alongside its Brisbane industrial portfolio.
Management outlined a dual-engine model, with lending now operating in parallel with direct property ownership. Distributions per security rose to 8.5 cps, an 18% increase, while gearing fell sharply to 29.8% from 42.9% a year earlier.
The strategic shift is clear in the revenue mix. The presentation detailed that lending contributed 49% of FY26 group revenue, up from 23% in FY25, marking a structural change in how Garda generates earnings.
When big ASX news breaks, our subscribers know first
FY26 by the numbers: earnings, distributions and a stronger balance sheet
Garda highlighted improvements across its core earnings, distribution and balance sheet measures. The payout ratio tightened to 77.0% from 84.9%, while net tangible assets (NTA) per security rose to $1.64, an increase of 1.9%.
The presentation noted that full-year FFO outperformed initial FY26 guidance by 23.6%, or $4.3 million. Initial guidance of an 8 cps distribution at a 90% payout ratio was upgraded at interim reporting to 8.5 cps at an 85% payout ratio, with the full-year result ultimately landing at a 77.0% payout.
| Metric | FY26 | FY25 | Change |
|---|---|---|---|
| FFO per security | 11.1 cps | 7.2 cps | +54% |
| Distributions per security | 8.5 cps | 7.2 cps | +18% |
| Payout ratio | 77.0% | 84.9% | -7.9pp |
| Gearing | 29.8% | 42.9% | -13.1pp |
| NTA per security | $1.64 | $1.61 | +1.9% |
| Lending revenue contribution | 49% | 23% | +26pp |
The FFO reconciliation table within the presentation records FY25 distributions per security at 6.3 cps, while the highlights slide cites 7.2 cps as the FY25 comparison used for the +18% distribution growth figure.
The lending engine: loan book nearly doubles to $134 million
The standout operational story from the presentation was the scaling of Garda’s loan book. Loan receivables rose $66.4 million in the half to $134.1 million, with a further $68 million of undrawn commitments expected to be drawn through FY27.
Garda detailed total committed loans of $202 million across 18 facilities, carrying an average loan return of 20.1% p.a. and a drawn loan weighted average loan term (WALT) of approximately 10 months.
Lending revenue grew from $7.7 million in FY25 to $20.6 million in FY26, with management forecasting $22.7 million for FY27. Capital allocated to lending rose from 2% of group assets in FY23 to 27% in FY26.
The presentation outlined the loan book composition as follows:
-
Approximately 68% senior debt type risk (up to 70% LVR)
-
Approximately 32% in early-stage and higher-leverage positions
-
Sector split by loan limit: Residential 46%, Industrial 40%, Other 14%
Management described FY27 as the first year of scaled deployment, positioning lending as a scaled, high-return contributor to group earnings.
What real estate lending means for Garda investors
As a real estate lender, Garda “originates, structures and underwrites full project funding from senior debt through to equity” for Southeast Queensland residential and industrial development projects. It provides whole-of-project finance under a single facility and security structure.
Loan pricing is structured across bands of risk. Senior debt sits at the lower end (secured to a defined loan-to-value ratio), mezzanine debt ranks behind it at a higher rate, and preferred equity steps up again, sometimes including profit participation or exit fees. Higher-risk positions carry higher returns.
The model is differentiated because Garda is itself an owner and developer. This means it understands the development lifecycle and project risks, and can supervise borrower projects or support work-outs where needed. For investors, the structure offers exposure to higher-return credit yields (20%+ p.a.) alongside a physical property portfolio, both leveraged to Southeast Queensland growth.
Industrial portfolio: valuations strengthen on Brisbane rental growth
The presentation covered Garda’s $340 million Brisbane industrial portfolio, comprising 9 properties totalling 130,765m². Eight of nine properties were independently valued in June 2026, delivering an $8.25 million (2.5%) uplift in carrying values, equivalent to approximately 4 cps.
The June 2026 portfolio valuations confirmed an $8.253 million (2.5%) uplift across eight properties, with Morningside and Acacia Ridge the strongest contributors as Brisbane industrial rents and land values continued to firm.
The uplift was driven by average market rental growth of 5.0%, with Morningside leading the portfolio at 14.1% growth. Key portfolio metrics included a cap rate of 5.88%, a weighted average lease expiry (WALE) of 4.1 years, occupancy of 77.4%, and annual rent increases of 3.4%.
Garda highlighted a new 10-year lease with O’Brien Glass Industries over 6,754m² at Acacia Ridge, commencing 1 July 2026, adding $1.4 million in net property income in FY27. The remaining 8,018m² balance offers a further $1.5 million of net property income upside.
The presentation also detailed the Morningside development at 326 Thynne Road, carrying total capex of $14.0 million at a forecast 12.2% yield on cost. On completion, expected in December 2026, annual rental income is forecast to lift from $2.1 million to $4.2 million.
Passing rents sit below market across much of the portfolio, and this embedded rental reversion, combined with development upside, underpins the group’s future income growth potential.
Capital position: gearing cut to 29.8% with deleveraging optionality
Garda’s target gearing range is 30-35%, with current gearing sitting just below that band at 29.8%. In July 2026, the syndicated facility limit was increased by $20 million to $186 million, providing additional liquidity to 55% LVR.
A key point of optionality management emphasised is the short duration of the loan book. Given the approximately 10-month average term of the $134.1 million drawn lending book, gearing would fall to 1.4% if the loan book were allowed to fully run off.
The presentation also noted interest cover of 3.6x and a forecast FY27 debt cost of 4.0%. The combination of low gearing and a self-liquidating loan book affords the group balance sheet flexibility uncommon among REITs.
FY27 guidance and the growth roadmap
For FY27, management guided to earnings per security (EPS) of 10.5 cps and a distribution of 9.0 cps, up 5.9%. This implies a distribution yield of 8.5% (on a $1.055 price) at a payout ratio of approximately 85%, with a quarterly distribution of 2.25 cps. The presentation described the ~85% payout ratio as conservative, providing scope for upgrades as milestones occur.
Management flagged five key drivers to support earnings across FY27 and FY28:
-
Morningside, expected to add approximately $4.1 million p.a. in net property income in FY28.
-
Acacia Ridge, adding a further $1.5 million p.a. on leasing the 8,018m² balance.
-
Embedded rent growth, with 3.4% weighted average annual increases across the portfolio.
-
Lending growth, with up to $90 million in Q4FY27 for deployment. The FY26 weighted average loan return was 20.1% p.a.
-
Lending exit fees, with four higher-leverage projects expected to complete in FY27 (no income yet included in guidance).
The presentation cited a three-year FFO CAGR of 20.0% and a DPS CAGR of 12.6%, both including forecast FY27.
The NTA discount: private market vs listed pricing
Management emphasised a valuation disconnect between private-market property values and where the listed security trades. Garda’s ASX price of $1.055 represents a 35.7% discount to NTA of $1.64.
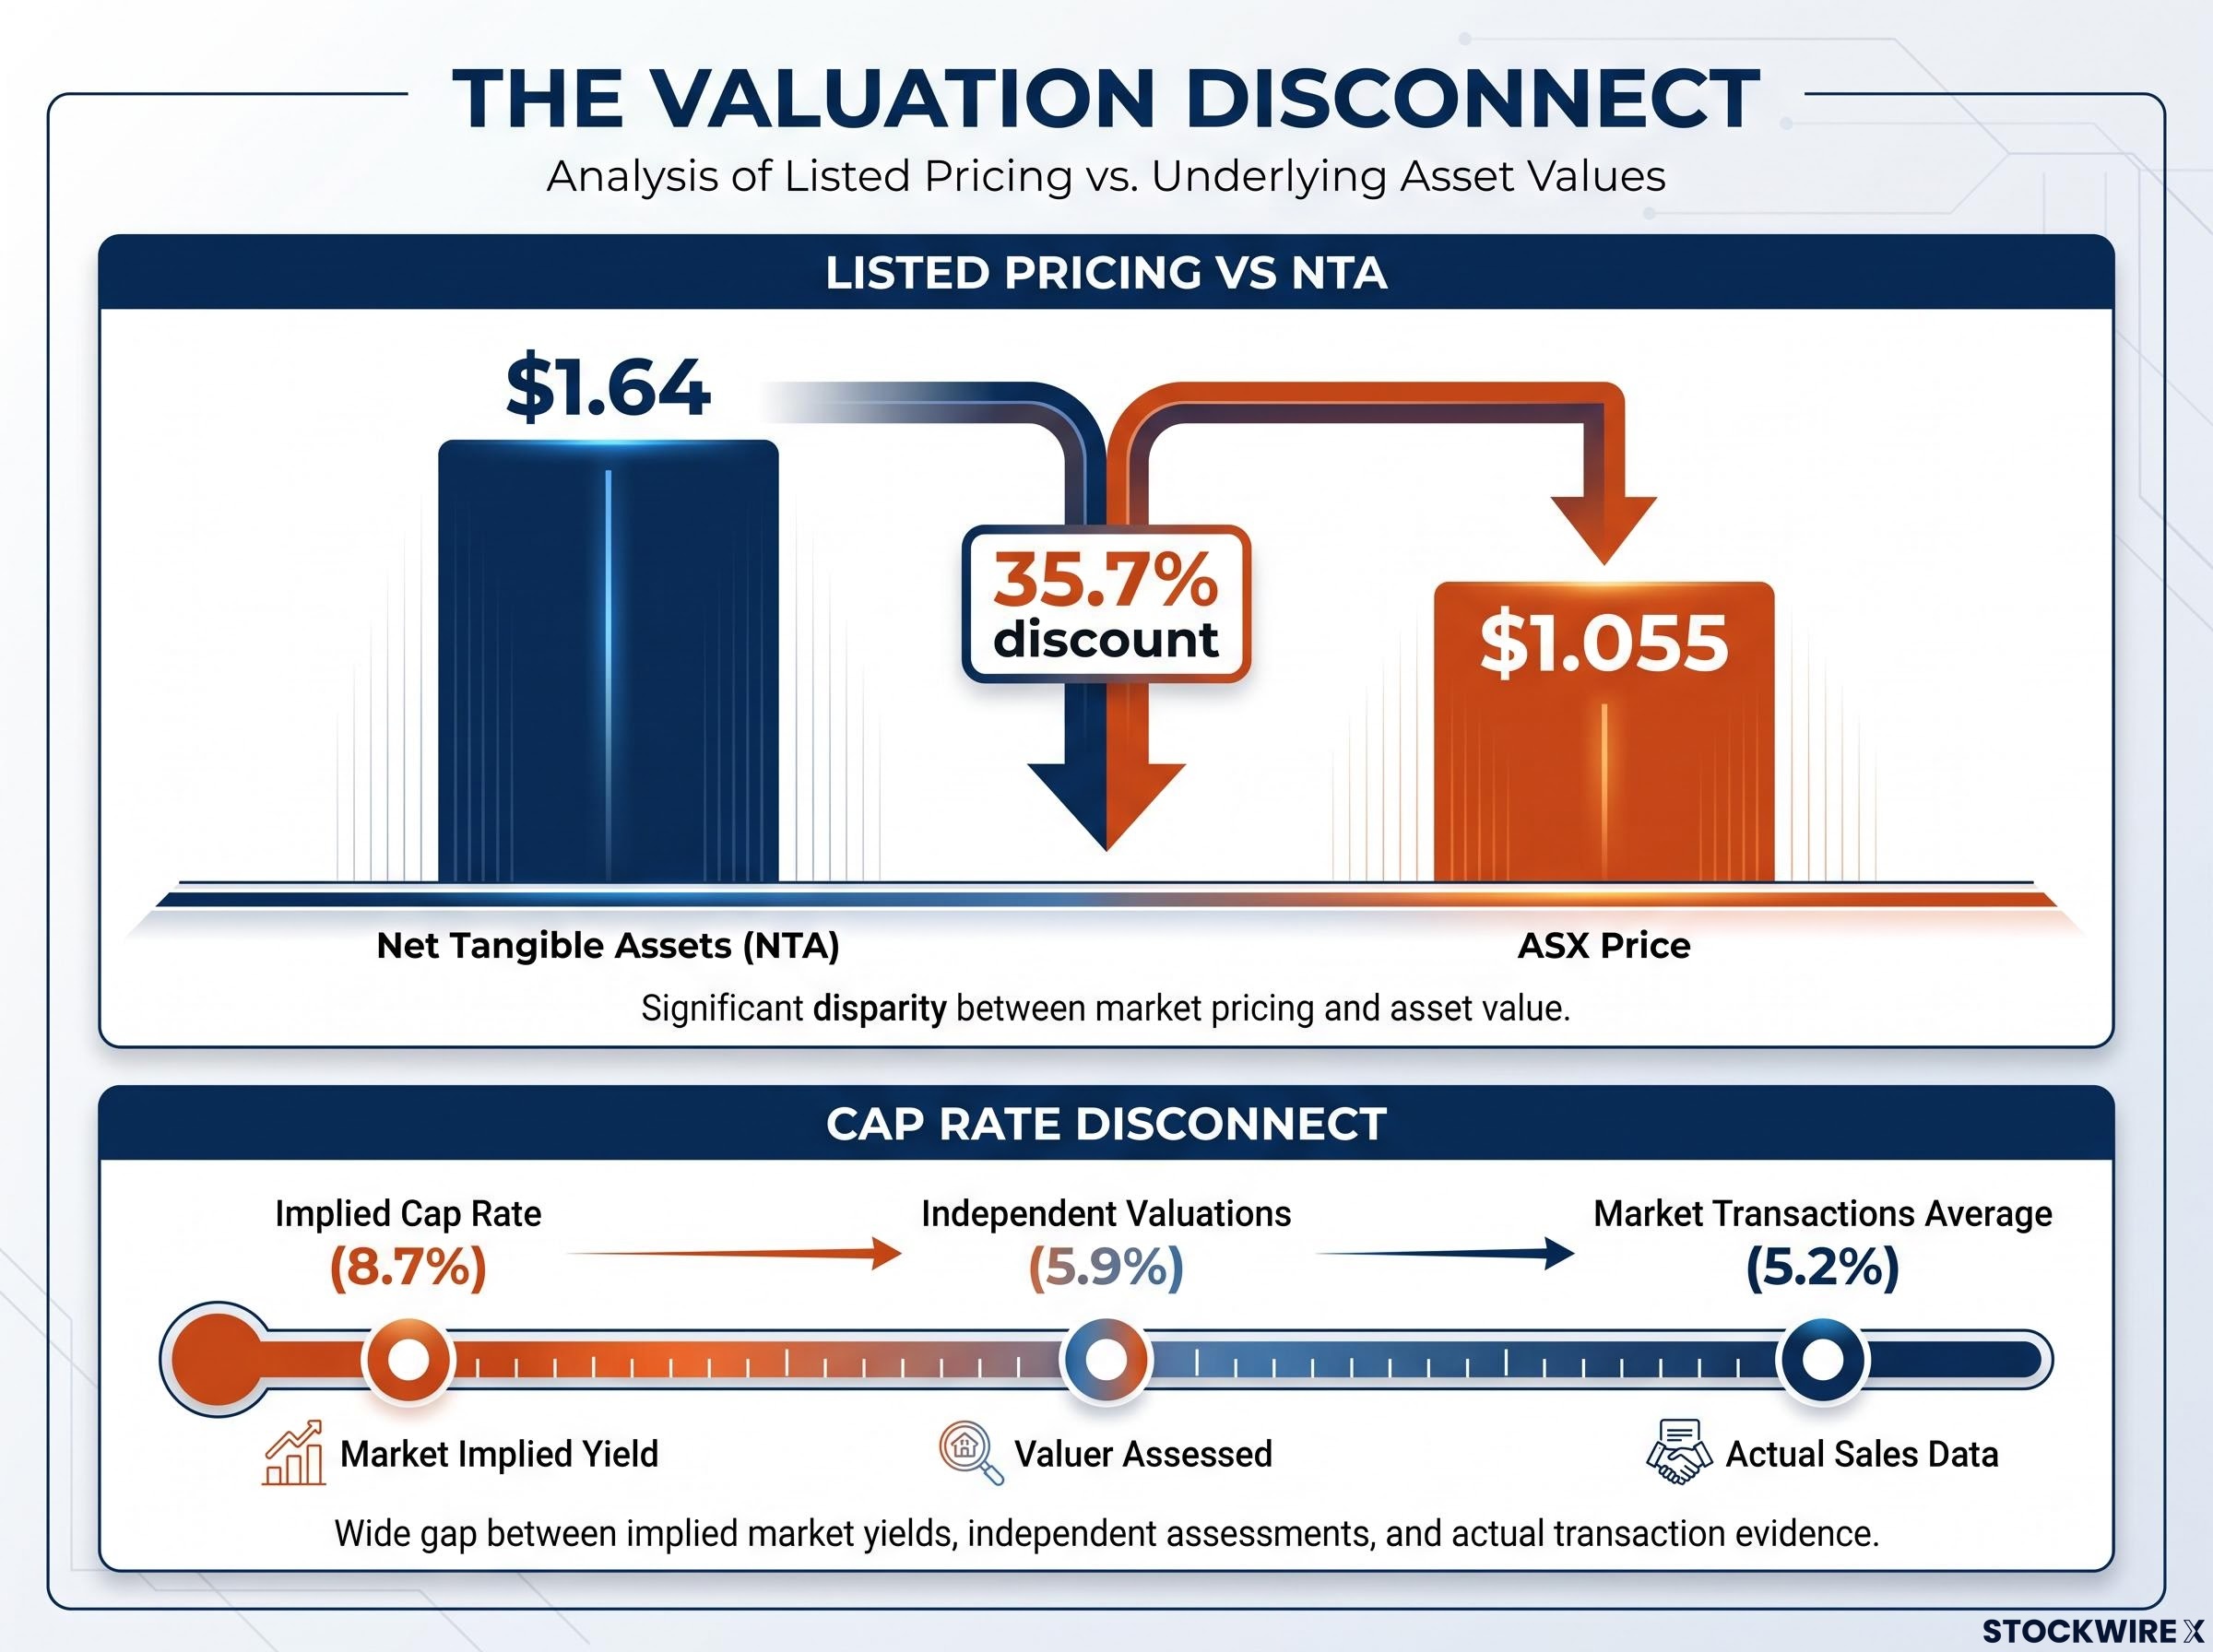
The implied cap rate underscores the gap. Independent valuations sit at 5.9%, yet the share price implies an 8.7% cap rate. Recent Brisbane industrial transactions occurred at passing yields of 4.8%-5.5% (average 5.2%), which management said validates the capitalisation rates adopted across Garda’s independent valuations.
Key thesis from the presentation
Private market industrial transactions are occurring at capitalisation rates below 5.5%, while Garda’s implied capitalisation rate sits at 8.7%, a disconnect management characterised as continued mispricing by equity markets.
Closing: a re-rated, dual-engine SEQ property play
FY26 marked a structural transformation for Garda, with a scaled lending business now contributing alongside its established industrial portfolio. Gearing was reduced substantially, earnings and distributions grew, and management set out an FY27 outlook supported by multiple identified growth drivers. Both engines remain leveraged to Southeast Queensland’s growth.
Don’t Miss the Next ASX Real Estate Winner
Big News Blast delivers FREE breaking ASX announcements straight to your inbox within minutes of release, complete with in-depth analysis already done for you. Join 20,000+ active subscribers staying ahead of the market on real estate and beyond. Click the “Free Alerts” button at Big News Blast to start receiving alerts the moment news breaks.