
How to Evaluate Any ASX Stock Before You Buy It
6 hrs ago

Super funds are displaying 10-year balanced option returns of 7.8% to 8.1% per annum. For younger Australians building retirement plans around those numbers, this is not good news. It is a trap.
Those published performance figures capture a period defined by one of the most powerful structural tailwinds in financial history: four decades of falling inflation and falling interest rates. That tailwind is now gone. The Reserve Bank of Australia (RBA), Treasury, the Australian Prudential Regulation Authority (APRA), and the Australian Securities and Investments Commission (ASIC) have each issued guidance warning against extrapolating these returns forward. Yet most everyday retirement calculators and super fund projections continue to do exactly that.
This guide explains why historical super returns are an unreliable foundation for retirement planning in a higher-inflation environment, how the disinflation era produced returns that cannot be repeated, what risks now threaten retirement portfolios, and what conservative planning benchmarks Australians should use instead, including a 3-4% drawdown rate and a 25-30 times capital-to-spending multiple.
Open the performance page of any major Australian super fund and the numbers look reassuring. AustralianSuper’s Balanced option returned 7.9% per annum over the 10 years to 30 June 2024, and 8.1% per annum over 15 years. Australian Retirement Trust’s Super Savings Balanced option delivered 7.8% per annum over the 10 years to 31 December 2024. Hostplus Balanced returned 7.8% per annum over 10 years and 8.1% over 20 years, both to 30 June 2024. Across the entire APRA-regulated MySuper universe, the average was 7.7% per annum over the 10 years to June 2023.
| Fund / Benchmark | Return Period | Annualised Return | Data to |
|---|---|---|---|
| AustralianSuper Balanced | 10 years | 7.9% p.a. | 30 June 2024 |
| AustralianSuper Balanced | 15 years | 8.1% p.a. | 30 June 2024 |
| ART Super Savings Balanced | 10 years | 7.8% p.a. | 31 December 2024 |
| Hostplus Balanced | 10 years | 7.8% p.a. | 30 June 2024 |
| Hostplus Balanced | 20 years | 8.1% p.a. | 30 June 2024 |
| APRA MySuper universe average | 10 years | 7.7% p.a. | June 2023 |
These figures are real. They are also the product of an abnormally favourable period, not a representative slice of all possible market environments. Every year in those lookback windows falls within the post-1980s disinflation era, a period in which falling interest rates simultaneously boosted bond returns, equity valuations, and property prices.
APRA has been explicit on this point.
APRA’s retirement income covenant review, published jointly with ASIC in July 2023, found that many trustees had not adequately addressed the investment and inflation risks that threaten member income sustainability, reinforcing the case for conservative return assumptions in retirement projections.
In its August 2023 Information Paper, APRA cautioned that trustees must ensure member communications about future performance are not misleading and should not simply extrapolate high historical returns.
Most Australians use these published returns as the starting point for retirement projections. Understanding what conditions produced them is the first step to building a plan that does not fail silently over decades.
The returns shown in super fund performance tables did not arrive by chance. They were amplified by a structural tailwind that operated across every major asset class simultaneously: the four-decade decline in inflation and interest rates from the early 1980s onward. Understanding the mechanism explains why those returns cannot be projected forward.
Two channels drove the effect:
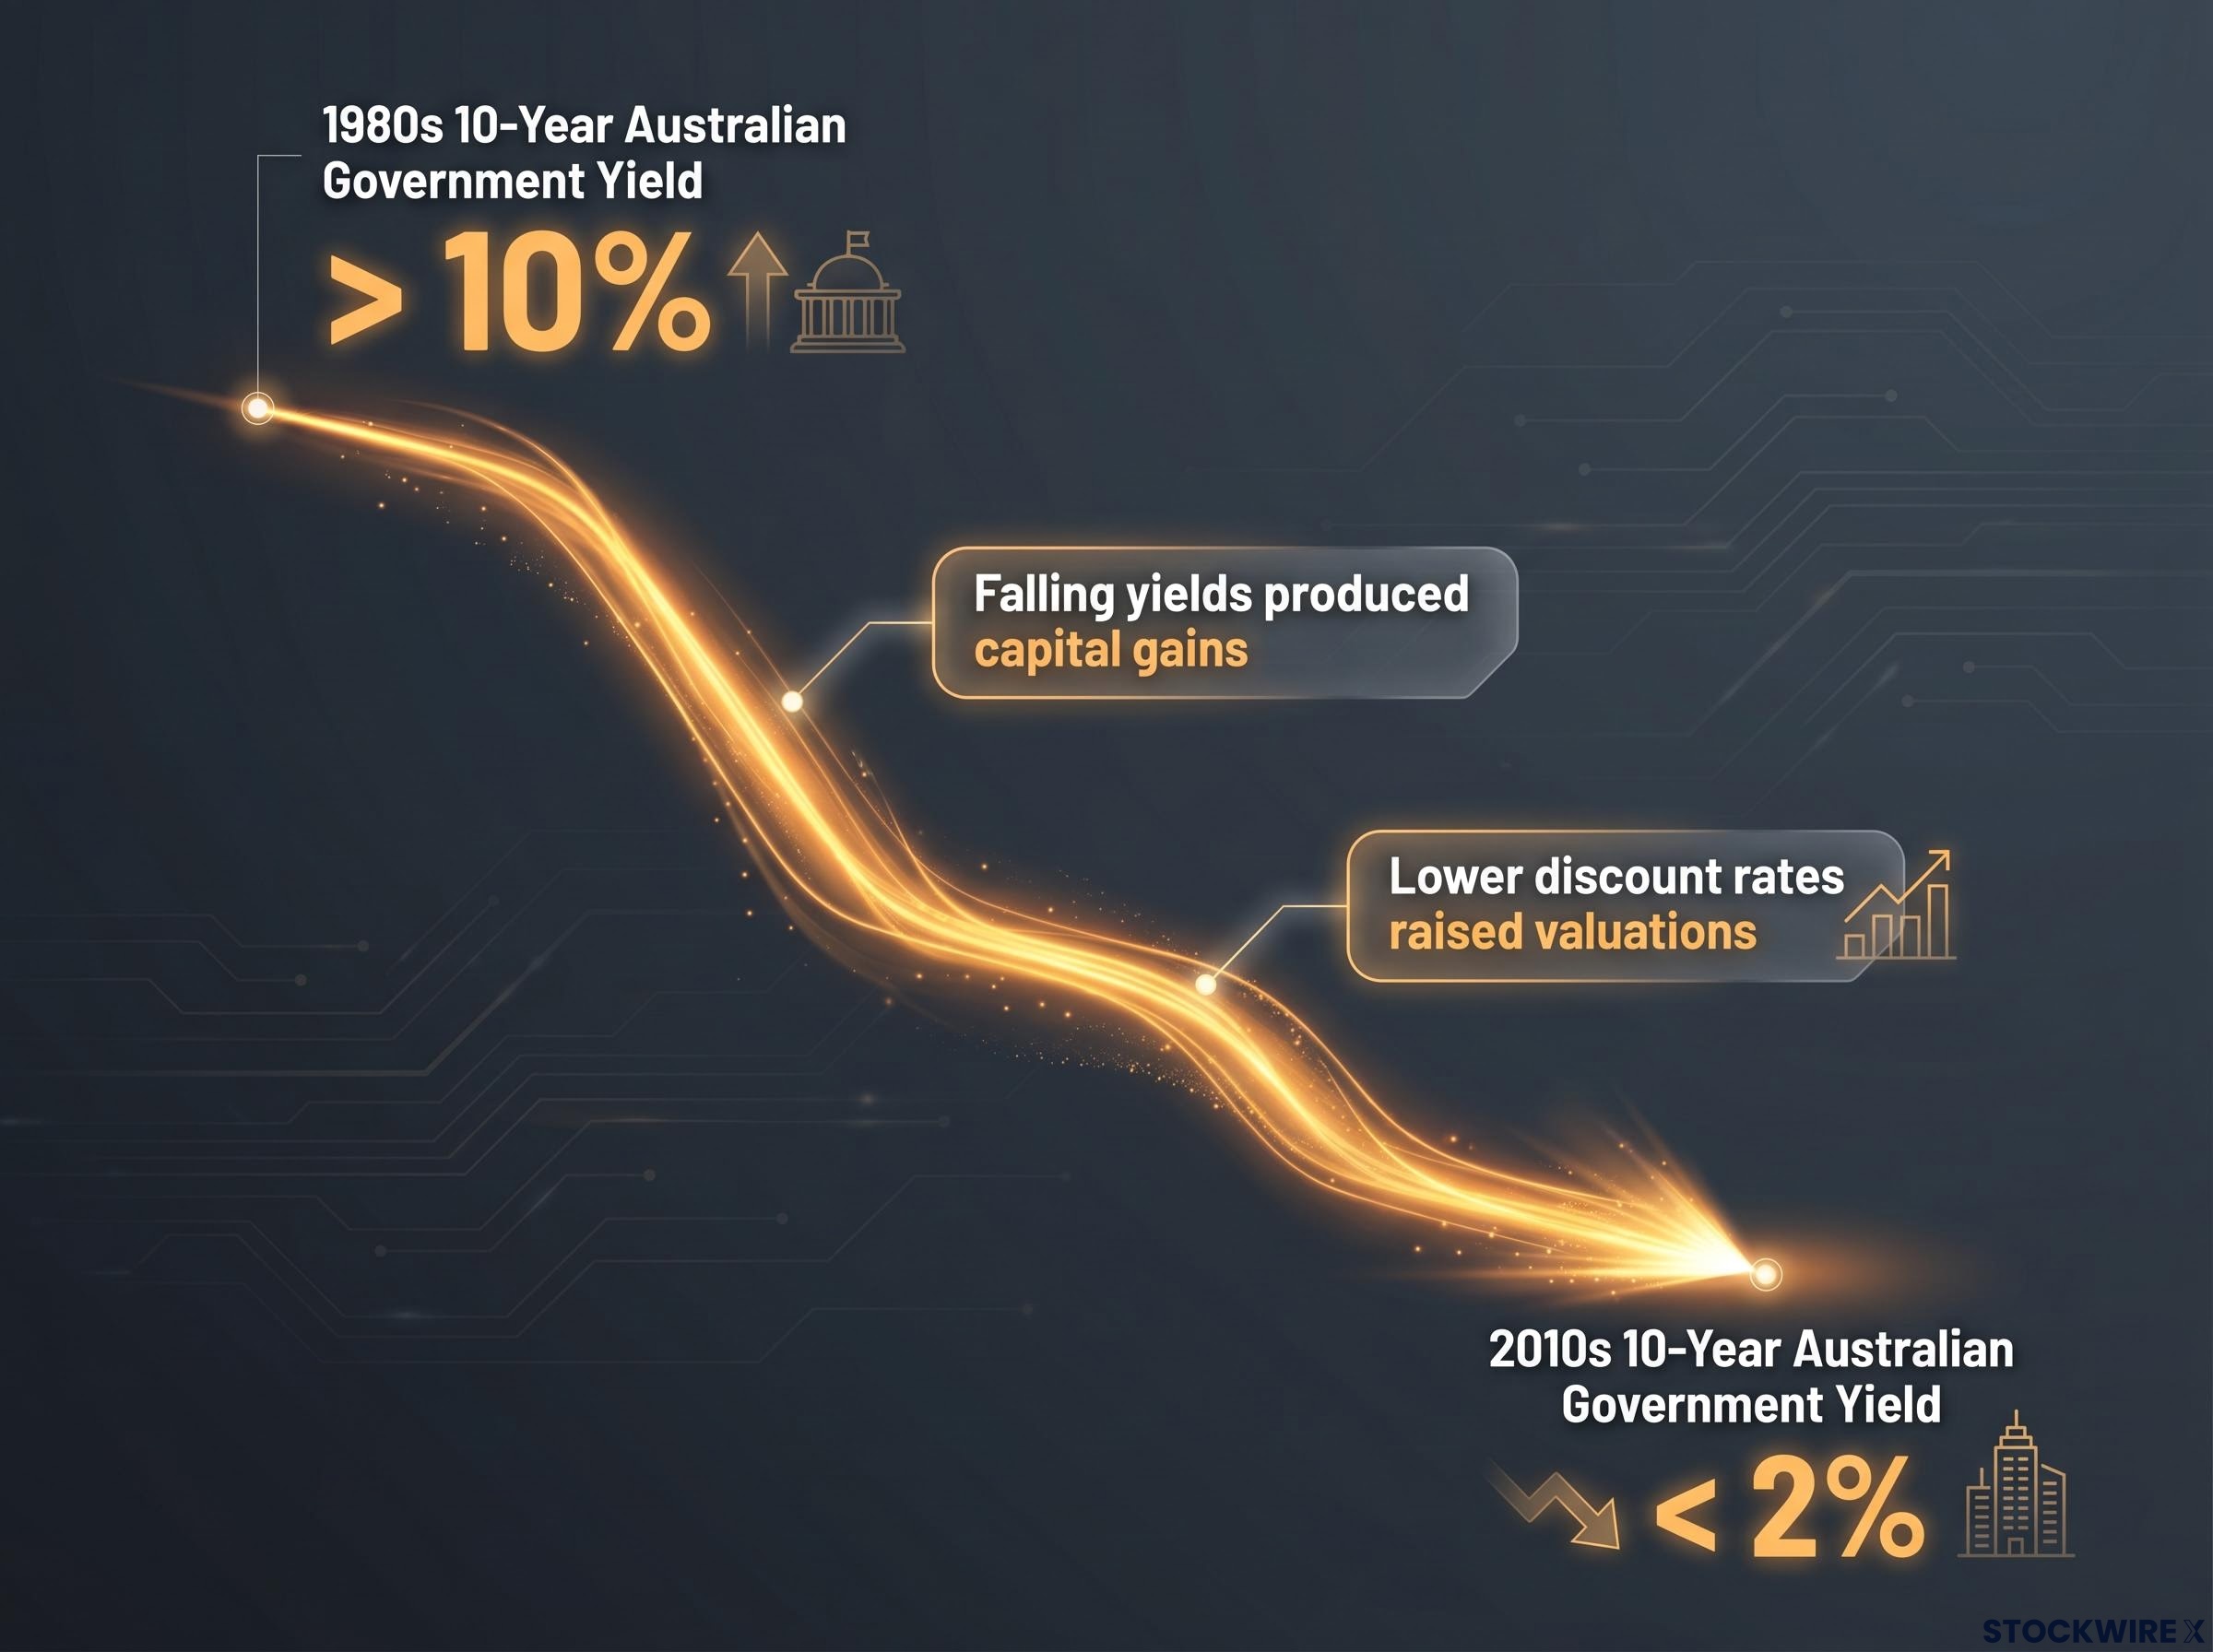
This was not a cyclical fluctuation. It was a one-off structural shift. Australian 10-year government bond yields fell from above 10% in the 1980s to below 2% in the 2010s. For that decline to be repeated, rates would need to go deeply negative for decades, a scenario that no mainstream forecaster considers plausible.
The RBA directly addressed the implications in its December 2024 Bulletin article, “From Low to Higher Interest Rates: Implications for Asset Prices and Household Wealth.” The finding was clear: the decades-long decline in real interest rates supported higher asset valuations and strong past returns, and a higher-rate environment implies lower expected future real returns for bonds and potentially equities.
The Intergenerational Report 2025, released in September 2025, reinforced this view, noting that lower productivity growth and ageing demographics may further constrain future real investment returns.
The Australian Bureau of Statistics (ABS) reported annual Consumer Price Index (CPI) inflation of 2.9% through the year to the March quarter 2026, released on 24 April 2026. The RBA’s May 2026 Statement on Monetary Policy forecasts CPI of approximately 2.8% by December 2026 and approximately 2.5% by December 2027.
Inflation settling within the 2-3% target band is positive for purchasing power stability. It does not, however, recreate the declining-rate tailwind. Rates are not falling from 10% to 2% again. The structural engine that powered four decades of above-trend returns has already completed its run.
Long-run equity and bond return data across a full century shows equities outperforming bonds by approximately 3-4 percentage points annually, but that premium is measured against a period that includes the full disinflation cycle, and the return of positive real bond yields in 2024-2025 has altered the forward-looking case for each asset class in ways not captured by simple historical averages.
The popular narrative about Baby Boomer wealth is one of discipline: they saved diligently, bought property early, and invested consistently. That is partly true. What is rarely acknowledged is that Boomers entered the market at the beginning of the most powerful disinflation cycle in modern financial history, and accumulated assets across its full duration.
Ashley Owen CFA of OwenAnalytics, writing via Morningstar Australia on 8 June 2026, frames this as a birth-timing thesis rather than a behavioural one. Boomers received the compounding benefit of every rate cut and every valuation re-rating from the early 1980s onward. The conditions that produced their wealth outcomes were structural, not repeatable by choice.
The contrast with cohorts entering the market today is stark:
Owen draws an analogy to prior generational cohorts: younger investors today face conditions more comparable to those entering markets around the 1940s or 1880s, periods just ahead of rising inflation cycles. The RBA’s November 2025 Financial Stability Review reinforced this concern, warning against over-reliance on 1990s-2010s return assumptions.
Some younger Australians are partially insulated through inheritance and intergenerational wealth transfers from Boomer parents. For those without that buffer, the planning implications are significant: copying Boomer investment patterns will not produce equivalent outcomes, because the structural conditions that drove those outcomes no longer exist.
Optimistic return assumptions do not simply overstate retirement income. They leave portfolios exposed to three compounding risks, each with documented Australian precedent.
Average returns over a long period can mask the damage caused by poor returns arriving at the wrong time. A sharp drawdown early in retirement, combined with ongoing withdrawals, permanently reduces the capital base from which any recovery must grow. Two retirees with identical average returns over 20 years can end up with vastly different balances depending on the order in which those returns arrived.
Sequencing risk in Australian superannuation operates through a compounding mechanism that is more damaging than the initial crash: the ASX 200 took approximately 11 years to reclaim its GFC peak, and a $500,000 portfolio that continued drawing down through that recovery window absorbed an opportunity cost exceeding $860,000 against historical average returns.
ASIC’s Moneysmart guidance (updated 2024) explicitly identifies inflation risk alongside investment risk and longevity risk as the three key threats to retirement income.
These three risks interact and compound. A retiree facing a poor sequence of returns in early retirement, a longer-than-expected lifespan, and persistent inflation above their plan’s assumptions has very limited corrective options. Planning on optimistic return assumptions leaves an investor exposed to all three simultaneously.
The preceding sections establish a structural problem. This section provides the specific planning numbers that follow from it.
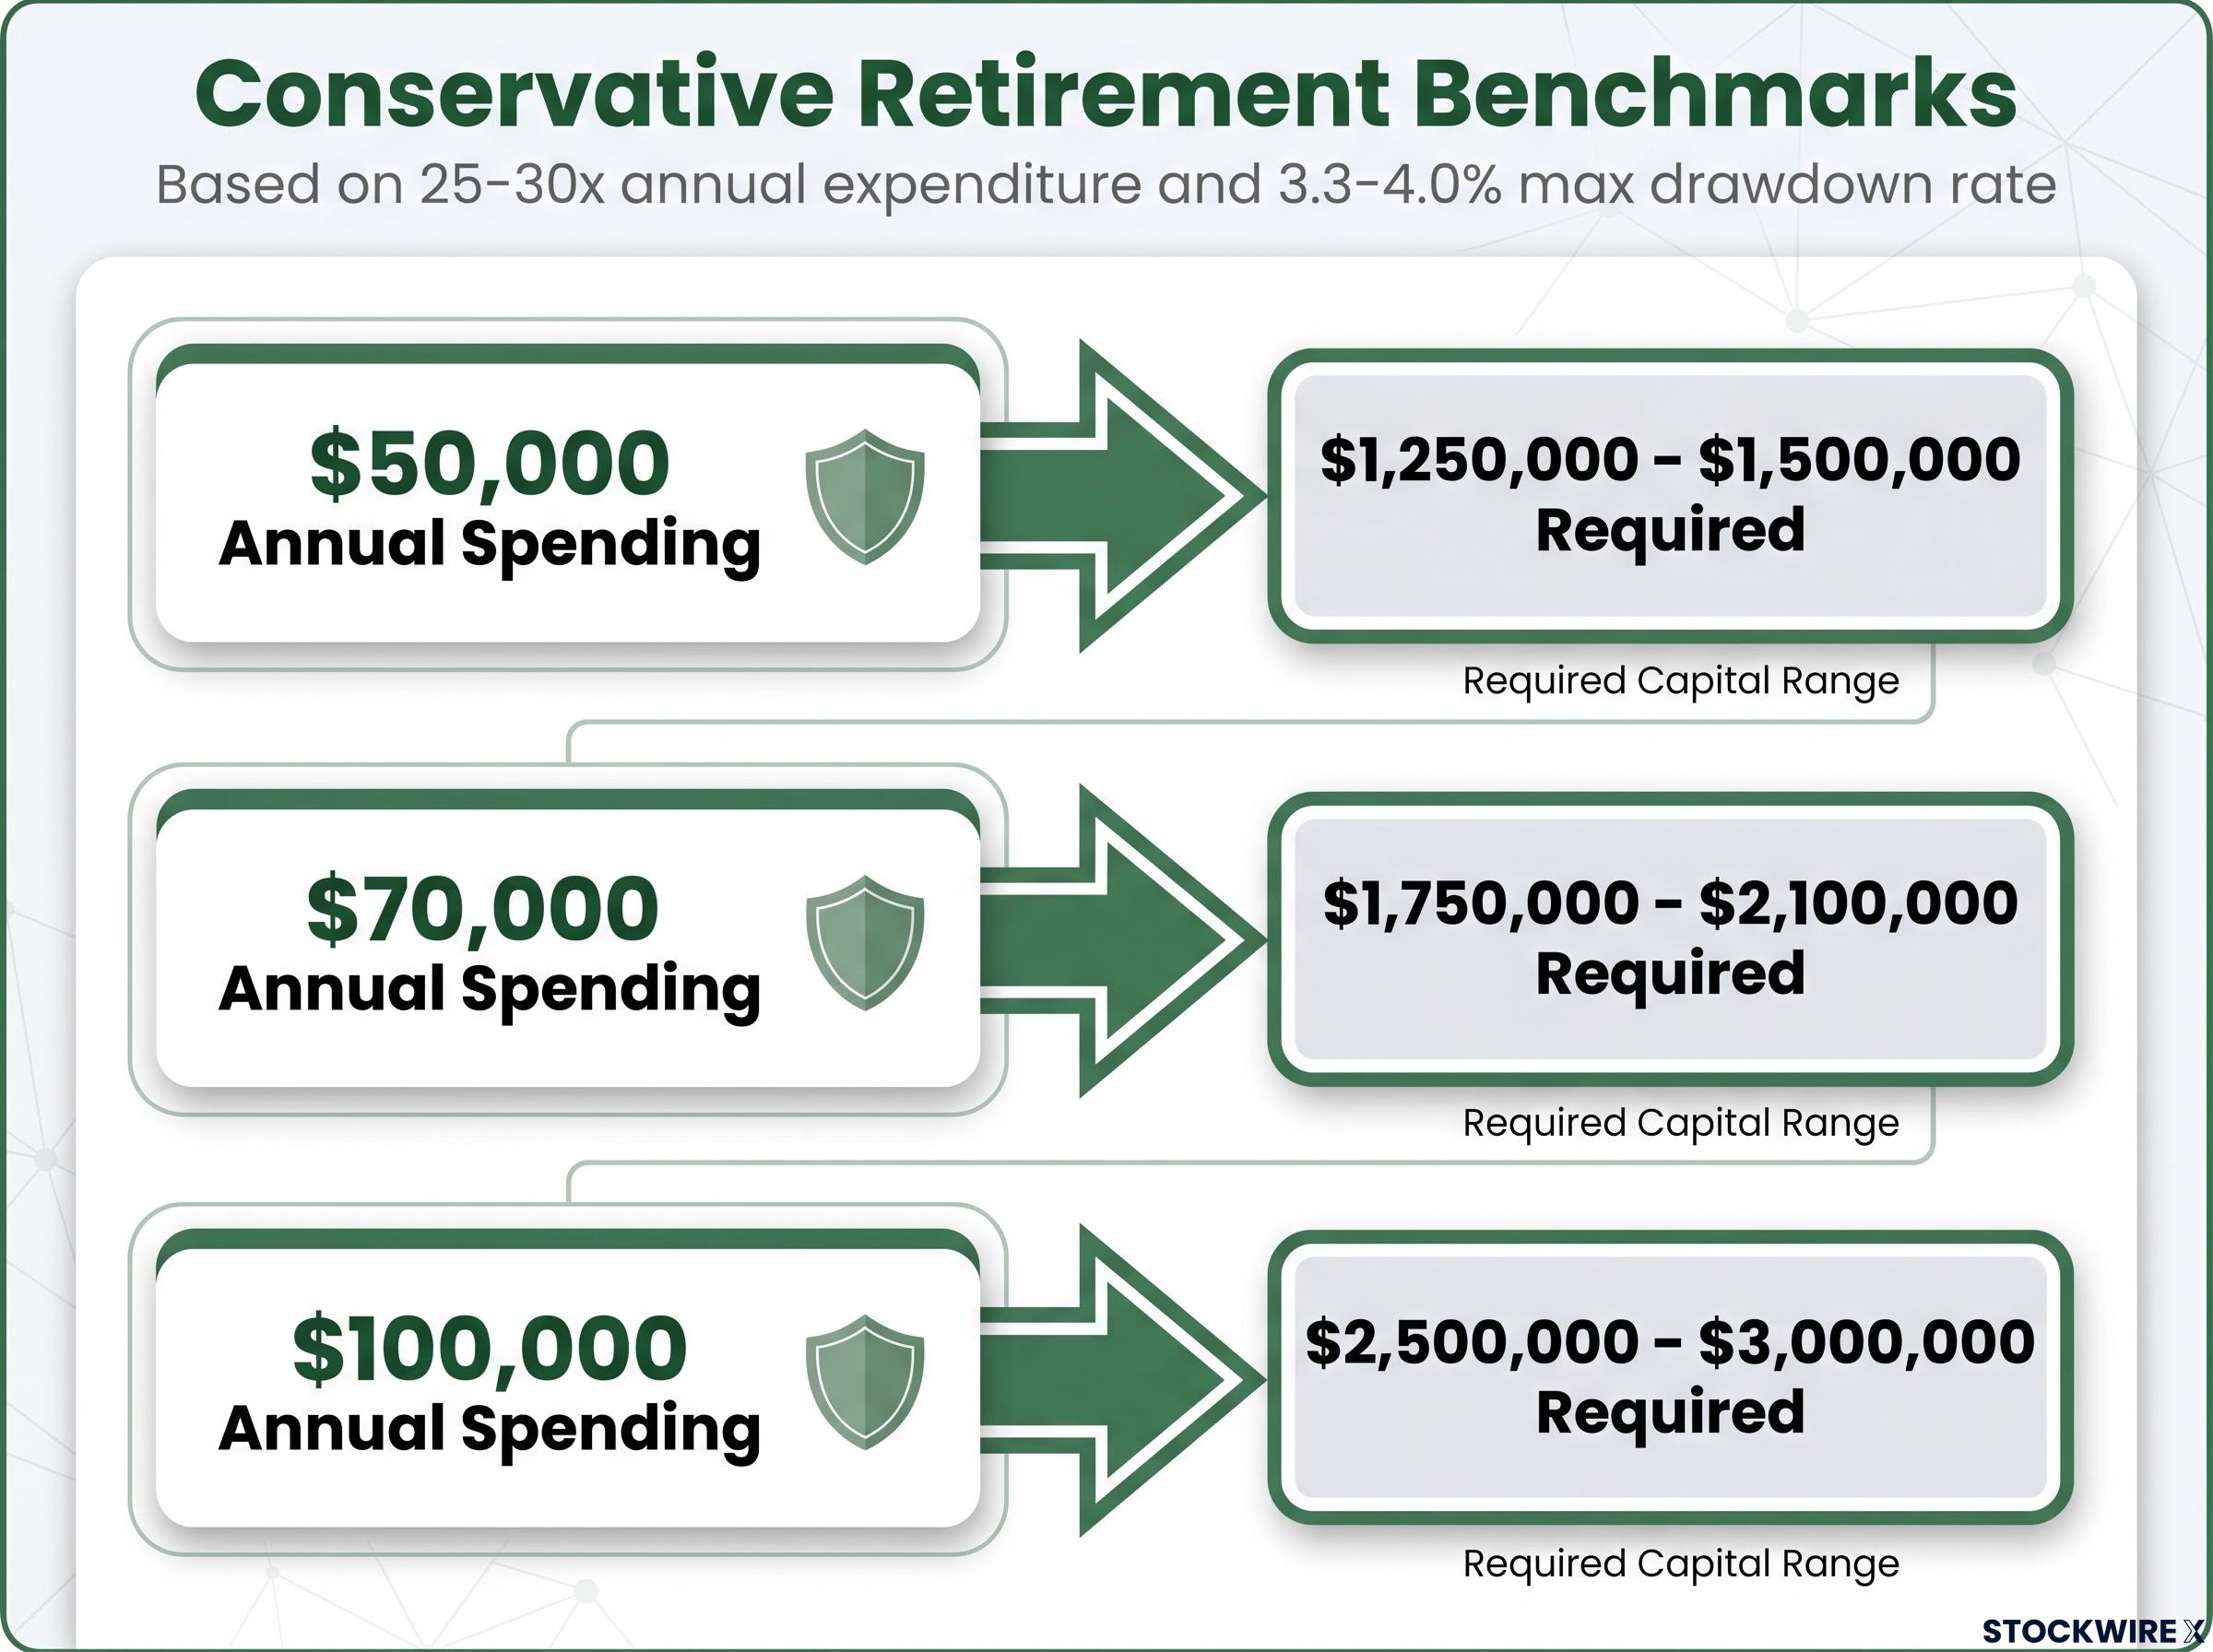
Ashley Owen CFA (OwenAnalytics, published via Morningstar Australia, 8 June 2026) applies a capital-to-spending multiple of 25-30 times annual expenditure, equivalent to a maximum drawdown rate of 3-4% of the investment portfolio. The rationale is straightforward: by the time shortfalls in projected returns become apparent, the practical options available to retirees, such as returning to employment or materially reducing expenditure, may no longer be viable. The cost of being too conservative is working or saving slightly longer. The cost of being too optimistic is running out of money in retirement.
| Annual Spending Target | Capital Required at 25x | Capital Required at 30x | Equivalent Max Drawdown Rate |
|---|---|---|---|
| $50,000 | $1,250,000 | $1,500,000 | 3.3-4.0% |
| $70,000 | $1,750,000 | $2,100,000 | 3.3-4.0% |
| $100,000 | $2,500,000 | $3,000,000 | 3.3-4.0% |
Where within the 25-30 times range an individual should sit depends on four factors:
Retirement asset allocation frameworks built on simple age-based heuristics, such as the 100 minus age rule, systematically underweight equities for retirees facing 30-35-year horizons, and the same researchers who quantified sequence-of-returns risk, Kitces and Pfau, now advocate a rising equity glide path after age 75 to counteract the long-run purchasing power erosion that a fixed conservative allocation produces.
Treasury’s Retirement Income Review (July 2020) recommends flexible, dynamic drawdown rules, adjusting withdrawals to portfolio performance, rather than a static constant-dollar withdrawal. APRA’s Prudential Practice Guide SPG 530 reinforces this, emphasising that trustees should conduct scenario analysis and stress-testing against lower-return environments.
Treasury’s Retirement Income Review, finalised in November 2020, examined the full spectrum of withdrawal strategies for account-based pensions and found that static constant-dollar drawdown rules increase the risk of premature depletion, particularly when actual returns fall short of historical averages.
This section provides general information only and does not constitute personal financial advice. Individual circumstances vary, and readers should consult a licensed financial adviser for guidance tailored to their situation.
The argument running through this guide reduces to a single observation: historical super fund returns are a record of conditions that no longer exist, not a reliable forecast of conditions for the next 30 years. The disinflation era produced returns that were structurally amplified. Those returns are now embedded in the performance tables that most Australians use as their planning baseline.
The arithmetic of compound interest in superannuation means that return assumptions embedded at the planning stage have an outsized effect on terminal balances, with even a 1-2 percentage point difference in assumed annual returns producing dramatically different outcomes over a 30-year accumulation window.
Conservative benchmarks, a 3-4% maximum drawdown rate and 25-30 times annual expenditure in capital, are not pessimistic. They are calibrated to an environment where interest rates are not falling from 10% to 2%, where valuations already reflect decades of re-rating, and where inflation sits at 2.9% rather than trending toward zero. A plan built on these figures has a realistic chance of delivering. A plan built on 7-8% perpetual returns does not.
Three concrete next steps follow:
ASIC, APRA, the RBA, and Treasury all reinforce the same message: do not extrapolate disinflation-era returns. Younger Australians who adjust their planning benchmarks now, before retirement, still have time to act. Those who discover the problem in retirement face far fewer corrective options.
This article is for informational purposes only and should not be considered financial advice. Investors should conduct their own research and consult with financial professionals before making investment decisions. Past performance does not guarantee future results. Financial projections are subject to market conditions and various risk factors.
Sequence-of-returns risk is the danger that poor investment returns arriving early in retirement permanently reduce your capital base, because ongoing withdrawals prevent full recovery. During the GFC, Australian super balances fell 20-30% and the ASX 200 took approximately 11 years to reclaim its peak, meaning retirees who kept drawing down absorbed losses far exceeding the initial crash.
The 7.8%-8.1% per annum returns shown in most super fund performance tables were generated during a four-decade disinflation era, when falling interest rates simultaneously boosted bond prices, equity valuations, and property prices. That structural tailwind has ended, and APRA, the RBA, and Treasury have all cautioned against simply extrapolating these figures into future projections.
Conservative planning benchmarks recommend accumulating 25-30 times your annual spending target, which is equivalent to a maximum drawdown rate of 3-4% per year. For example, a retiree spending $70,000 per year should target between $1,750,000 and $2,100,000 in invested capital.
Even moderate inflation at 2.5-3% per annum significantly erodes the purchasing power of a fixed nominal income stream over a 25-30 year retirement. Australia's 1970s and early 1980s stagflation period showed that real returns on cash and bonds can turn negative, hollowing out the real value of fixed incomes for retirees who planned on earlier growth-era assumptions.
APRA, ASIC, and Treasury recommend three concrete actions: obtain a super fund projection that uses a lower-return scenario rather than the fund's historical average, cross-check the accumulation target against the 25-30 times annual spending multiple, and consult a licensed financial adviser for personalised guidance. Treasury's Retirement Income Review also advocates flexible, dynamic drawdown rules that adjust to actual portfolio performance.