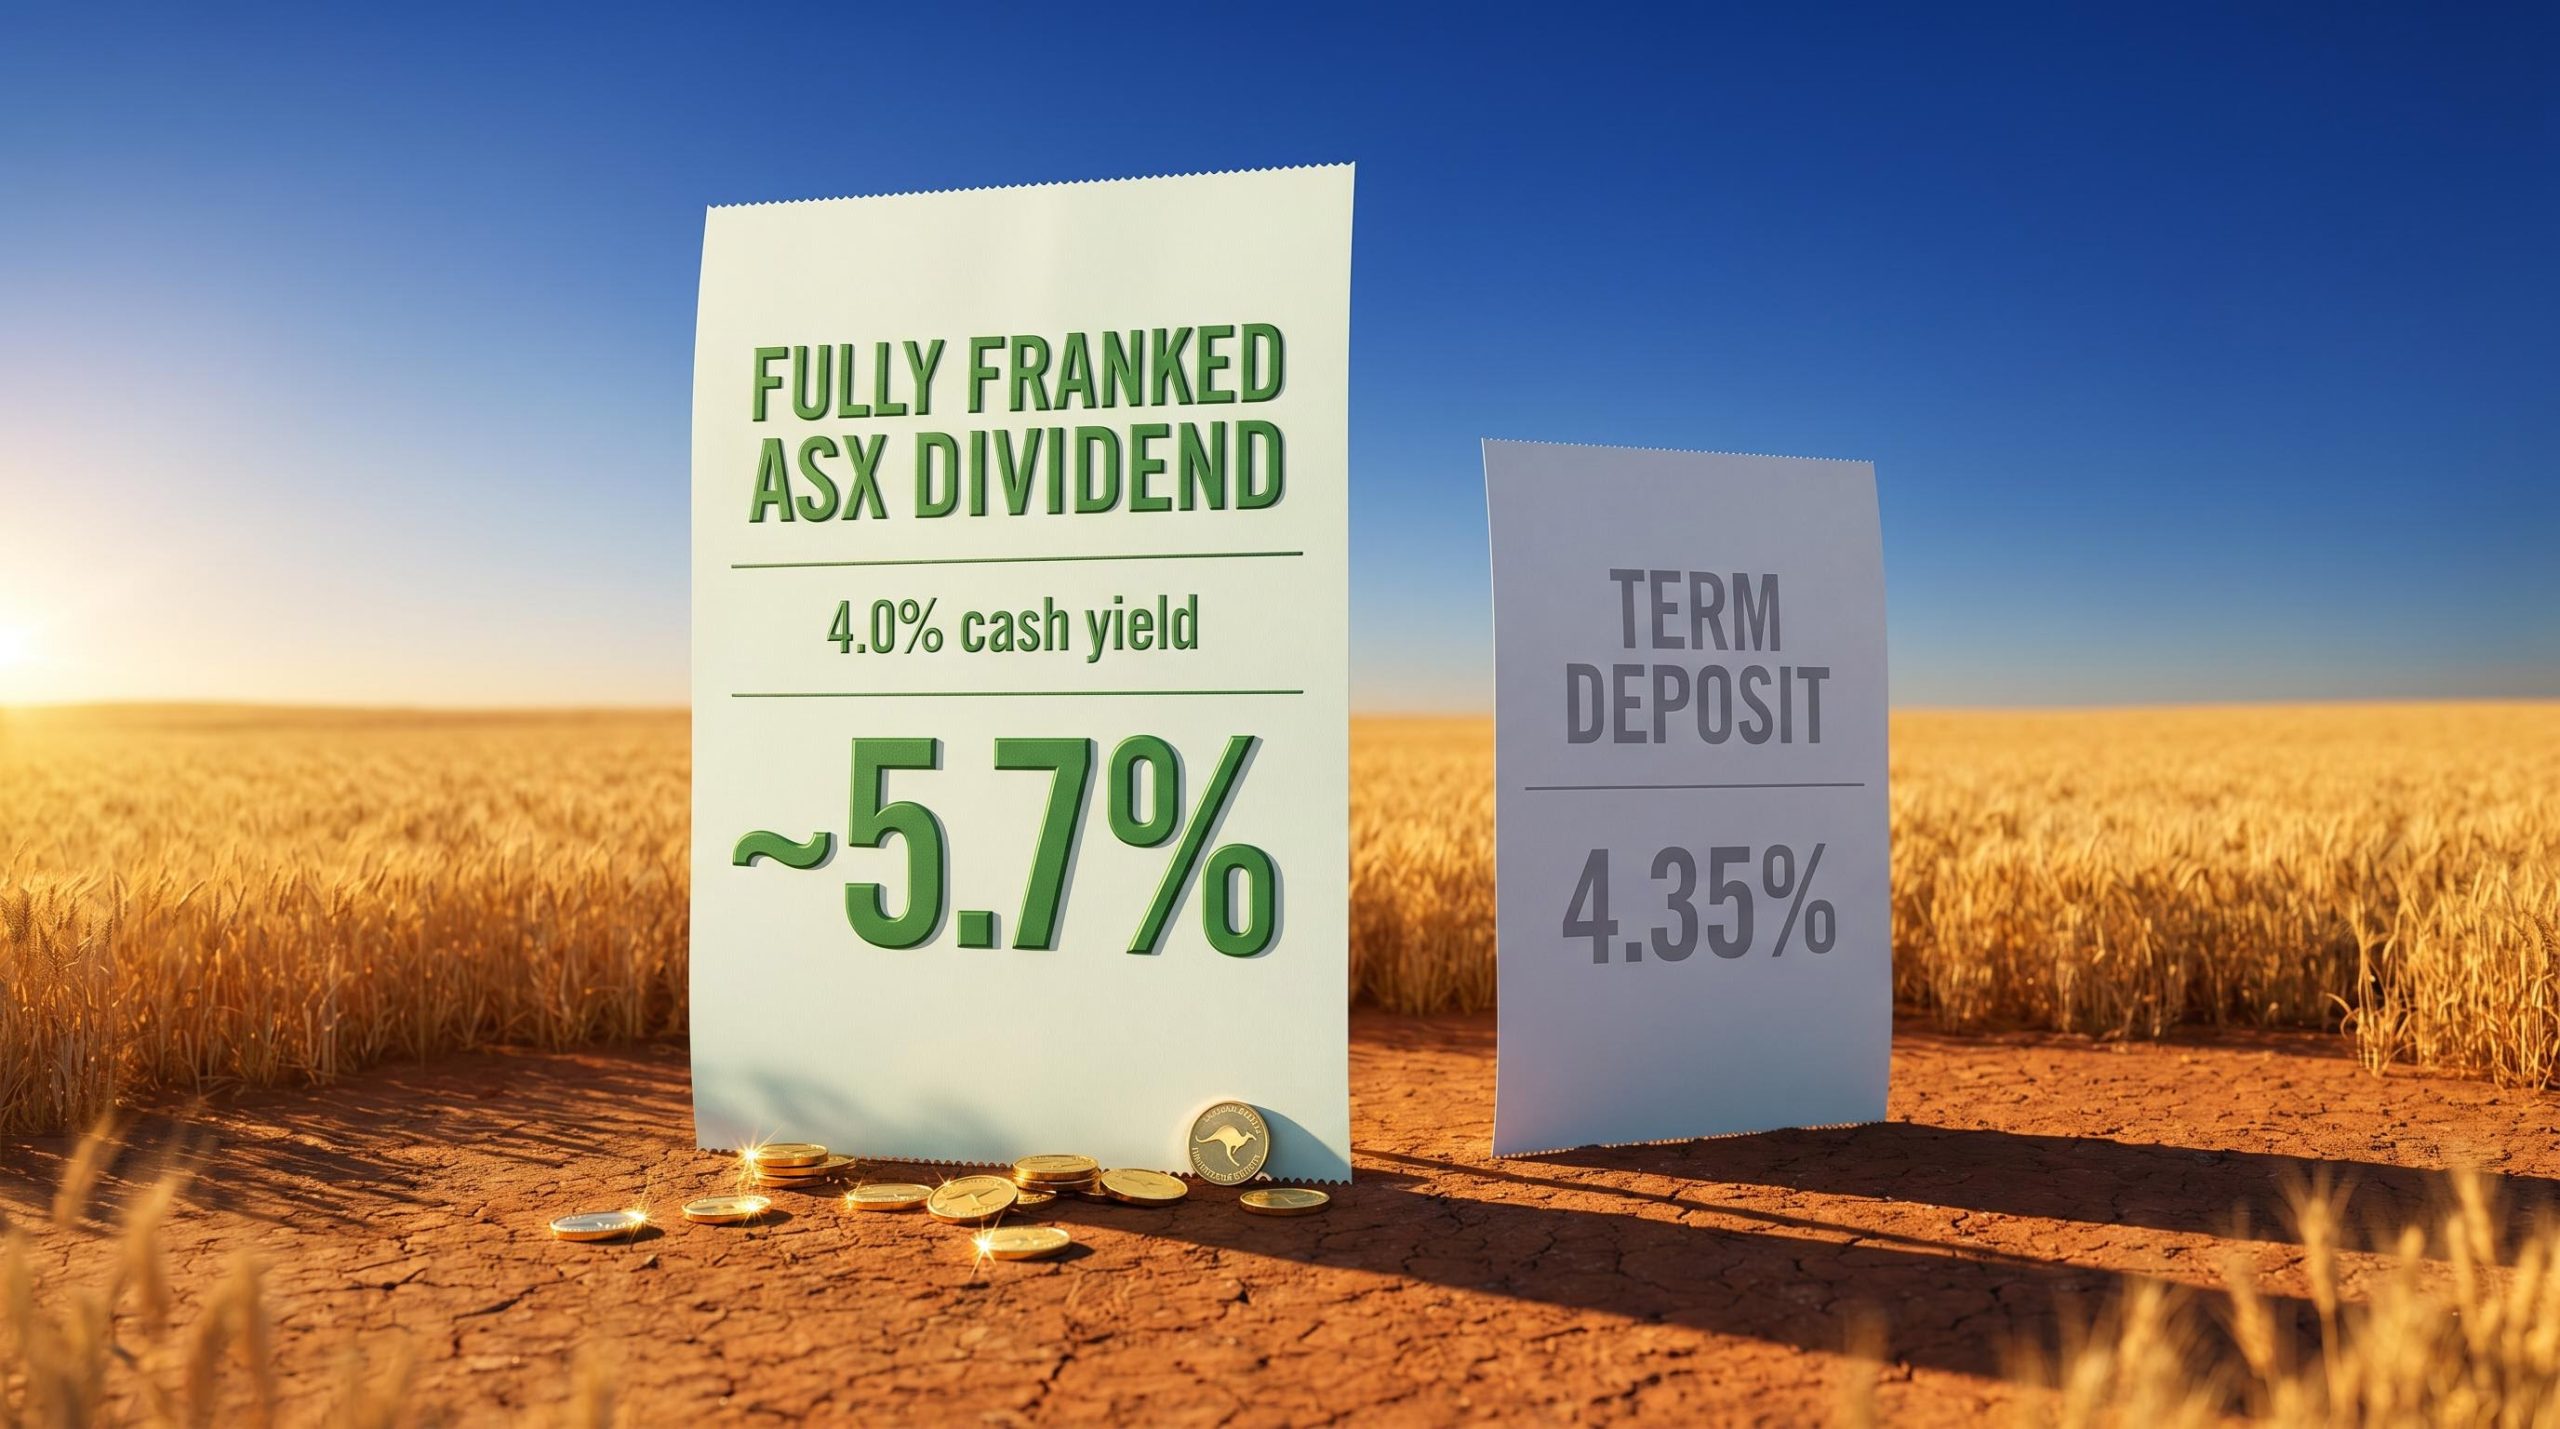
With the Reserve Bank of Australia (RBA) cash rate sitting at 4.35% as of May 2026 and the Board explicitly refusing to commit to any future direction, Australian income investors face a genuine strategic question: does the share market still make sense as an income engine when term deposits are paying competitive rates again? The answer depends on a calculation most comparisons get wrong. Australia’s dividend imputation system gives shareholders a structural after-tax advantage that deposit accounts cannot replicate, and that advantage is frequently underweighted in headline yield comparisons. The question is not simply what pays more today, but what builds a sustainable, growing income stream over time.
This guide explains how to construct a passive income strategy using ASX-listed securities, how franking credits lift effective returns beyond headline cash yields, what vehicles are available and how they differ, and what portfolio construction principles matter most in the current rate environment.
Why Australian investors hold a structural income advantage most comparisons miss
The comparison that brings most readers here looks straightforward: a term deposit paying roughly 4.35% versus an ASX dividend yield of, say, 4%. On those numbers, the deposit wins. But those numbers are wrong, or at least incomplete.
When an Australian company pays a fully franked dividend, the shareholder receives the cash payment plus a franking credit representing the 30% corporate tax already paid on that profit. That credit can be used to offset personal income tax, or, for eligible low-tax investors, generate a cash refund. The effect is that the shareholder’s pre-tax equivalent return is materially higher than the headline cash yield suggests.
The honest comparison requires grossing up the dividend yield. A 4% fully franked cash yield translates to an approximately 5.7% pre-tax equivalent once the franking credit is included. Against a 4.35% term deposit, the arithmetic shifts considerably.
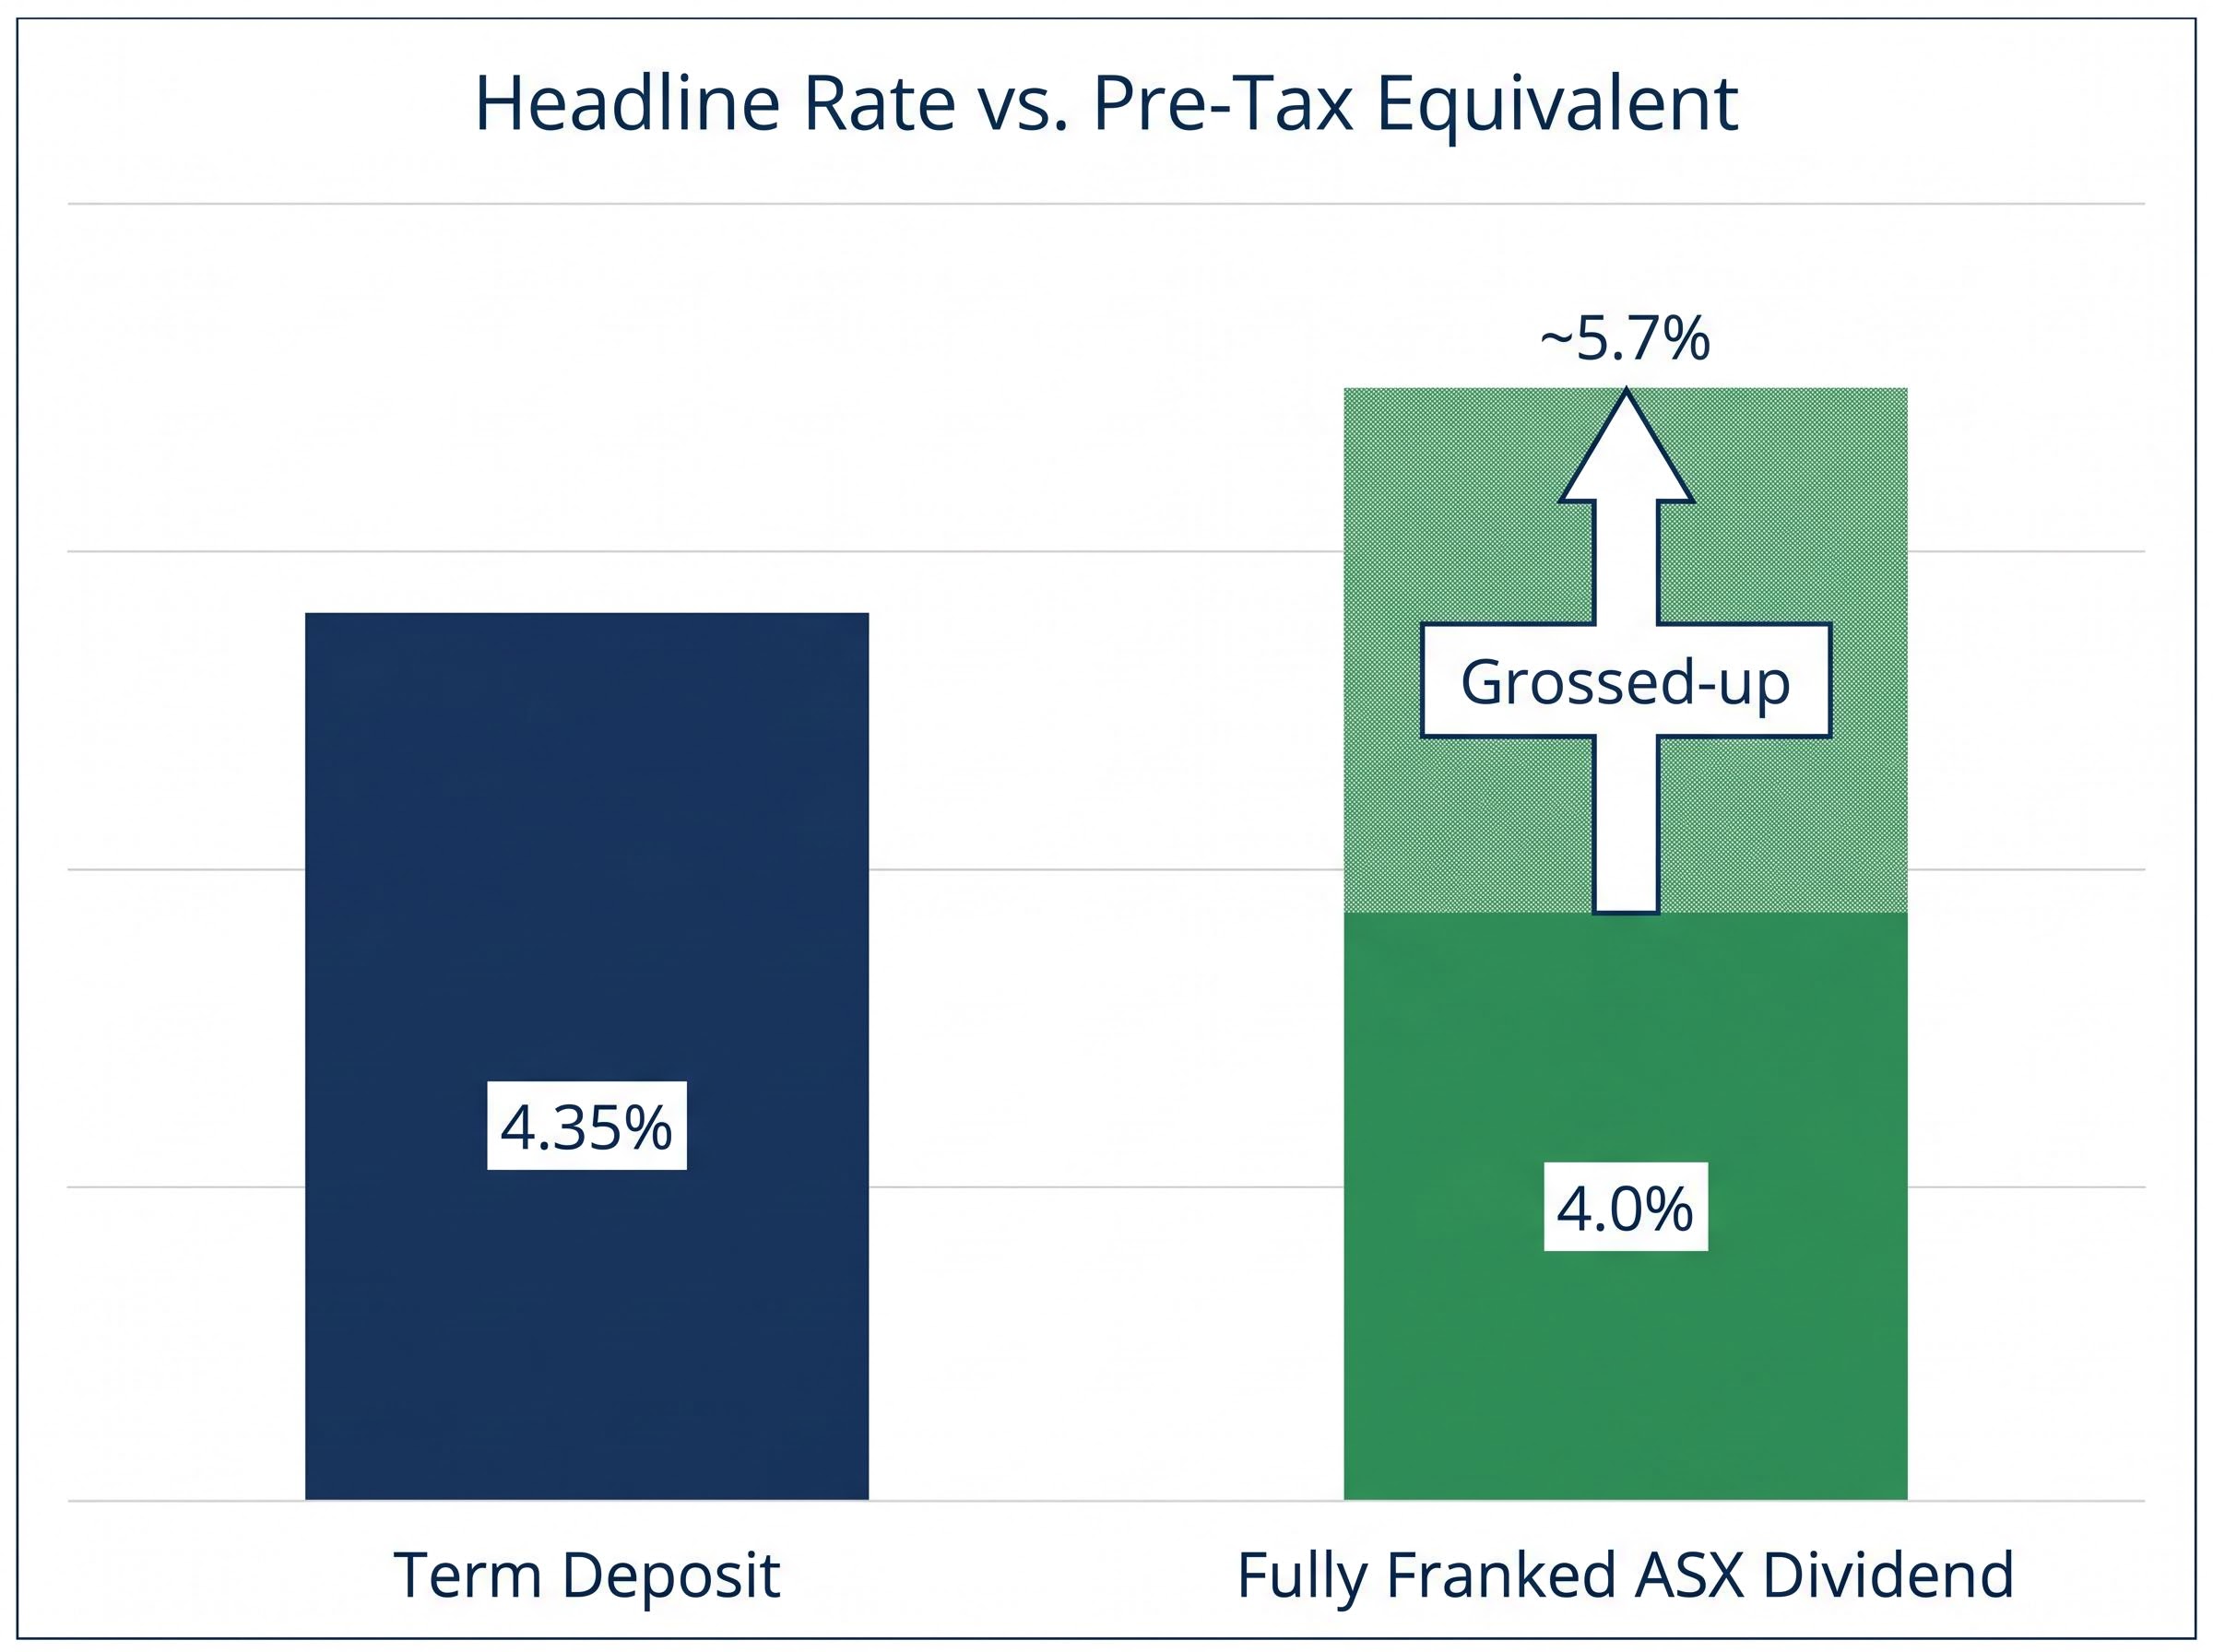
| Income Source | Headline Rate / Yield | Pre-Tax Equivalent |
|---|---|---|
| Fully franked ASX dividend | 4.0% cash yield | ~5.7% (grossed up) |
| Term deposit (at RBA cash rate) | 4.35% | 4.35% |
This does not mean equities are automatically superior. They carry capital risk that deposits do not. But any investor comparing the two without adjusting for franking is making an apples-to-oranges assessment that understates the ASX income advantage.
The RBA Board has stated it is “not on a pre-set path,” remaining data-dependent on inflation, the labour market, and economic activity. The deposit rate outlook is genuinely uncertain heading into the second half of 2026.
That uncertainty cuts both ways. Term deposit rates could fall if the RBA eases, eroding the deposit income stream. Or rates could rise further. The franking credit advantage, by contrast, is structural: it exists at any rate level, provided the company pays tax and franks its dividend.
When big ASX news breaks, our subscribers know first
The mechanics of dividend imputation and what a franking credit is actually worth
Many Australian investors know that franking credits are valuable. Fewer can explain precisely how the tax offset works or what it means for their specific tax position. This section walks through the mechanics from the ground up.
How franking credits are calculated
The dividend imputation system operates in three steps:
- The company pays corporate tax at 30% on its profits before distributing dividends to shareholders.
- The company attaches a franking credit to the dividend, representing the tax already paid. A fully franked dividend carries the maximum credit.
- The shareholder includes both the cash dividend and the franking credit in their assessable income, then offsets the credit against their personal tax liability.
The gross-up formula is straightforward. Divide the cash dividend by 0.70 (that is, 1 minus the 30% corporate tax rate) to calculate the grossed-up dividend.
A worked example: an investor receives a $0.70 fully franked cash dividend per share. The attached franking credit is $0.30 (representing the tax already paid at the corporate level). The grossed-up dividend, the amount included in assessable income, is $1.00 per share. The investor then claims the $0.30 credit against whatever personal tax they owe on that income.
Who benefits most from franking credits
The value of a franking credit depends entirely on the investor’s marginal tax rate.
A high-income earner on the top marginal rate pays significantly more tax than the 30% corporate rate, so the franking credit partially offsets their liability but does not eliminate it. The credit still reduces the effective tax on the dividend income.
A middle-income earner whose marginal rate sits closer to 30% may find the franking credit offsets nearly all the additional tax on the dividend, leaving the distribution close to tax-free in their hands.
Self-managed super fund (SMSF) trustees in retirement pension phase face a 0% tax rate. Under current law, they receive the full franking credit as a cash refund from the Australian Taxation Office. For these investors, a fully franked dividend is worth materially more than the cash payment alone.
Not all ASX companies pay fully franked dividends. Resource companies with significant offshore earnings and international ETFs often pay partially franked or unfranked distributions. Franking level is a meaningful selection variable when building an income portfolio, not a minor footnote.
Three vehicles for ASX passive income and how they differ
Australian income investors have three primary vehicles available on the ASX, and each carries a distinct risk and income profile. A thoughtful income strategy may use all three rather than treating them as interchangeable.
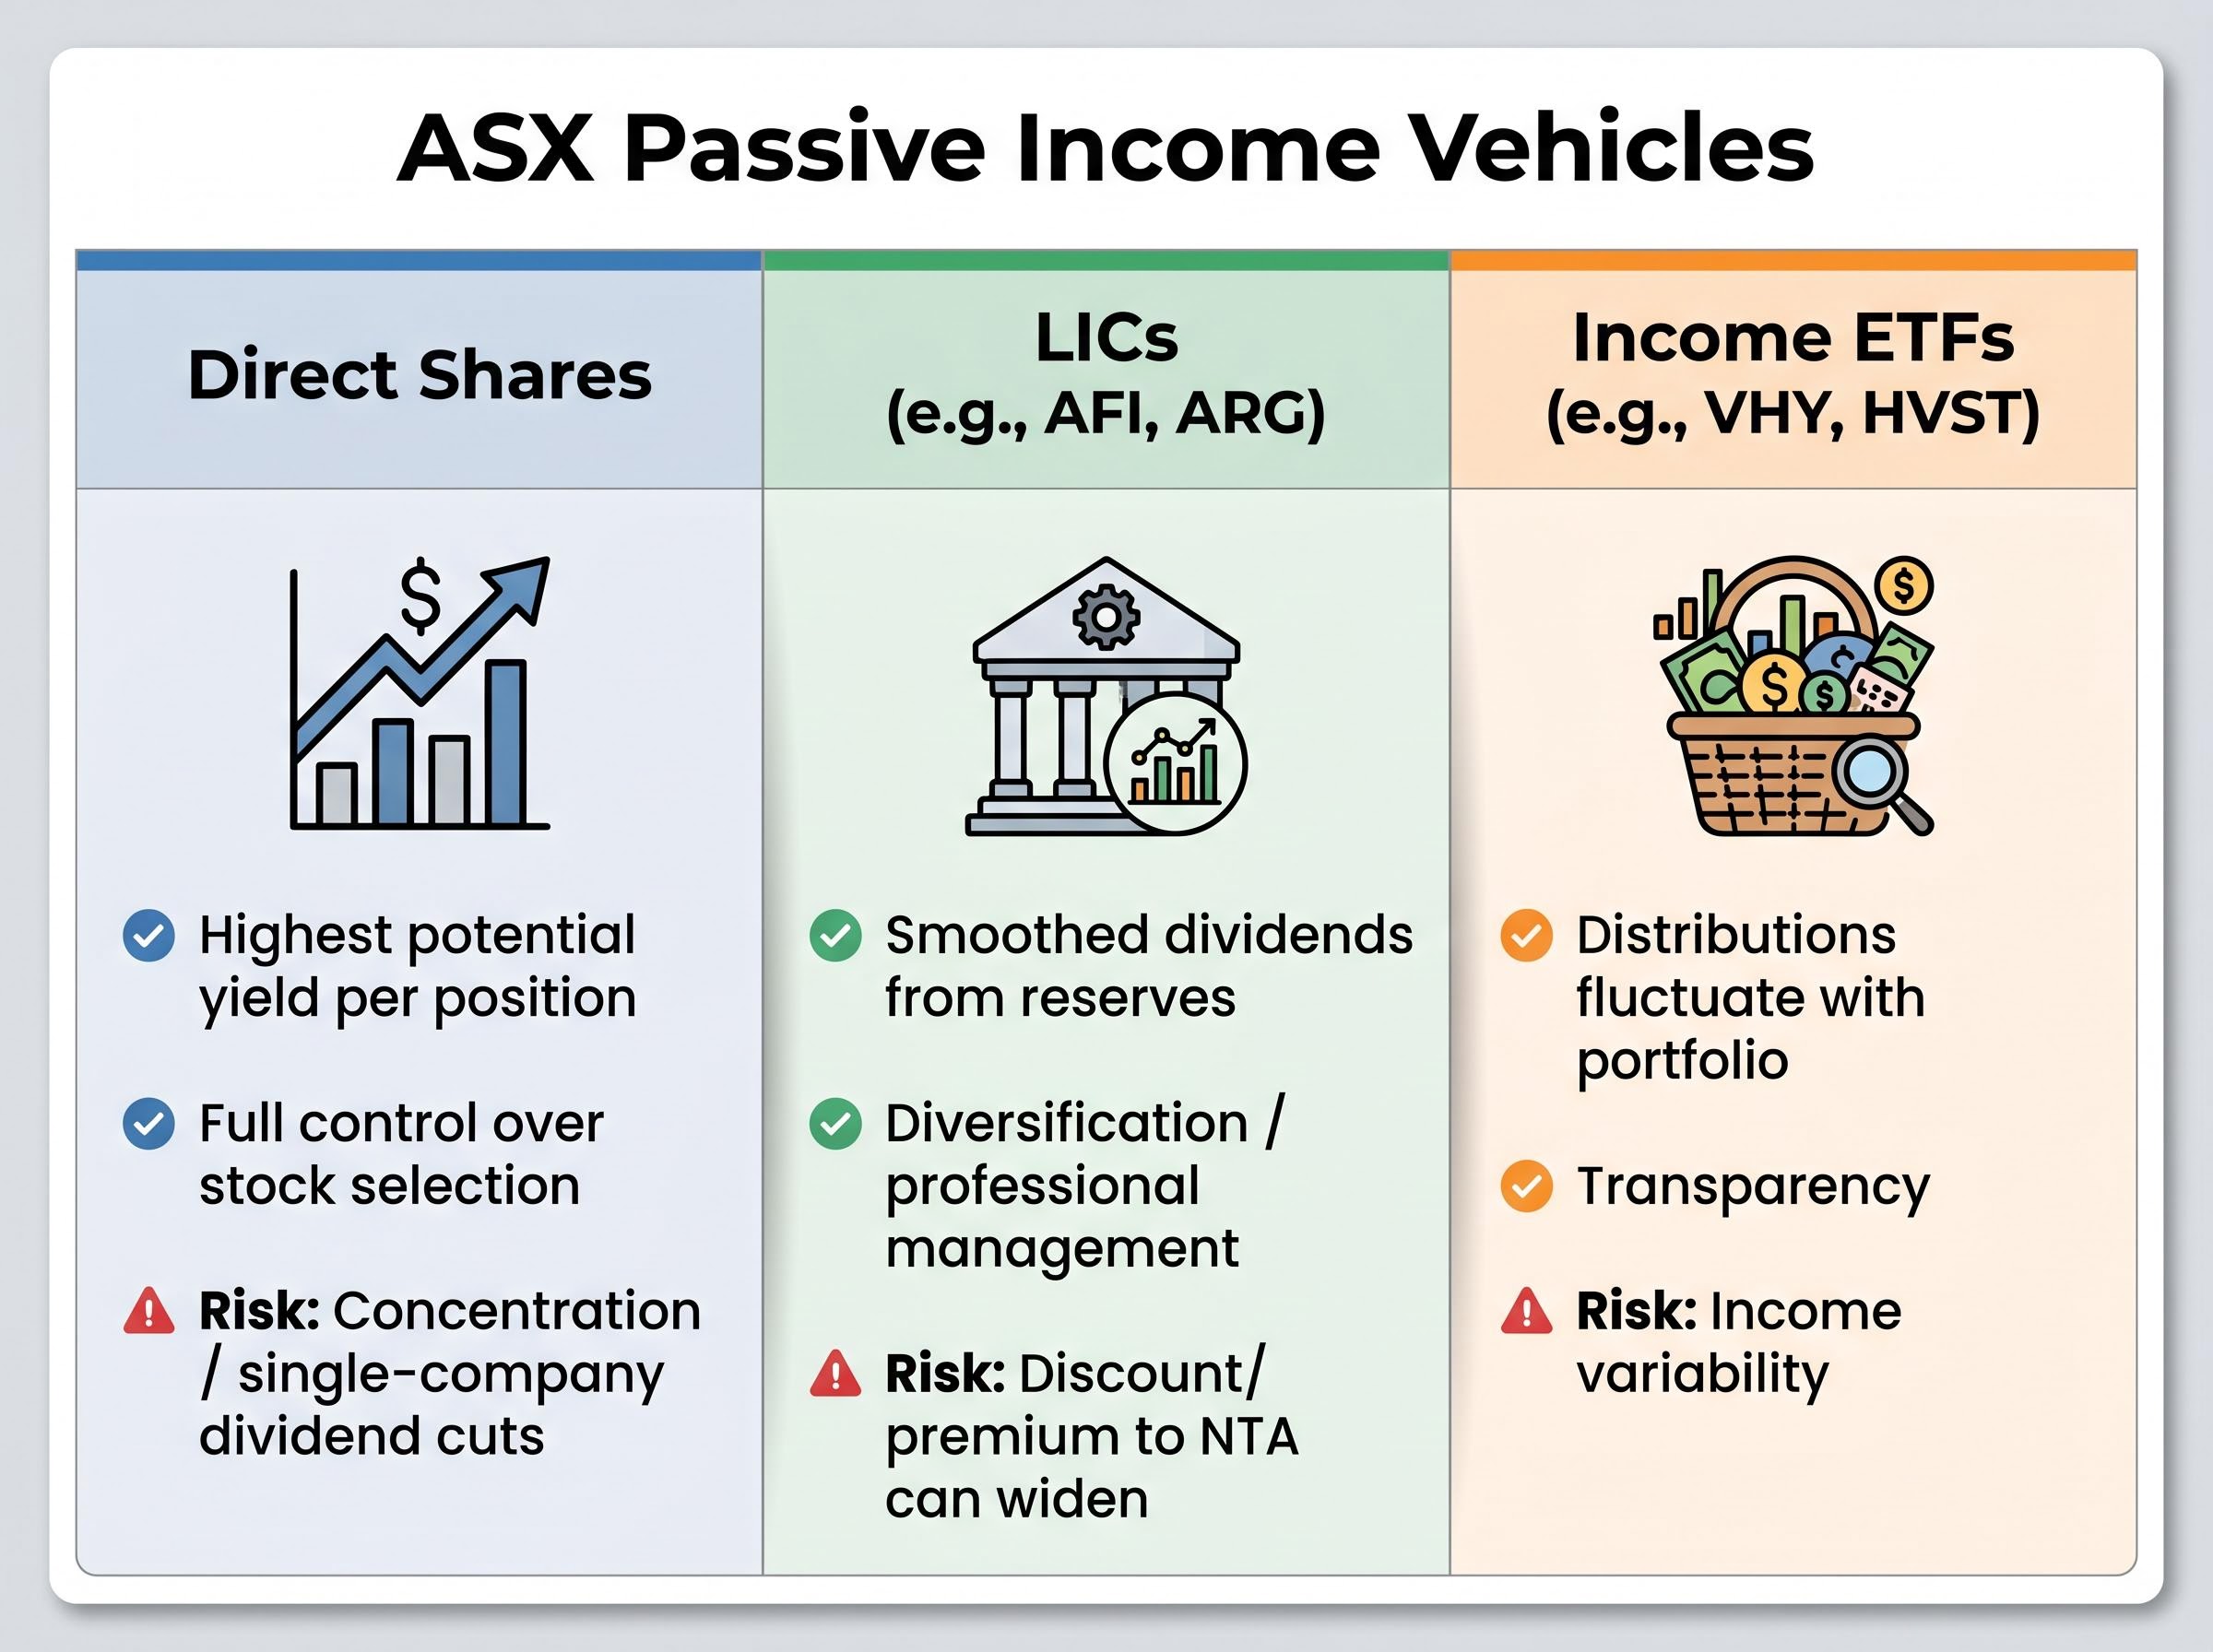
Direct shares offer the highest yield potential for investors willing to select individual companies. A concentrated position in a high-yielding stock delivers the most income per dollar invested, but also the highest concentration risk. If that company cuts its dividend, the income impact is immediate and significant. Direct shares require ongoing company research and monitoring.
Listed investment companies (LICs) hold diversified portfolios of Australian equities, managed by professional teams. Established LICs such as Australian Foundation Investment Company (ASX: AFI) and Argo Investments (ASX: ARG) have long track records of consistent, fully franked dividends. LICs can smooth dividends from profit reserves, paying steady distributions even when underlying portfolio income fluctuates. They trade on the ASX at prices that may sit at a discount or premium to their net tangible assets (NTA). When a LIC trades at a 5% discount to NTA, the buyer effectively acquires the underlying portfolio below market value, enhancing income yield on the purchase price.
Income-focused ETFs offer passive or rules-based exposure to high-yielding ASX stocks. Vanguard Australian Shares High Yield ETF (VHY) and BetaShares Australian Dividends Harvester Fund (HVST) are two examples. ETFs do not trade at a discount or premium to their underlying assets in the way LICs do, but their distributions fluctuate directly with portfolio income. Distribution frequency varies by fund: monthly, quarterly, or half-yearly. Investors relying on regular income should check current product disclosure statements (PDSs) from the issuer directly.
Readers should verify current yield figures, franking levels, and distribution policies via ASX announcements and issuer PDSs before making any investment decision.
| Vehicle Type | Income Characteristic | Key Advantage | Key Risk |
|---|---|---|---|
| Direct Shares | Highest potential yield per position | Full control over stock selection | Concentration risk; single-company dividend cuts |
| LICs (e.g., AFI, ARG) | Smoothed dividends from reserves | Diversification; professional management | Discount/premium to NTA can widen |
| Income ETFs (e.g., VHY, HVST) | Distributions fluctuate with portfolio | Transparency; no discount/premium mechanics | Income variability; no dividend smoothing |
When evaluating LICs specifically, consider the following selection factors:
- Current discount or premium to NTA
- Dividend reserve history and coverage
- Management fees relative to peers
- Franking level of recent distributions
Portfolio construction principles for a resilient ASX income stream
Selecting the right individual securities matters less than assembling them correctly. A portfolio full of high-yielding stocks drawn from a single sector is not an income strategy; it is a concentrated dividend bet.
Sector diversification for consistent income
Income concentration in a single sector is the primary structural risk in ASX income portfolios. According to Rask Invest research, Australian major bank stocks collectively represent over one-third of the ASX 200 by market capitalisation. An income portfolio tilted heavily toward the four major banks carries correlated dividend risk: if a macroeconomic shock forces one bank to cut its dividend, the others are likely to face similar pressures simultaneously.
Spreading exposure across sectors with historically strong dividend cultures reduces this risk:
- Financials: The largest source of fully franked dividends on the ASX, but dividends are tied to credit cycle conditions and regulatory capital requirements.
- Resources: Often high-yielding during commodity upswings, but dividends are more variable and frequently tied to commodity prices; franking levels can be lower for companies with significant offshore earnings.
- Industrials: Tend to offer moderate, steadier dividends supported by contractual revenue streams and domestic demand.
- Infrastructure and property trusts: Provide contractual income structures (toll roads, rent rolls) that support regular distributions, though these securities carry interest rate duration risk.
Managing rate sensitivity in the current environment
Some income securities, particularly property trusts and infrastructure stocks, carry duration risk. Their valuations are sensitive to interest rate movements because their steady cash flows are valued relative to the risk-free rate. When rates rise, the present value of those cash flows falls, and share prices tend to decline.
With the RBA cash rate at 4.35% and QIC projecting that the RBA may need to raise rates in the December quarter of 2026 if inflation pressures build, this is a live consideration for income portfolio construction. The RBA’s refusal to commit to a pre-set path means income investors cannot assume rates will fall.
Valuation also matters alongside yield when selecting direct shares for income. Analysis of Westpac (WBC), for example, showed earnings per share of $1.92 and a share price of $36.77 as of late May 2026, implying a price-to-earnings ratio of approximately 19.2x versus a sector average of around 18x. Buying an income stock at an elevated valuation reduces the effective yield and increases the risk of capital loss, even if the dividend itself holds steady.
Realistic income targets and the risks that can disrupt them
The arithmetic of ASX income investing is straightforward. The risks are what most guides understate.
Worked income example: A $100,000 portfolio yielding 4.5% cash with full franking produces approximately $4,500 in cash dividends. The franking credits add approximately $1,929 (calculated by grossing up: $4,500 divided by 0.70 equals approximately $6,429, minus the $4,500 cash component). Total grossed-up income: roughly $6,429 before personal tax.
That figure is a reasonable target for a diversified, fully franked ASX income portfolio. It is not guaranteed. Three risks can reduce realised income below projections:
- Dividend cuts by individual companies. Dividends are not fixed obligations. Westpac’s most recent full-year dividend was $1.66 per share (based on available data as of May 2026 analysis), but future dividends are subject to earnings, capital requirements, and board discretion. The COVID-19 period demonstrated that even major bank dividends can be cut or deferred under stress.
- Sector concentration driving correlated cuts. A portfolio overweight to a single sector faces the risk that a sector-wide shock reduces income from multiple holdings simultaneously. This is the practical cost of the bank-heavy income portfolio discussed in the previous section.
- Franking credit policy risk. The current dividend imputation framework has been a qualitative political consideration in prior election cycles. While no specific legislative change is proposed or pending as of May 2026, the possibility of future reforms remains a background risk that income investors should acknowledge.
With term deposits offering competitive rates at the current 4.35% RBA cash rate, the risk premium required to justify equity income exposure is real. Investors should weigh it consciously rather than assume away the capital and income risks inherent in equities.
Past performance does not guarantee future results. Financial projections are subject to market conditions and various risk factors.
The rate environment has changed the income equation, not reversed it
The structural advantages of dividend imputation persist regardless of the rate level. A higher cash rate makes term deposits more competitive than they were during the near-zero rate era, but it does not eliminate the franking credit benefit that lifts ASX income returns above headline yields. The question for income investors in 2026 is not whether the ASX still works as an income source, but whether the portfolio is constructed to capture those advantages reliably.
Three takeaways from this guide:
- Understand grossed-up yield before comparing to deposits. A fully franked dividend yield of 4% equates to approximately 5.7% pre-tax. Any comparison that ignores this overstates the deposit advantage.
- Diversify across vehicles and sectors. Combining direct shares, LICs, and ETFs across financials, resources, industrials, and infrastructure reduces the income concentration risk that a bank-heavy portfolio carries.
- Set realistic income targets and acknowledge disruption risks explicitly. Dividends can be cut, sectors can face correlated pressure, and policy settings can change. An income strategy built on honest arithmetic holds up better than one built on optimistic assumptions.
Income investors should consult current PDSs and ASX announcements for live yield data, and consider seeking personal financial advice before constructing a significant income portfolio.
This article is for informational purposes only and should not be considered financial advice. Investors should conduct their own research and consult with financial professionals before making investment decisions.