
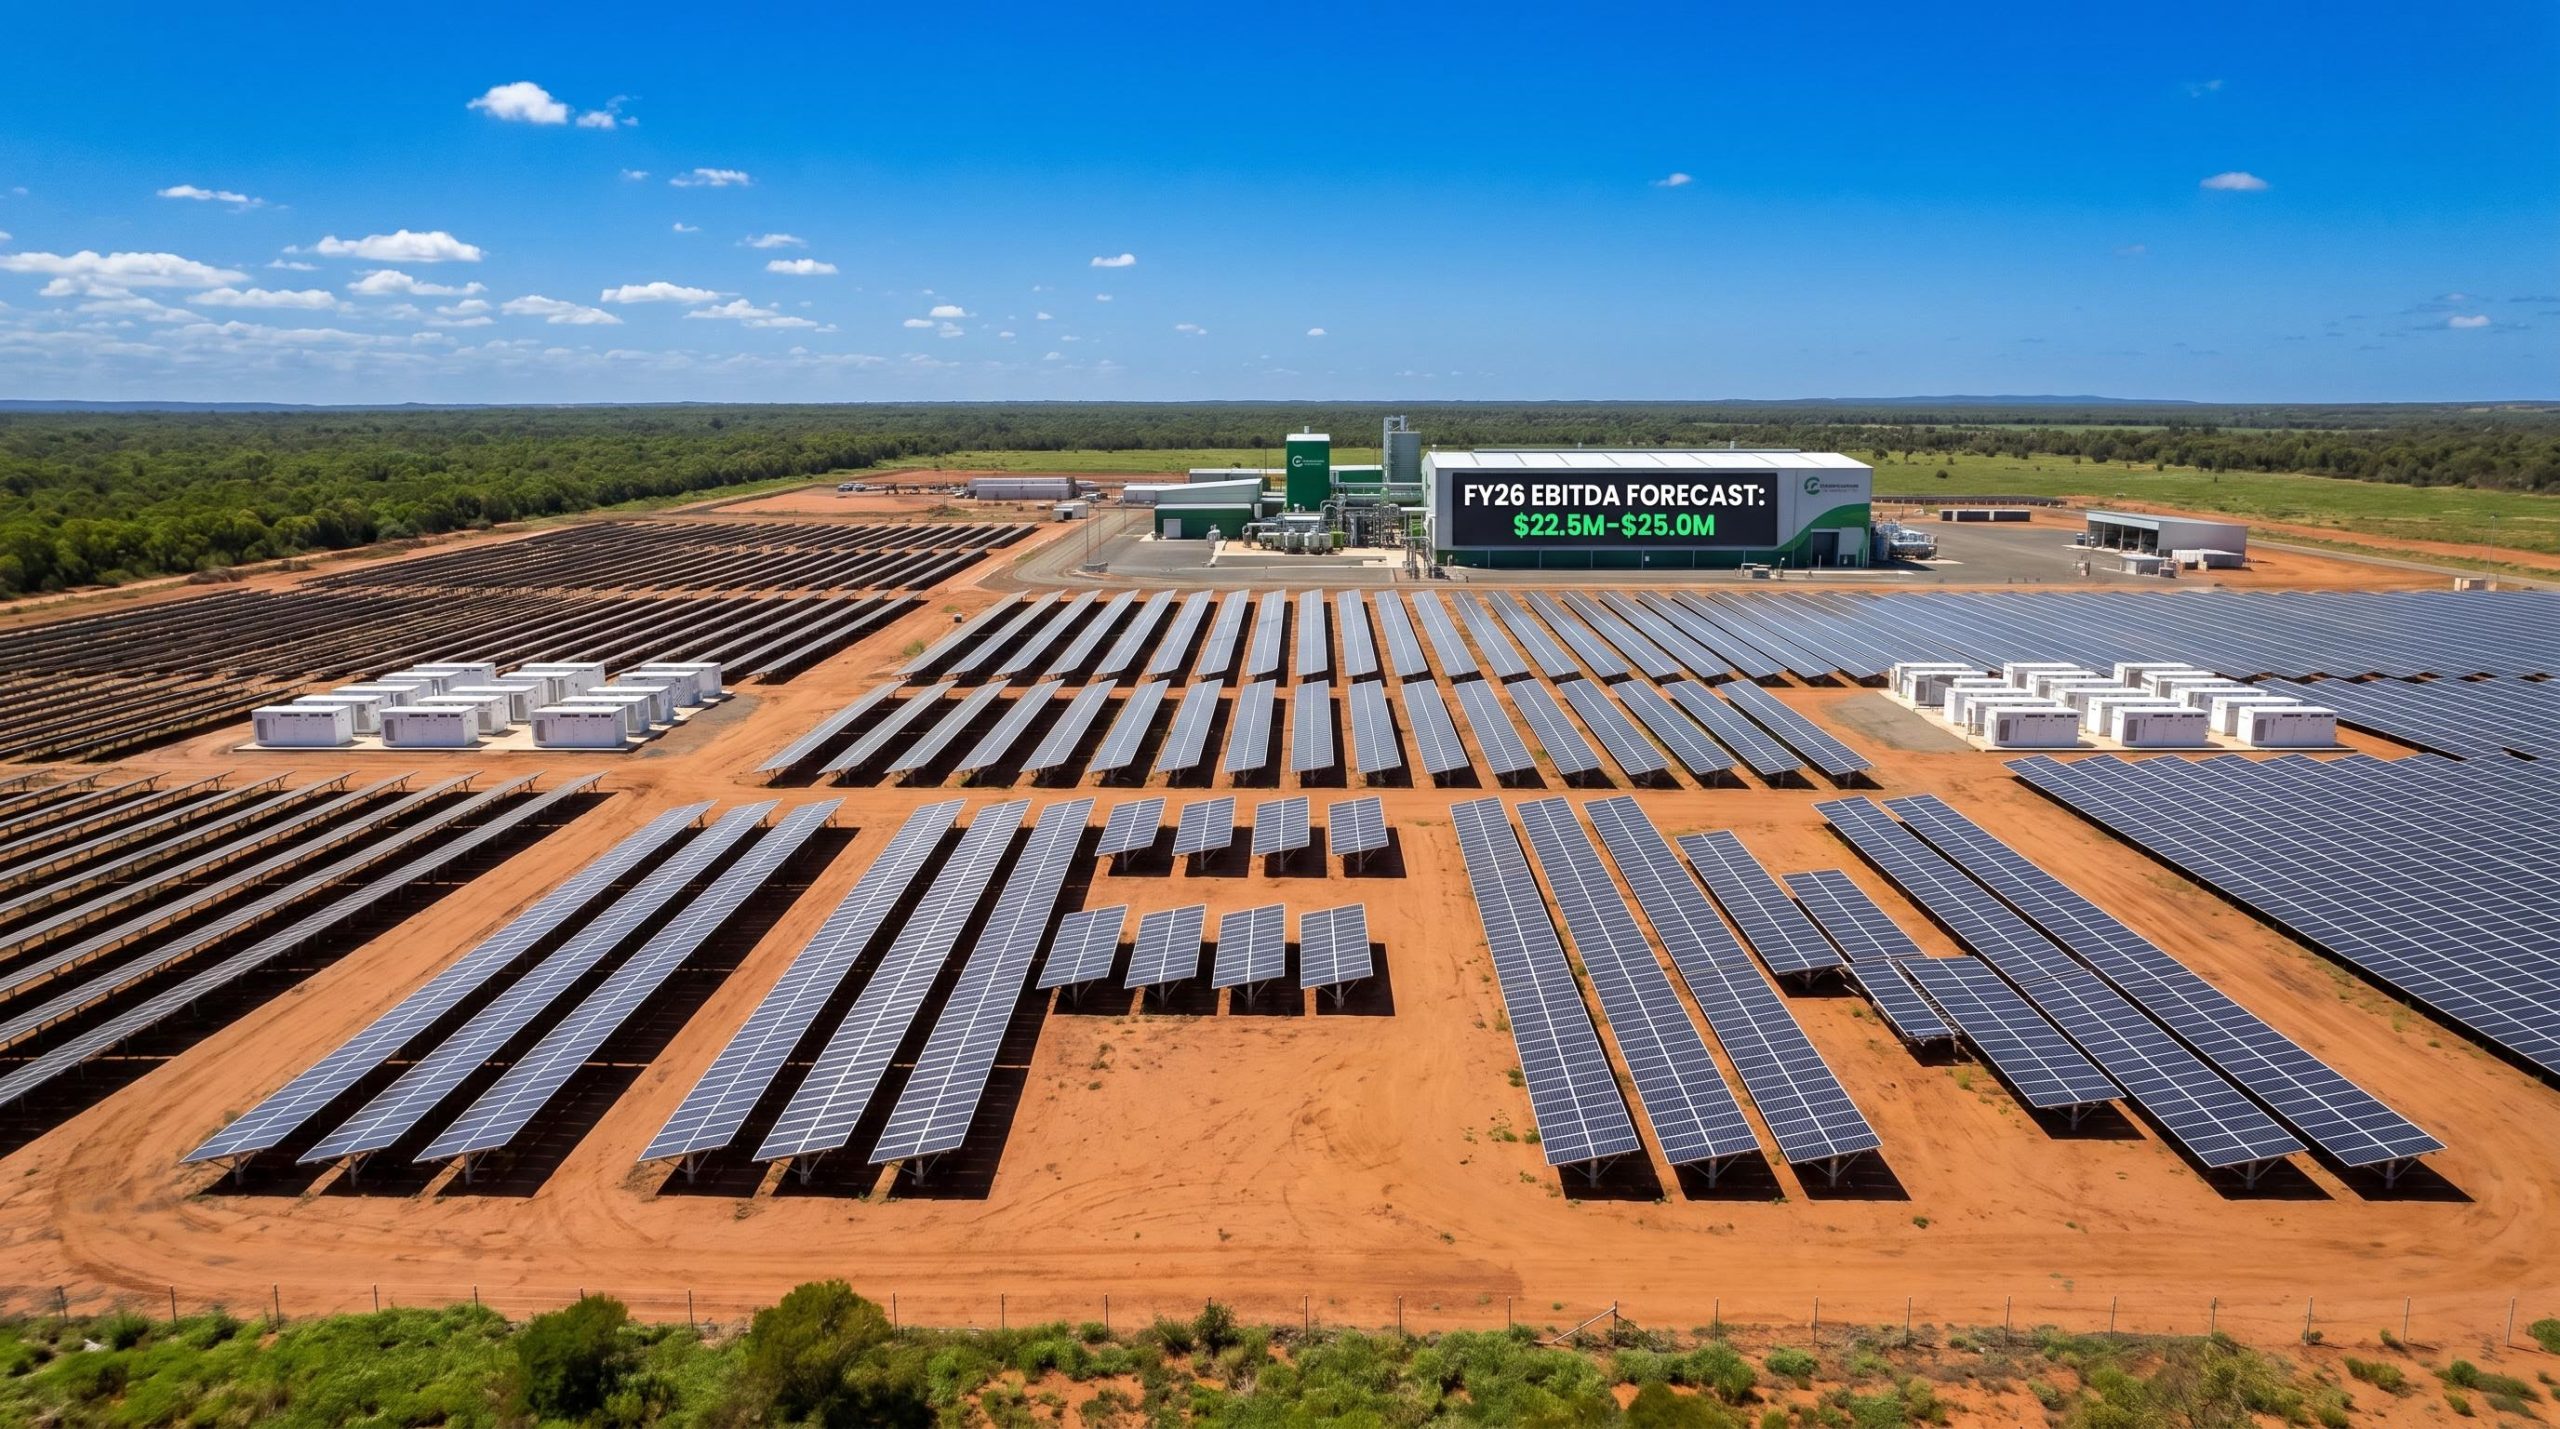
Infragreen Group forecasts underlying EBITDA of up to $25m in FY26 as earnings momentum builds
Infragreen Group Limited (ASX: IFN) has issued FY26 earnings guidance forecasting underlying EBITDA of $22.5m–$25.0m, up 21%–35% on FY25, with underlying NPAT expected to reach $6.3m–$7.3m, representing growth of 277%–336% year-on-year. The result reflects a strong second half performance across the company’s portfolio of infrastructure businesses.
Looking further ahead, IFN has also issued FY27 underlying EBITDA guidance of $26m–$28m, signalling management’s confidence in sustained earnings momentum beyond the current financial year. Full audited results are scheduled for release on or around 27 August 2026.
Infragreen CEO Declan Sherman
“We are pleased by the company’s positive momentum into the second half of FY26 and provide FY27 guidance to our investors.”
When big ASX news breaks, our subscribers know first
FY26 performance at a glance — beating FY25 across all key metrics
The following table compares FY25 actuals against FY26 forecasts and the original IPO prospectus targets across five key financial metrics.
| Metric | FY25 Actual | FY26 Forecast | FY25 vs FY26 Change | FY26 IPO Forecast |
|---|---|---|---|---|
| Underlying Revenue | $93.4m | $113.4m – $120.9m | 21% – 29% | $115.0m |
| Underlying EBITDA | $18.6m | $22.5m – $25.0m | 21% – 35% | $25.0m |
| Statutory NPAT | ($18.0m) | $6.7m – $7.7m | n/a | $9.7m |
| Underlying NPAT | $1.7m | $6.3m – $7.3m | 277% – 336% | $6.8m |
| Dividends from Businesses | $3.0m | $5.3m – $6.5m | 77% – 117% | $5.2m |
Notably, dividends received from IFN’s operating businesses are expected to exceed the original prospectus forecast, with the $5.3m–$6.5m range tracking well above the $5.2m prospectus target.
What’s driving the result — a look inside Infragreen’s four business units
The FY26 earnings story is shaped by diverging performances across IFN’s four operating businesses, with Energybuild and Pure Environmental providing the primary uplift, while Minemet and Merredin Energy face near-term headwinds.
Energybuild — solar and battery installations powering the result
- H2 FY26 sales up 26%–36% on H1, driven by increasing solar and battery system installations
- Free cash flow from operating activities expected to swing from negative $0.5m in FY25 to between $4.0m and $5.0m in FY26
- Continued strong growth in solar and battery system installations is anticipated in FY27
Pure Environmental — hazardous waste volumes and Queensland tailwinds
- H2 FY26 sales up 10%–20% on H1, with free cash flow from operating activities up 130%–150% H2 versus H1
- One small acquisition is completing in H2 FY26
- The Queensland Government’s renewed focus on expanding onshore oil and gas volumes provides a positive medium-term outlook for drill mud volumes in Pure Environmental’s catchment areas
Minemet — near-term headwinds, improving medium-term outlook
- Softer H2 FY26 result, with free cash flow from operating activities down 10%–30% H2 versus H1 due to ferrous export pricing pressure
- Early signs of improving ferrous export prices through April and May suggest a stronger FY27 performance, while non-ferrous prices continue to remain buoyant
- Medium-term outlook is supported by the development of electric arc furnace projects across Australia and New Zealand
Merredin Energy — maintenance timing creates short-term cost pressure
- Slightly lower H2 FY26 EBITDA due to increased operating expenses from maintenance timing
- Free cash flow from operating activities up 5%–15% year-on-year
- A step-up in capacity credit payments is expected from 2032, following the end of the current transitional pricing structure, with pricing set at a level to encourage new generation investment
What EBITDA guidance means for Infragreen investors
Earnings Before Interest, Tax, Depreciation and Amortisation (EBITDA) is a widely used measure of a company’s operating performance. It strips out financing costs, tax obligations, and non-cash charges such as depreciation and amortisation, giving investors a view of how much cash a business generates from its core operations.
IFN uses an “underlying” EBITDA figure, which goes a step further by also removing non-recurring and one-off items, such as acquisition costs or IPO-related expenses. For an infrastructure holding company like IFN, which owns stakes in multiple operating businesses, this metric helps investors assess the ongoing earnings power of the portfolio on a comparable basis from year to year.
Alongside EBITDA, dividends received from IFN’s businesses represent a key cash flow metric. These are the actual cash distributions flowing from the operating subsidiaries up to the parent company, and they directly influence IFN’s capacity to fund its own operations and return capital to shareholders.
The decision to issue FY27 EBITDA guidance of $26m–$28m before FY26 is even complete reflects management’s stated confidence in the growth trajectory. Separately, IFN’s strategic review with Grant Samuel is ongoing, with initial findings expected to be shared with the market later in the week of the 25 May 2026 announcement.
Key investor takeaways:
- FY26 underlying NPAT is forecast to grow 277%–336% year-on-year, reaching $6.3m–$7.3m
- FY27 underlying EBITDA guidance already issued at $26m–$28m
- Business dividends to IFN forecast at $5.3m–$6.5m, up from $3.0m in FY25 and ahead of the prospectus forecast
- Strategic review with Grant Samuel is progressing, with an initial market update expected imminently
- Full-year audited results are scheduled for release on or around 27 August 2026
Stay Ahead on ASX Industrials and Infrastructure News
Get FREE breaking ASX announcements delivered to your inbox within minutes of release, complete with in-depth analysis already done for you. Over 20,000 subscribers trust Big News Blast to keep them ahead of the market. Click the “Free Alerts” button to start receiving alerts the moment news breaks.