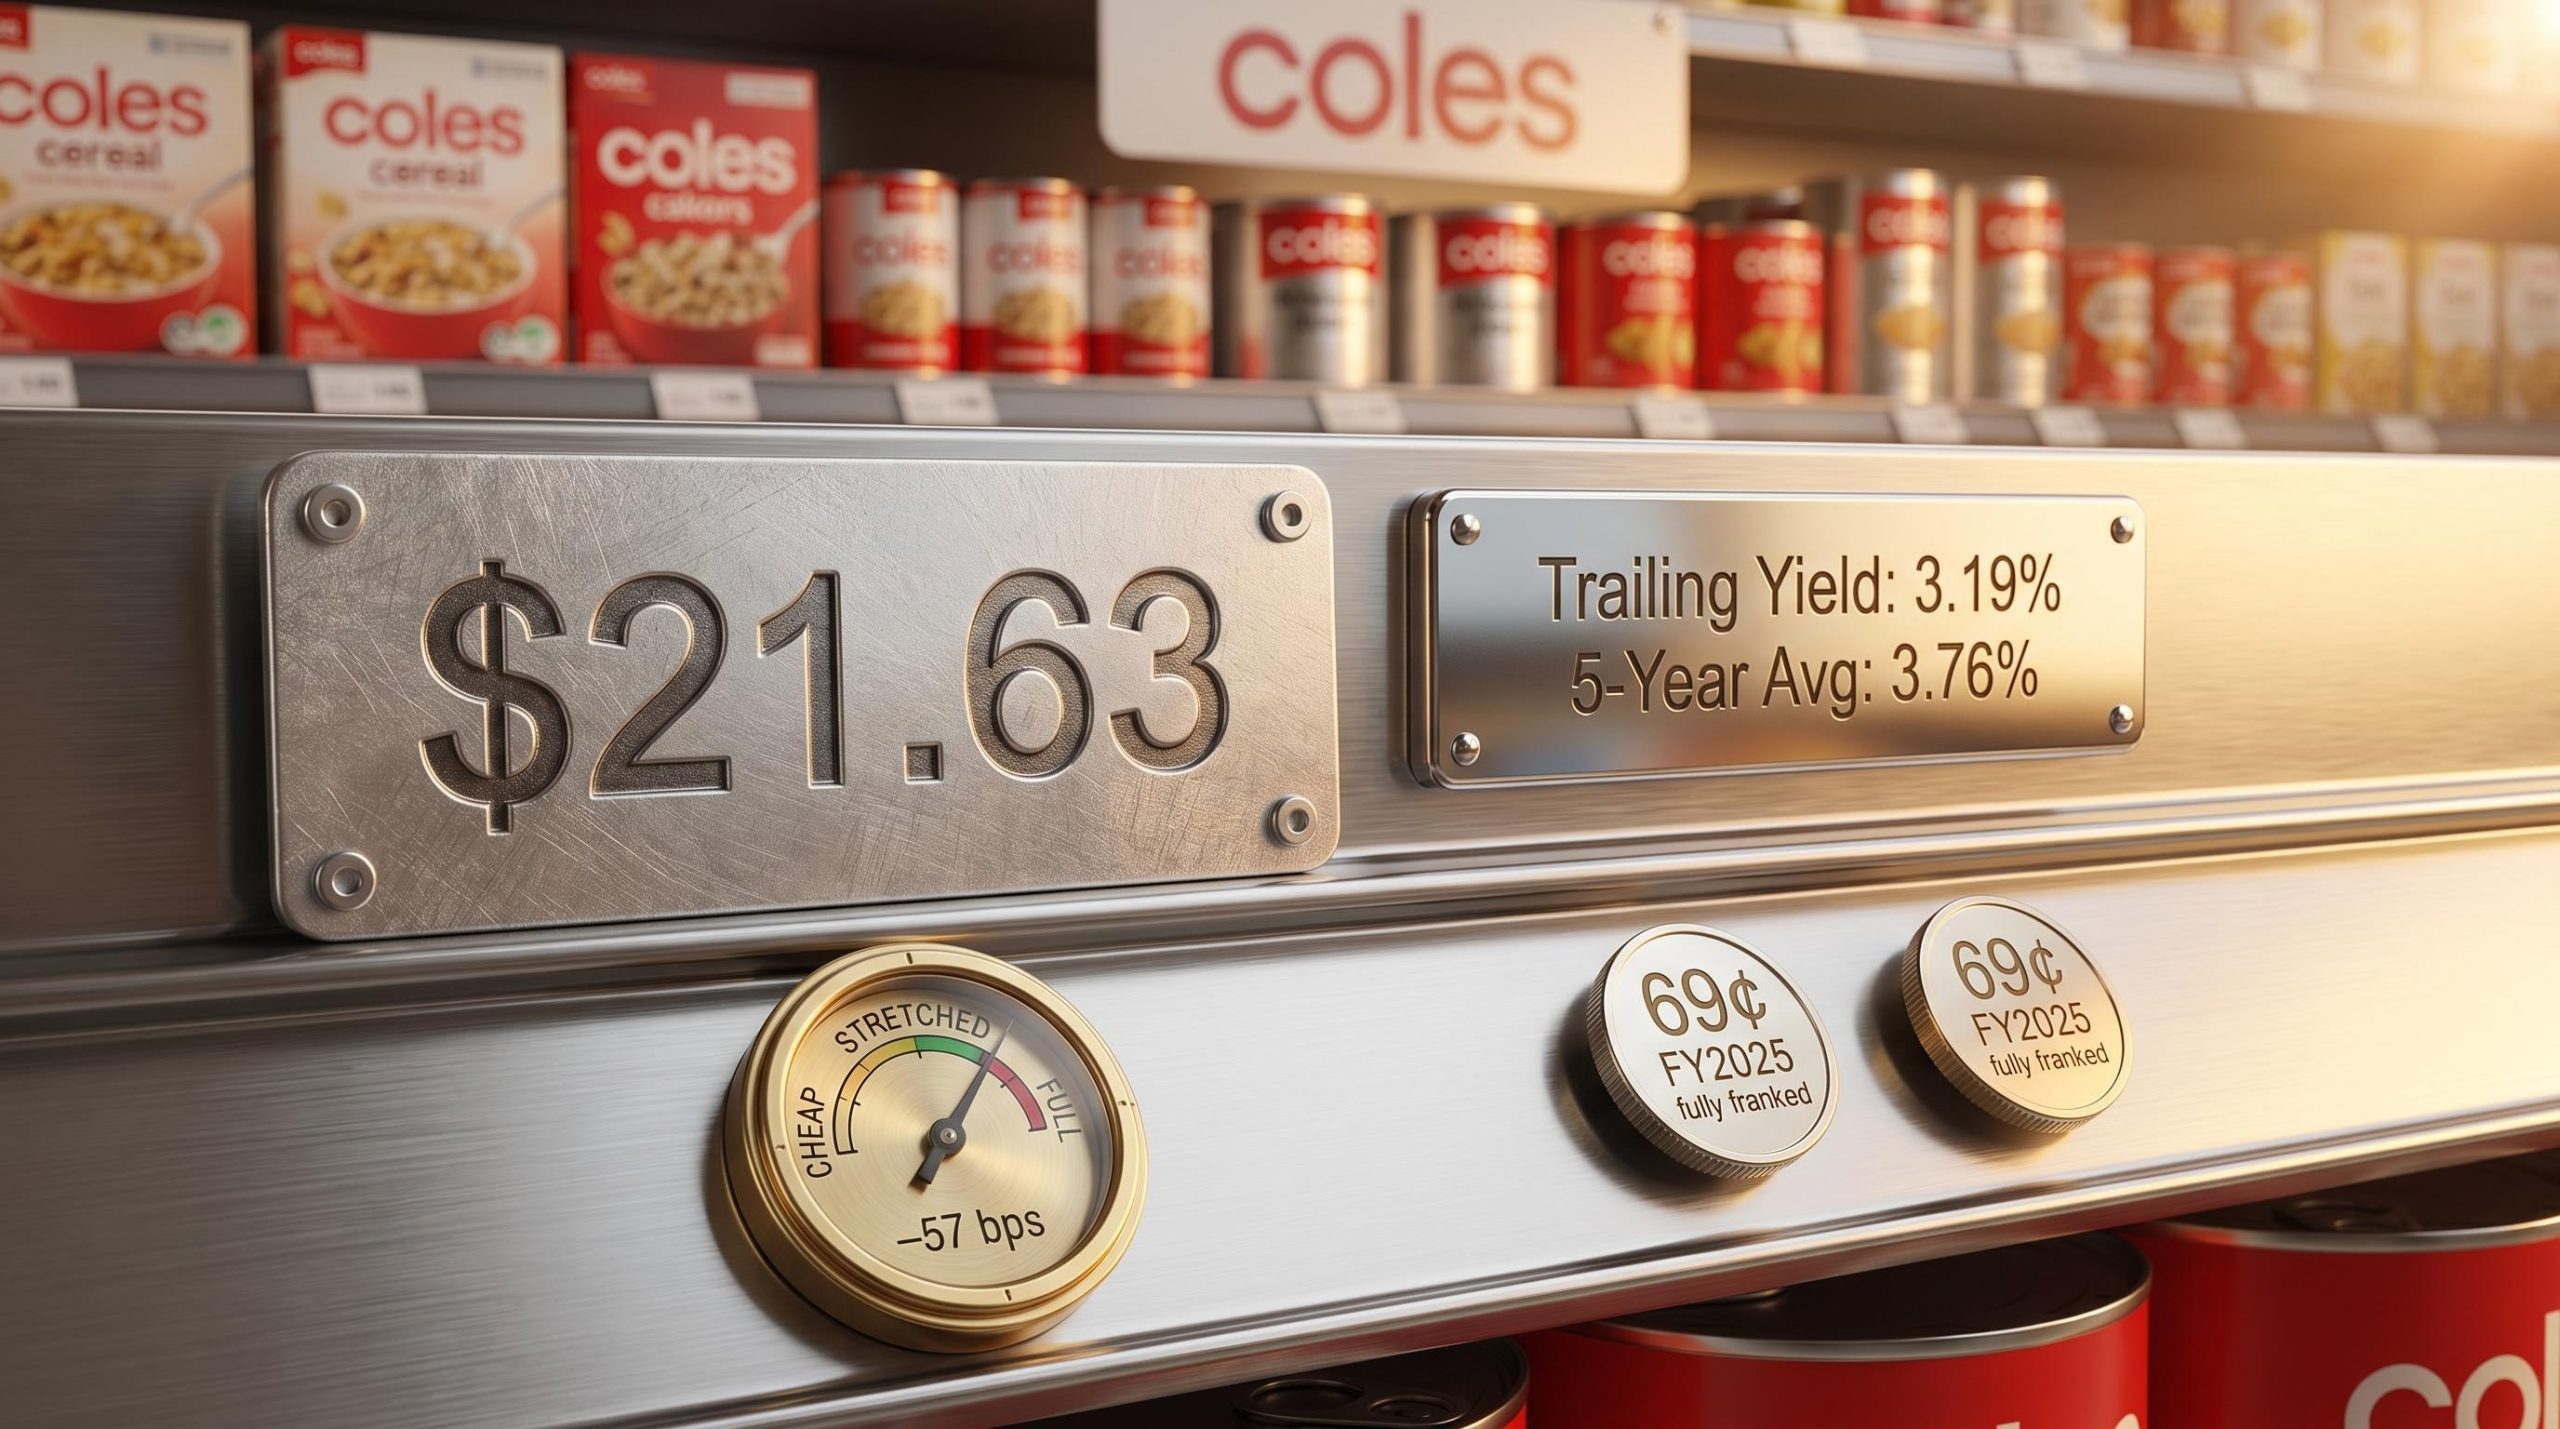
Coles shares are trading at a dividend yield of approximately 3.19%, a meaningful discount to the stock’s five-year historical average of 3.76%. The dividends themselves are not falling; they are growing. That gap between the current yield and the historical norm raises a pointed question for income-focused investors: has the market re-rated COL upward to reflect a genuinely improved business, or is the Coles share price simply more expensive than its own income history can justify?
The answer depends on which valuation lens an investor applies, and how much weight they give to the macro environment. With the RBA cash rate sitting at 4.35% and Australian CPI running at 4.6% year-on-year as of March 2026, the backdrop for evaluating blue-chip dividend stocks has shifted materially. Risk-free alternatives now offer higher income than COL’s trailing yield, without equity risk attached. That changes how yield compression should be interpreted.
What follows is a walk through what COL’s dividend yield signal actually means right now, what other valuation measures add to the picture, and how retail investors can structure a clear-eyed view of whether $21.63 represents a genuine opportunity or a fair-to-full valuation.
How dividend yield works as a valuation shortcut for ASX blue-chips
Dividend yield is one of the simplest inverse valuation signals available. It equals the annual dividend per share divided by the current share price, expressed as a percentage. When the yield falls, one of two things has happened, and they carry opposite implications:
- The dividend was cut, meaning the company is paying less income. This is a deterioration signal.
- The share price has risen faster than the dividend, meaning the market has repriced the stock upward. This is a valuation signal.
The distinction matters. Investors who see a falling yield and assume weaker income may be making the opposite error: the stock has become more expensive, not less generous.
Yield as a total return signal has well-documented limitations: a rising yield driven by a falling share price can look attractive while the underlying capital position deteriorates, meaning income-focused investors who track only the cash dividend may be missing the more important story about whether the business is actually compounding wealth.
A stock’s historical average yield serves as a rough “fair value anchor” for income-focused analysis. When the current yield sits below the historical average and dividends are growing, the share price has moved above the level at which the market has historically been willing to hold the stock for its income alone.
Coles sits squarely in this category. The five-year average yield is 3.76%. The trailing yield as of 8 May 2026 is approximately 3.19% (based on 69 cents in FY2025 dividends divided by $21.63). The most recent annual dividend exceeded the three-year average, confirming that the compression is price-driven, not dividend-driven.
“When dividends are growing but yield is falling, the market has repriced the stock upward. The question is whether that repricing is justified.”
When big ASX news breaks, our subscribers know first
What COL’s current yield gap is actually telling investors
The numbers sharpen the question. At $21.63, COL’s trailing dividend yield of 3.19% sits 57 basis points below the five-year average of 3.76%. The forward yield estimate, based on an assumed FY2026 full-year dividend of approximately 73 cents (the declared 41-cent interim plus a similar final dividend), improves the picture slightly to approximately 3.37%, but still falls short of the historical norm.
| Yield Measure | Yield | Gap vs 5-Year Average |
|---|---|---|
| Trailing (FY2025: 69¢) | 3.19% | –57 basis points |
| Forward estimate (FY2026: ~73¢) | ~3.37% | –39 basis points |
| 5-year historical average | 3.76% | — |
The FY2025 full-year dividend of 69 cents per share, 100% fully franked, represented growth on prior years. The FY2026 interim dividend of 41 cents per share (ex-date 10 March 2026, payment 30 March 2026), also 100% fully franked, suggests the payout trajectory remains intact. The share price has gained approximately 1.4% from the start of 2025 to the current level.
Gap versus the historical average: cheap, fair, or stretched?
Because dividends have grown while the yield has fallen, the gap is not a warning about income deterioration. It is a valuation signal: the market has repriced COL above the level at which the stock has historically traded relative to its own dividend stream.
A yield 57 basis points below the five-year average typically indicates a stock trading above its historically typical price level. The interpretive fork is straightforward. Either the market sees something in COL’s fundamentals that justifies the premium, or the stock is stretched on this measure. Yield alone cannot settle that question without cross-referencing other metrics.
Beyond yield: what the P/E ratio and relative valuation add
The P/E ratio operates independently of the dividend yield framework. Where yield measures what the market pays per dollar of income, the P/E measures what it pays per dollar of earnings. For Coles, both lenses point in the same direction.
Key valuation metrics as of April 2026:
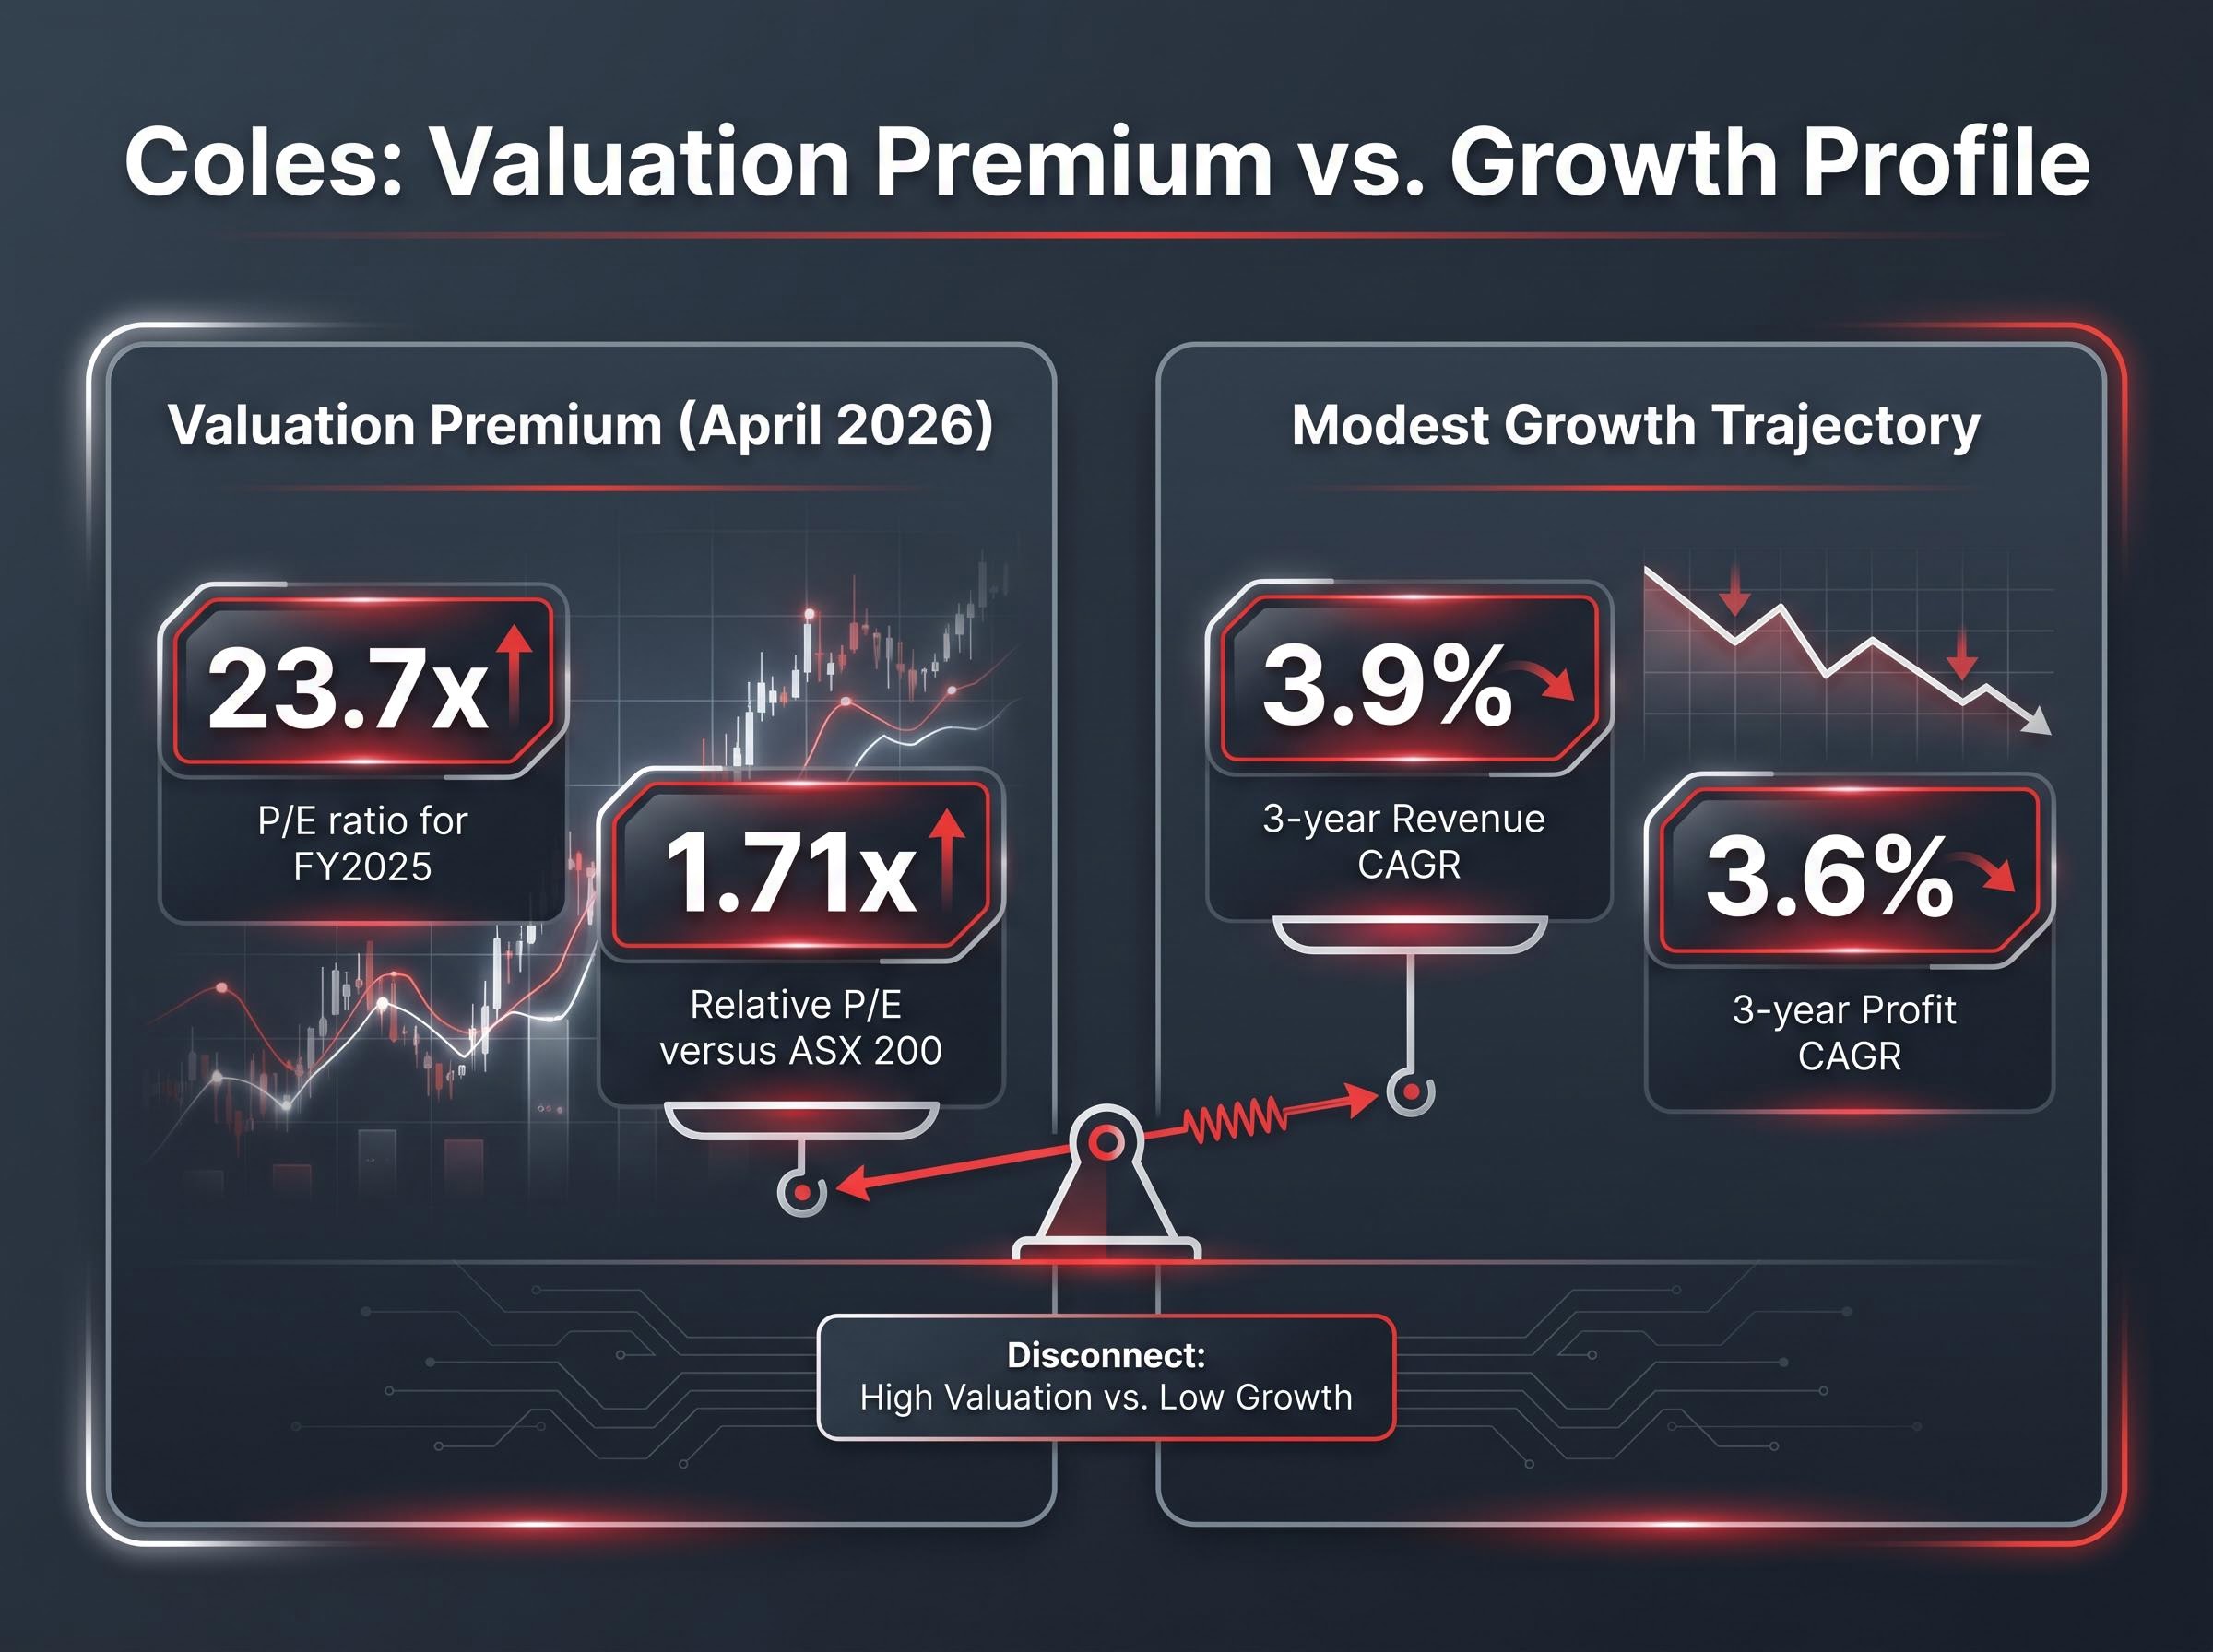
- P/E ratio: 23.7 times (FY2025)
- Relative P/E versus ASX 200: approximately 1.71 times the market average
- Revenue CAGR (three-year): 3.9% per annum
- Profit CAGR (three-year): approximately 3.6% per annum
- Underlying NPAT (FY2025): $1.18 billion
- Underlying EBIT (FY2025): $2.2 billion
- Gross margin: 26.1%
- Debt-to-equity ratio: 278.4%
The Coles Group FY2025 full-year results release confirms underlying NPAT of $1,181 million and eCommerce sales growth of 24.4% in Supermarkets, providing the primary source basis for the financial metrics referenced throughout this analysis.
The relative P/E figure is the more telling data point. A P/E of 23.7 times on its own could reflect a growth premium, a quality premium, or simple market froth. But at 1.71 times the ASX 200 average, the market is paying substantially more per dollar of Coles earnings than it pays for the average listed company.
“COL trades at approximately 1.71 times the ASX 200 average P/E. For a grocery retailer growing earnings at under 4% per annum, that premium demands scrutiny.”
The tension is clear. Revenue growing at 3.9% and profit at 3.6% per annum describes a mature, operationally stable business, not an accelerating growth story. That growth profile is consistent with a saturated Australian grocery market where performance depends on cost discipline and efficiency rather than pricing power. A stock carrying a 71% premium to the market P/E on that growth trajectory needs either a quality narrative (defensive earnings, reliable franked dividends) or a re-rating catalyst to sustain the multiple.
The factors that complicate a straightforward valuation call
Three material factors prevent the yield and P/E data from delivering a clean verdict.
- The rate environment as a competing income source. At 4.35%, the RBA cash rate offers a higher yield than COL’s 3.19% trailing dividend, without equity risk. During the low-rate era, a 3.19% fully franked yield from a defensive blue-chip would have looked attractive. In May 2026, it competes with term deposits and government securities that pay more and carry no capital risk. This does not make COL a poor investment, but it changes the hurdle rate.
- eCommerce growth and revenue momentum. Normalised eCommerce sales growth of 23.3% in FY2025 and first-half FY2026 group sales of $23.6 billion (implying an annualised run-rate of approximately $47 billion) suggest Coles is not standing still. If the digital channel delivers sustained margin improvement, the current premium multiple could prove justified. With approximately 28% of the Australian grocery market, Coles retains the scale to convert digital investment into operating leverage. Shareholder return of 26.9% in FY2025, versus negative 3.8% in FY2024, reflects the market’s recognition of this trajectory.
The Coles half-year results for 1H FY2026 showed supermarkets EBIT growth of 14.6% and a 10.8% lift in the interim dividend to 41 cents per share, with eCommerce penetration reaching 13.1% of supermarkets sales, the operational data underpinning the market’s decision to reprice the stock above its historical yield range.
- The ACCC regulatory overhang.
The ACCC overhang and what it means for margins
The ACCC’s 2024-25 Supermarkets Inquiry examined pricing practices across major grocery retailers. In 2026, the regulator initiated legal action against both Coles and Woolworths over “illusory” promotional discounts that allegedly misrepresented the extent of actual savings to consumers. If regulatory outcomes constrain COL’s ability to manage margins through promotional pricing strategy, the impact extends beyond reputational risk into the mechanics of how the company protects its gross margin.
What DCF and Dividend Discount Models would add to this picture
The yield-and-P/E framework is a starting point, not a destination. For investors who want to move beyond relative valuation toward an estimate of intrinsic value, Discounted Cash Flow (DCF) analysis and the Dividend Discount Model (DDM) offer more rigorous frameworks. Both require three inputs that carry significant sensitivity:
The dividend discount model mechanics that matter most for a stock like Coles are the discount rate and the terminal growth assumption: small changes in either input, particularly the assumed long-run dividend growth rate, produce valuation swings of several dollars per share on a mature, low-growth business.
- A discount rate, which determines how future cash flows or dividends are valued in today’s terms. The RBA’s 4.35% cash rate directly influences the risk-free rate component, and COL’s 278.4% debt-to-equity ratio is a material input to any weighted average cost of capital (WACC) calculation. In a low-rate environment, discount rates compress and implied fair values rise. In the current environment, the opposite applies.
- A dividend or cash flow growth assumption, which projects how fast the income stream will grow. COL’s three-year revenue CAGR of 3.9% and profit CAGR of approximately 3.6% provide a starting proxy for the terminal growth rate, but small changes in this assumption produce outsized changes in the output.
- A terminal value assumption, which captures the business’s value beyond the explicit forecast period. For a mature grocery retailer with $1.18 billion in underlying NPAT and a book value per share of just $2.84, the terminal value calculation needs to reflect both the stability and the limited organic growth of the business.
“In a DDM, the difference between a 3% and 4% assumed long-run dividend growth rate can shift the implied fair value by several dollars per share.”
Retail investors who build even a simple DDM for COL will develop a much stronger intuition for what the current share price is implying about the company’s future growth and income trajectory.
COL at $21.63: what the weight of evidence suggests
The multiple analytical threads converge on a consistent picture. Trailing yield sits below the historical average. The P/E carries a 71% premium to the broader market. Growth is steady but modest. The cash rate competes directly with the dividend yield. On current evidence, the balance of signals points toward fair-to-full valuation rather than an obvious buying opportunity.
| Scenario | Share Price | Implied Yield |
|---|---|---|
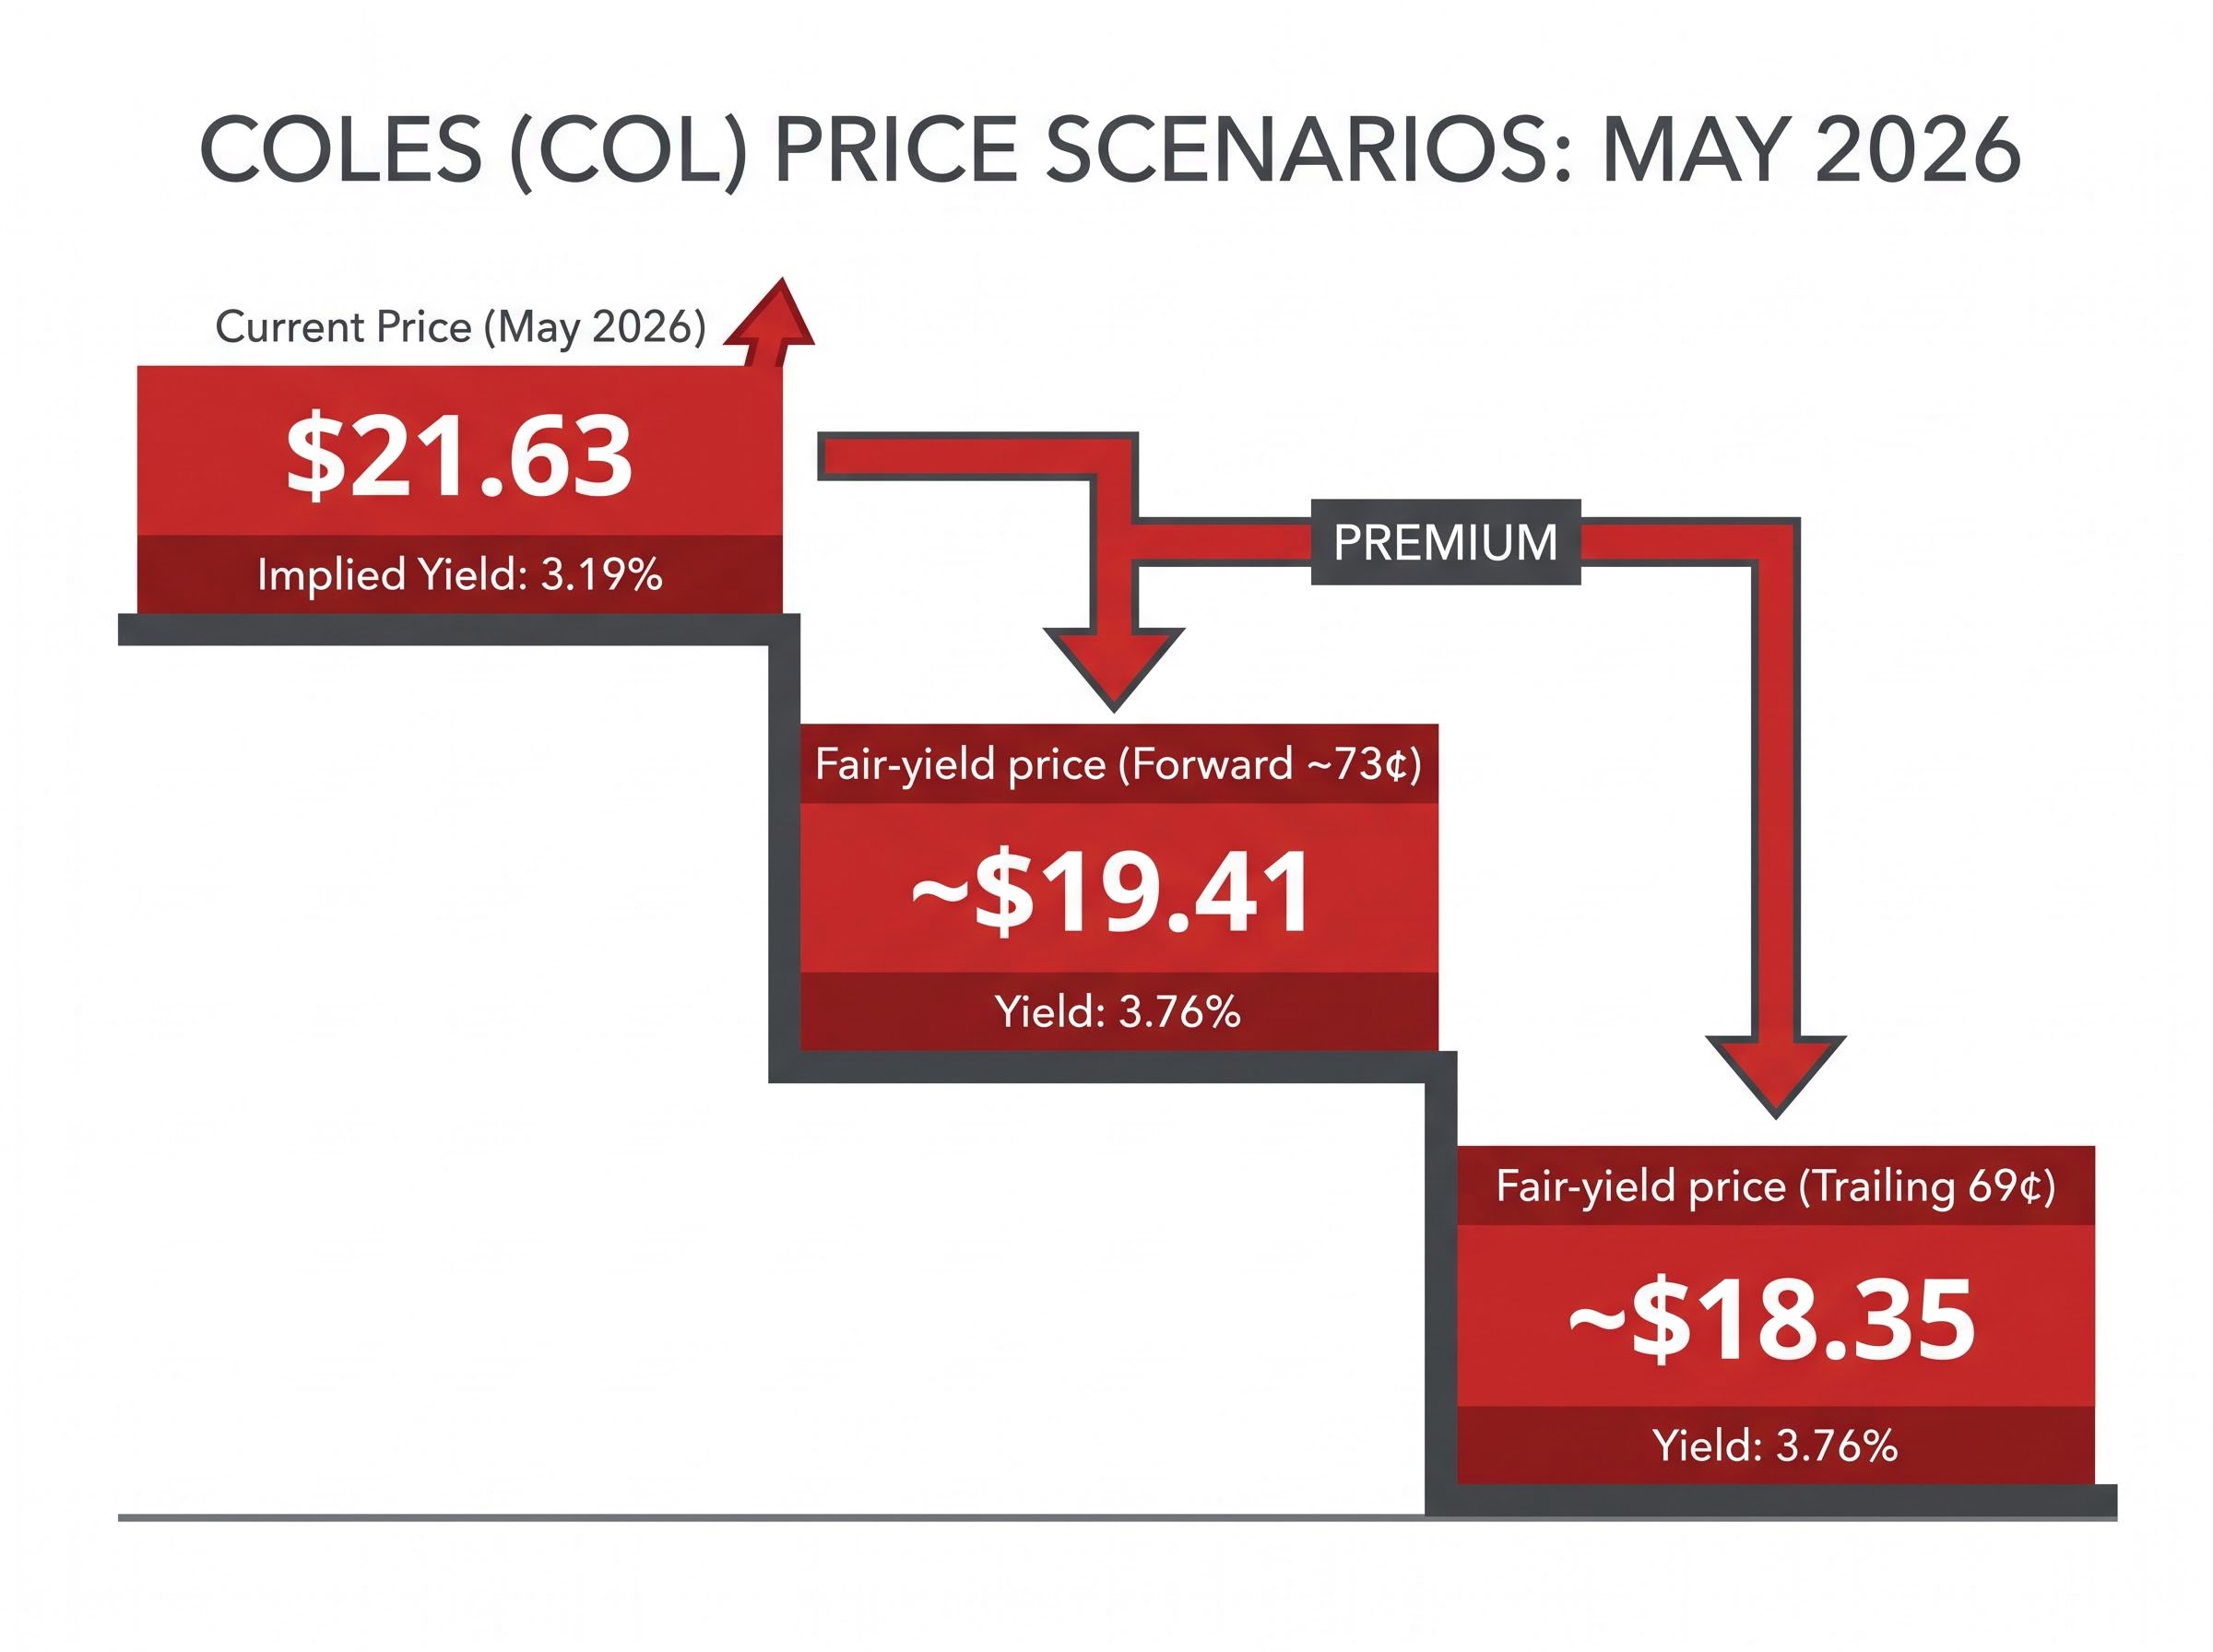
| Current price (May 2026) | $21.63 | 3.19% (trailing) |
| Fair-yield price on trailing dividend (69¢) | ~$18.35 | 3.76% |
| Fair-yield price on forward dividend (~73¢) | ~$19.41 | 3.76% |
The counter-case is not trivial:
- Dividends are growing and remain 100% fully franked, delivering enhanced after-tax income for eligible shareholders
- Grocery retailing is a defensive sector where consumer demand persists through economic cycles
- eCommerce growth of 23.3% and a potential FY2026 revenue run-rate approaching $47 billion suggest the business is not static
Franking credit value for eligible shareholders, particularly superannuation funds in pension phase and retirees below the top marginal tax rate, means COL’s 100% fully franked dividend yields more in after-tax terms than the headline 3.19% figure suggests, with excess credits potentially refundable directly by the ATO for investors whose tax liability falls below the credit amount.
For income-focused investors, the implied “fair yield” price levels provide a concrete reference point. If COL were to trade at approximately $18.35 (on trailing dividends) or $19.41 (on forward estimates), the yield would return to its five-year average. The current price of $21.63 sits 11-18% above those levels, depending on the dividend assumption used.
COL is not obviously cheap on current evidence. Investors with a long-term income focus and disciplined entry-price criteria may find the picture changes meaningfully if the stock re-rates toward a yield closer to its historical average. Until then, the weight of the data supports a patient approach.
This article is for informational purposes only and should not be considered financial advice. Investors should conduct their own research and consult with financial professionals before making investment decisions. Past performance does not guarantee future results. Financial projections are subject to market conditions and various risk factors.