How $4B in Fuel Costs Erased American Airlines’ Record Q1
5 mins ago

GE Vernova surged 8% on 22 April 2026 following first-quarter earnings that beat analyst expectations across revenue, guidance, and free cash flow projections. The stock’s single-session move caps a year-to-date rally exceeding 50%, and a roughly 98% gain through 2025, positioning the company as one of the clearest beneficiaries of AI-driven electricity demand reshaping the U.S. power sector.
This analysis unpacks what GE Vernova’s Q1 2026 results reveal about the AI power infrastructure buildout: where demand is concentrating, which companies are positioned to capture it, and what constraints could slow the sector’s trajectory. The company’s $13 billion quarter-over-quarter backlog expansion is the most diagnostic signal that utilities and data centre operators are locking in capacity years ahead, a pattern that distinguishes structural demand from speculative ordering.
The numbers tell the story before the commentary does. GE Vernova reported Q1 revenue of $9.34 billion, a 16% increase year-over-year that beat the consensus estimate of $9.11 billion. The revenue beat alone would have been material, but the forward-looking signals carried more weight.
The order backlog expanded by over $13 billion in a single quarter. That figure is not a projection or a pipeline metric subject to conversion uncertainty. It represents committed orders from utilities, industrial operators, and data centre developers who are paying to secure delivery slots years out. The backlog expansion suggests buyers expect lead times to extend further and are willing to lock in capacity now rather than risk availability later.
The pattern of data centre operators locking in capacity years ahead is visible beyond U.S. equipment suppliers: Australian hyperscale provider NEXTDC secured 250MW of new contracts in a single quarter, reflecting the same forward-commitment behaviour GE Vernova’s backlog expansion signals.
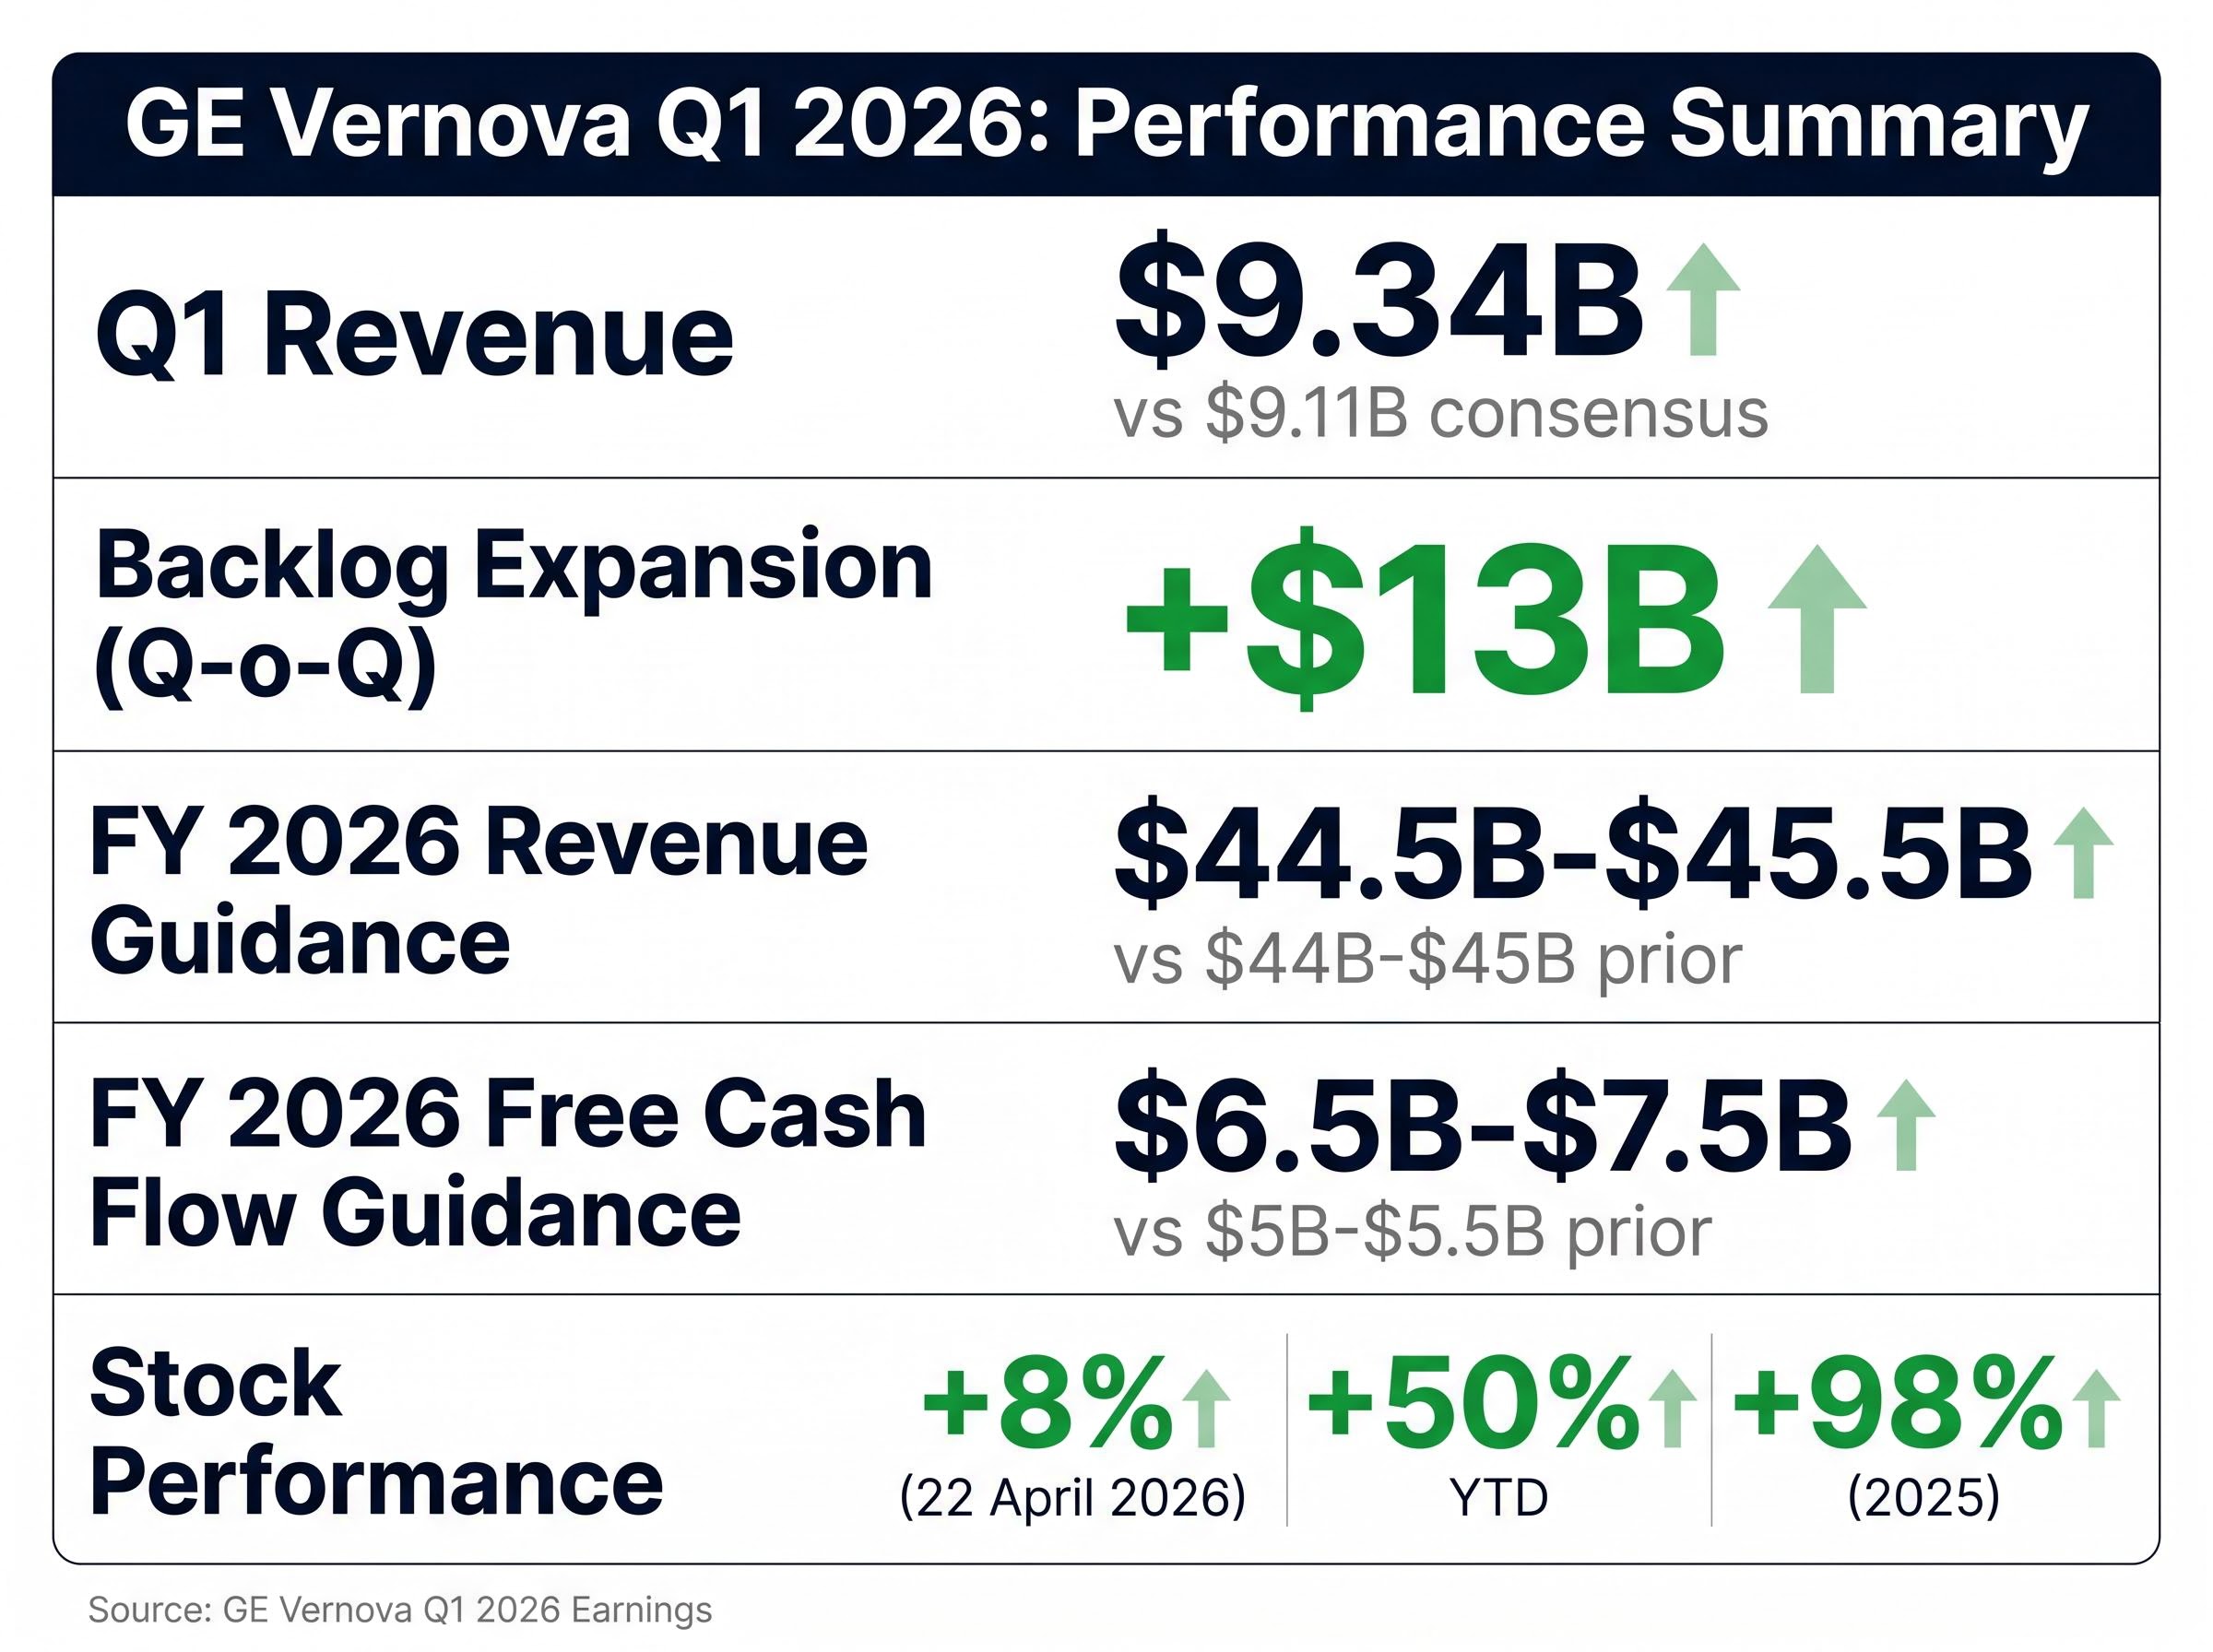
Management raised full-year revenue guidance to $44.5 billion to $45.5 billion, up from the prior range of $44 billion to $45 billion. Free cash flow guidance increased to $6.5 billion to $7.5 billion, a meaningful lift from the previous $5 billion to $5.5 billion range. CEO Scott Strazik described “accelerating demand from Power and Electrification customers” in the earnings call, framing the guidance revisions as responses to tightening rather than easing conditions.
| Metric | Q1 2026 Result | Consensus / Prior Guidance |
|---|---|---|
| Q1 Revenue | $9.34 billion | $9.11 billion (consensus) |
| Backlog Expansion (Q-o-Q) | +$13 billion | N/A |
| FY 2026 Revenue Guidance | $44.5B – $45.5B | $44B – $45B (prior) |
| FY 2026 Free Cash Flow Guidance | $6.5B – $7.5B | $5B – $5.5B (prior) |
| Stock Performance (22 April 2026) | +8% | N/A |
| Year-to-Date Performance | +50%+ | N/A |
| 2025 Full-Year Performance | +98% | N/A |
These results matter because they quantify infrastructure demand growth in committed capital rather than analyst projections. A $13 billion backlog expansion in 90 days signals that power buyers are moving faster than equipment suppliers can deliver, a dynamic that supports pricing power and sustained order flow for companies with manufacturing scale.
AI workloads consume electricity at rates traditional computing infrastructure was never designed to support. A single large-scale AI training cluster can draw as much power as a small city, with GPU-dense server racks generating heat loads that require industrial-scale cooling systems running continuously. The power intensity is structural, not incidental.
The IEA’s global analysis of electricity demand from data centres and AI quantifies that a single large-scale AI training cluster can draw as much power as a small city, with GPU-dense server racks generating heat loads that require industrial-scale cooling systems running continuously.
Data centre electricity consumption has been climbing for years, but AI accelerates the trajectory. Training large language models and running inference at scale both require sustained high power draws concentrated in specific geographic clusters where fibre connectivity, land availability, and grid access converge. The U.S. power grid was designed for distributed residential and commercial loads, not for concentrated industrial demand in technology corridors.
The supply-demand mismatch is visible in lead times and backlog growth. Gas turbine products and related grid services have become among the most sought-after segments in energy equipment over the past year, with utilities and private power developers competing for delivery slots. Domestic manufacturing initiatives, including semiconductor fabrication plants and battery production facilities, add competing demand for the same constrained infrastructure.
Key factors driving AI power intensity:
Grid Constraint Context Data centre developers are already facing delays in securing grid interconnection approvals, with some projects reporting wait times exceeding 24 months for transmission capacity studies alone. The bottleneck is not hypothetical; it is shaping where facilities can be built and how quickly.
Understanding the supply-demand mismatch is essential for evaluating which infrastructure investments are structural plays versus those that depend on demand continuing to outpace capacity additions. The grid constraint is not hypothetical; it is already shaping where data centres can be built and how quickly.
Bringing new power capacity online requires three layers of infrastructure, each with distinct lead times and suppliers. The first layer is generation equipment: natural gas turbines, combined-cycle plants, or alternative generation sources that produce the electricity. The second layer is transmission infrastructure: high-voltage lines, substations, and transformers that move power from generation sites to demand centres. The third layer is grid services: monitoring systems, load balancing equipment, and maintenance networks that keep the system stable as demand fluctuates.
GE Vernova operates across all three layers. The company supplies natural gas turbines for power generation, grid modernisation equipment for transmission networks, and ongoing services for power plant operations. This portfolio breadth positions the company as what industry analysts describe as a “one-stop shop” for the electric power industry, allowing utilities and private developers to consolidate suppliers rather than managing multiple vendor relationships.
The vertically integrated model matters because bottlenecks can form at any layer. A utility ordering turbines also needs transmission upgrades and grid monitoring systems to bring the new capacity online safely. Suppliers that can bundle these offerings reduce coordination risk for buyers and capture more of the total project value.
The three infrastructure layers:
Bundled offerings create stickier customer relationships because project timelines depend on coordinating across all three infrastructure layers. A supplier that delivers turbines, transmission equipment, and grid services reduces the buyer’s coordination burden and captures recurring revenue streams beyond the initial equipment sale.
Service contracts for turbine maintenance, grid monitoring, and system upgrades extend the revenue relationship for decades after the initial sale. GE Vernova’s positioning across generation, transmission, and services allows the company to participate in both the upfront capital expenditure and the ongoing operational expenditure that utilities commit to when adding capacity.
Investors evaluating the AI power infrastructure theme need to understand which parts of the supply chain are capacity-constrained. Companies that control multiple chokepoints, particularly those spanning generation equipment and grid services, can capture more of the value chain than single-product suppliers.
GE Vernova operates in a competitive set that includes Siemens Energy, Schneider Electric, and other global suppliers of gas turbines and grid equipment. The current demand environment favours incumbents with existing manufacturing capacity, established service networks, and the balance sheet strength to finance long-lead-time orders.
What differentiates winners when demand exceeds supply is not market share alone, but backlog management, delivery execution, and the ability to scale production without sacrificing margins. GE Vernova’s $13 billion backlog expansion in Q1 2026 signals that the company is capturing orders at rates that exceed its quarterly revenue run rate, indicating sustained order flow visibility for multiple quarters ahead.
The stock’s performance reflects elevated investor expectations. The 98% gain through 2025 and the additional 50%-plus rally year-to-date mean that much of the AI power infrastructure thesis is already priced into GE Vernova’s valuation. The question for investors is not whether the company benefits from sector tailwinds, but whether execution can match the expectations embedded in the share price.
| Company | Primary Products | Geographic Strength | Backlog Visibility |
|---|---|---|---|
| GE Vernova | Gas turbines, grid modernisation, power plant services | United States, global presence | Strong (Q1 2026: +$13B expansion) |
| Siemens Energy | Gas turbines, grid technologies, service solutions | Europe, Asia, expanding U.S. presence | Moderate (limited U.S.-specific disclosure) |
| Schneider Electric | Grid automation, energy management, data centre infrastructure | Global, strong Europe and Asia | Moderate (data centre segment growing) |
With multiple companies positioned to benefit from AI power demand, understanding relative positioning helps investors distinguish between sector-wide tailwinds and company-specific advantages. The question is not whether demand exists, but who can fulfil it fastest and most profitably while maintaining margins through a capacity-constrained cycle.
Demand is clear. Execution is harder. Four primary constraints limit how quickly the U.S. power infrastructure can absorb AI-driven electricity requirements: permitting timelines, transmission capacity limits, skilled labour availability, and equipment lead times.
Permitting processes for new generation capacity and transmission projects can stretch multiple years, particularly when crossing state or regional grid boundaries. Transmission capacity is already tight in key technology corridors, and adding high-voltage lines requires land acquisition, environmental reviews, and coordination with multiple regulatory bodies. Skilled labour for turbine installation, grid construction, and ongoing maintenance is scarce, with utilities competing against other industrial sectors for the same workforce.
The physical bottlenecks slowing AI infrastructure deployment, including permitting delays, transmission capacity limits, and skilled labour shortages, are creating multi-year delivery timelines that extend beyond what demand projections alone would suggest.
FERC’s announced reforms for large load interconnection aim to address the multi-year approval processes that currently delay generation and transmission projects, particularly those crossing state or regional grid boundaries where coordination among multiple regulatory bodies compounds timeline uncertainty.
Equipment lead times are extending as backlogs grow. GE Vernova’s $13 billion backlog expansion in one quarter is evidence that orders are accumulating faster than the company can deliver. While elevated backlogs are positive for suppliers, signalling sustained demand and pricing power, they also indicate that buyers are experiencing longer waits for critical infrastructure components.
Key constraint categories:
Backlog Growth as a Dual Signal The $13 billion backlog expansion represents both opportunity and constraint. It confirms that buyers are willing to commit capital years ahead, but it also signals that delivery timelines are extending, creating execution risk for power-dependent projects that need infrastructure online by specific dates.
Constraints create pricing power for suppliers who can deliver, but they also cap how quickly the sector can grow. Investors should watch for signs that lead times are extending further, which would signal both continued demand strength and potential execution risk for power-dependent projects.
The investment thesis emerging from GE Vernova’s Q1 2026 results is structural, not cyclical. AI-driven electricity demand is translating into committed orders that extend visibility for power equipment suppliers multiple years forward. The companies best positioned are those with vertically integrated portfolios spanning generation, transmission, and grid services, combined with manufacturing scale to execute on backlogs without margin erosion.
Valuation is the counterpoint. GE Vernova’s 98% gain through 2025 and 50%-plus rally year-to-date mean that much of the sector tailwind is already priced in. The raised guidance is a positive signal, but it confirms expectations rather than surprising to the upside. Investors entering at current levels are buying into a story where execution must meet elevated expectations to justify further multiple expansion.
Key metrics to monitor going forward:
This framework equips investors to evaluate the sector’s evolution over quarters rather than reacting to single earnings reports. The AI power infrastructure theme will unfold over years, and knowing what signals to track helps adjust positions as new data emerges.
For investors exploring how $700 billion in hyperscaler capital expenditure translates into specific equipment demand across chips, power, and data centre construction, our dedicated guide to how hyperscaler infrastructure commitments translate to chip and power demand examines Amazon’s Anthropic investment as a case study in how cloud providers are securing both compute capacity and power infrastructure through vertical integration strategies.
GE Vernova’s Q1 2026 results confirm a pattern: AI-driven electricity demand is translating into real orders, real revenue, and real backlog growth for power infrastructure suppliers. The $13 billion backlog expansion in one quarter speaks to utilities and data centre operators locking in capacity years ahead, a signal that demand is structural rather than speculative.
As the buildout continues, the companies best positioned are those that can deliver across generation, transmission, and grid services while managing the constraints that are slowing industry-wide deployment. Permitting timelines, transmission capacity limits, and equipment lead times will shape which projects come online first and which companies capture the most value.
Investors should monitor quarterly backlog disclosures, lead time commentary, and guidance revisions across the power equipment sector to track whether demand continues to outpace supply, or whether capacity additions begin to close the gap. The sector’s trajectory is set; the question is execution.
Disclaimer This article is for informational purposes only and should not be considered financial advice. Investors should conduct their own research and consult with financial professionals before making investment decisions.
AI power infrastructure refers to the generation, transmission, and grid services equipment needed to supply electricity to data centres running AI workloads. It matters for investors because AI-driven electricity demand is translating into committed multi-year orders for power equipment suppliers, creating long-term revenue visibility.
GE Vernova reported Q1 2026 revenue of $9.34 billion, beating the consensus estimate of $9.11 billion, alongside a $13 billion quarter-over-quarter backlog expansion and raised full-year free cash flow guidance to $6.5 billion to $7.5 billion, up from the prior $5 billion to $5.5 billion range.
AI training and inference workloads require sustained high power draws concentrated in specific geographic clusters, and cooling systems for high-density server racks consume roughly 40% of total facility power load, overwhelming local transmission capacity in grid zones that were designed for distributed residential and commercial demand.
The four primary constraints are permitting timelines that can stretch multiple years, limited transmission capacity in key technology corridors, shortages of skilled labour for turbine installation and grid construction, and extending equipment lead times as backlogs grow faster than manufacturers can deliver.
Investors should monitor quarterly backlog growth trends, revenue guidance revisions, management commentary on delivery lead times, and any announcements of new manufacturing capacity from competitors, as these signals reveal whether demand continues to outpace supply or whether capacity additions are beginning to close the gap.