Equal Weight S&P 500 Gains Edge as Tech Faces Free Cash Flow Drag

Key Takeaways
- Société Générale's Chief US Equity Strategist recommends the equal weight S&P 500 via RSP over cap-weighted SPY as his preferred US equity vehicle through early 2027.
- The cap-weighted S&P 500 faces a projected ceiling near 7,000 due to technology headwinds, with hyperscaler aggregate free cash flow expected to turn negative by year-end 2026.
- RSP's tilt toward industrials, materials, and utilities positions holders to benefit from elevated US power demand driven by AI infrastructure buildout, supported by Goldman Sachs projections of a 160% increase in electricity demand through 2030.
- Only two of the Magnificent 7 outperformed the S&P 500 in 2025, illustrating the concentration risk embedded in cap-weighted indexes like SPY that equal weight strategies avoid.
- Q1 2027 is the projected inflection point when improving hyperscaler free cash flow and capex-to-sales ratios may shift the calculus back toward cap-weighted technology exposure.
The Technology Select Sector SPDR Fund (XLK) has gained 18% since 30 March 2025, yet Manish Kabra, Chief US Equity Strategist at Société Générale, argues the cap-weighted S&P 500 faces a ceiling near 7,000 due to technology’s outsized influence. His recommendation centres on the equal weight S&P 500 as the preferred vehicle for US equity exposure through early 2027. This article examines why strategists believe the Invesco S&P 500 Equal Weight ETF (RSP) may outperform the SPDR S&P 500 ETF Trust (SPY) during a period of tech sector uncertainty and sector rotation toward power-demand beneficiaries.
What Is the Equal Weight S&P 500 and How Does It Differ from SPY?
Cap-weighted indexing assigns influence based on market capitalisation, meaning larger companies drive returns disproportionately. SPY, which tracks the traditional S&P 500, operates this way. Technology represents approximately 32% of SPY’s portfolio, whilst the remaining sectors share the balance.
The equal weight S&P 500 approach assigns each of the 500 stocks an identical 0.2% weighting regardless of market capitalisation. RSP rebalances quarterly to maintain this structure. This creates meaningfully different sector exposures compared to SPY.
| Characteristic | SPY (Cap-Weighted) | RSP (Equal-Weighted) |
|---|---|---|
| Weighting Method | Market capitalisation | Equal (0.2% per stock) |
| Tech Sector Exposure | ~32% | More balanced distribution |
| Sector Tilts | Mega-cap concentrated | Industrials, materials, utilities |
| Rebalancing | Float-adjusted quarterly | Quarterly to equal weight |
| Mega-Cap Sensitivity | High | Low |
Choosing between SPY and RSP effectively determines sector and size exposure. A portfolio allocated to SPY tracks the fortunes of mega-cap technology companies closely, whilst RSP spreads risk more evenly across all 500 constituents. This distinction proves particularly relevant during periods when mega-cap performance diverges from broader market fundamentals.
When big ASX news breaks, our subscribers know first
Société Générale’s Case for Equal Weight Over Cap Weight
In an interview conducted 16 April 2026, Kabra articulated his core thesis that the cap-weighted S&P 500 will struggle to exceed 7,000 due to technology headwinds. His recommendation positions the equal-weighted index as the superior vehicle for US equity exposure through early 2027.
Kabra’s equal-weight recommendation aligns with Société Générale’s broader market thesis on technology sector headwinds through 2026, which provides additional context on the firm’s cap-weighted S&P 500 ceiling projection and the comprehensive reasoning behind this strategic positioning.
> “The equal-weighted S&P 500 is the closest available proxy for US nominal growth.”
>
> Manish Kabra, Chief US Equity Strategist, Société Générale
Kabra’s characterisation highlights a fundamental appeal beyond simple diversification. By reducing concentration in mega-cap technology stocks, the equal-weighted index aligns more closely with the broader US economy’s growth drivers. This matters when the largest cap-weighted constituents face earnings pressure whilst other sectors benefit from structural tailwinds.
The sector rotation logic centres on power demand. Equal-weight’s tilt toward industrials, materials, and utilities positions holders to benefit from elevated US power consumption driven by artificial intelligence infrastructure buildout. These sectors are projected to outperform whilst technology faces the dual headwinds of declining free cash flow and unproven returns on capital expenditure.
Companies positioned to benefit from elevated power demand are experiencing tangible commercial momentum in power infrastructure, as demonstrated by firms supplying battery and energy solutions that support the electricity consumption increases driven by AI data centres.
Goldman Sachs analysis projecting 160% increase in US electricity demand through 2030 identifies utilities and industrials as primary beneficiaries of this multi-year structural trend, providing quantitative backing for the sector rotation thesis underlying the equal-weight recommendation.
Key supporting points for the equal-weight preference:
- Reduced technology concentration risk compared to 32% cap-weighted exposure
- Increased allocation to power-demand beneficiaries (industrials, materials, utilities)
- Broader diversification across market capitalisations reduces single-stock dependence
- Alignment with US economic growth drivers beyond mega-cap technology
Why Tech’s Headwinds Support the Equal Weight Thesis
Kabra monitors two specific metrics that signal caution on technology sector timing despite the recent rally. Both indicators suggest patience is warranted before increasing tech allocation.
The first metric tracks aggregate hyperscaler free cash flow. This measure has declined quarterly since early 2024 and is projected to turn negative by year-end 2026. Free cash flow matters because it reflects balance sheet quality and the capacity to return capital to shareholders. Declining free cash flow indicates hyperscalers are consuming more capital than they generate, a dynamic driven by unprecedented artificial intelligence infrastructure investment. Kabra projects free cash flow will inflect positively in Q1 2027, marking a potential re-entry point for tech-focused allocations.
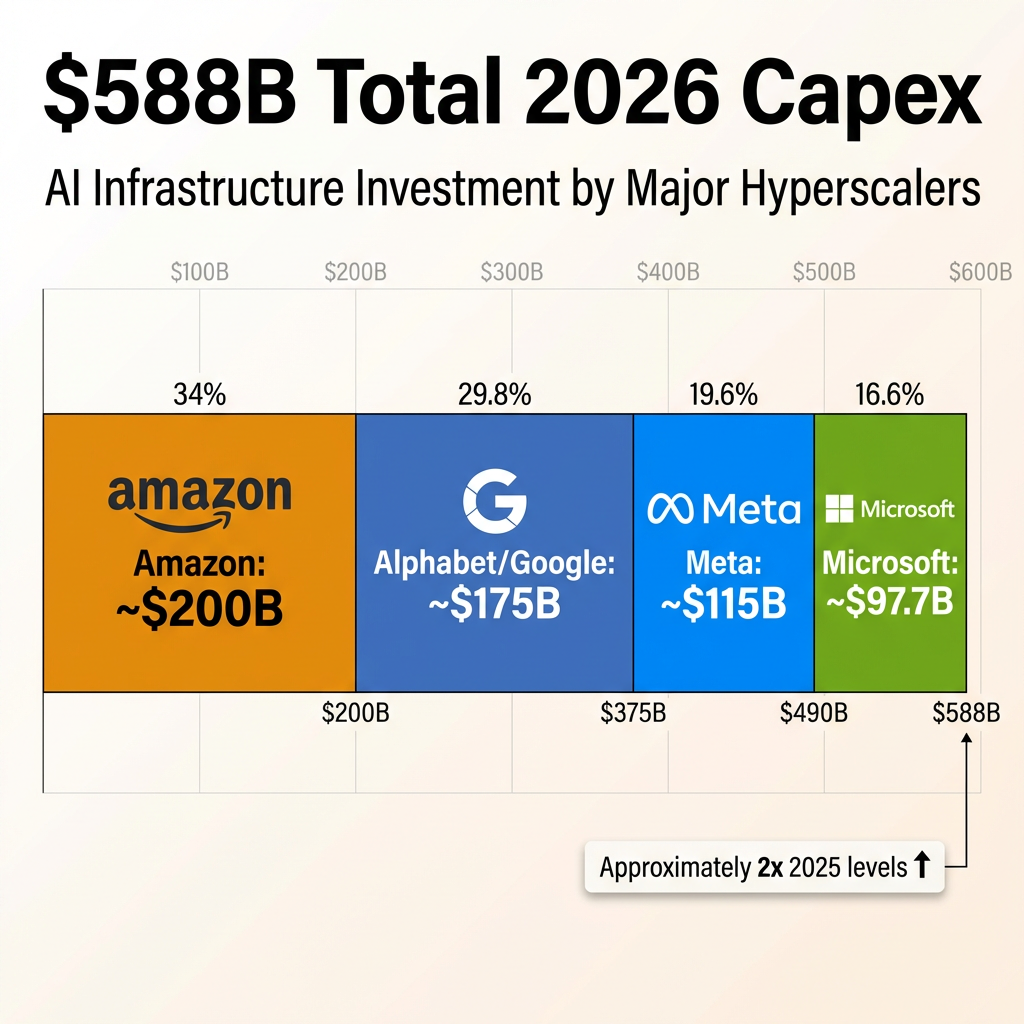
| Company | 2024 Capex | 2025 Capex | 2026 Projected Capex |
|---|---|---|---|
| Amazon | Data not available | Data not available | ~$200B |
| Alphabet (Google) | Data not available | Data not available | ~$175B |
| Meta | Data not available | Data not available | ~$115B |
| Microsoft | Data not available | Data not available | ~$97.7B |
| Total | ~$588B |
The second metric, capex-to-sales ratio, measures whether artificial intelligence investments are generating adequate returns. This indicator tracks how much revenue hyperscalers produce relative to their capital spending. Kabra describes this as the most critical indicator to monitor.
> “The capex-to-sales ratio is the single most critical indicator to track.”
>
> Manish Kabra, Chief US Equity Strategist, Société Générale
Improvement in this ratio, projected for Q1 2027, would signal that artificial intelligence infrastructure spending is translating into monetisation. Until this inflection occurs, the unprecedented capital expenditure of approximately $588 billion across Amazon, Alphabet, Meta, and Microsoft in 2026 (roughly double 2025 levels) represents a headwind for free cash flow and a source of uncertainty for cap-weighted index performance. Kabra’s hyperscaler universe extends beyond the Big Four to include Alibaba, Tencent, Oracle, Baidu, IBM, CoreWeave, Nebius, Salesforce, China Mobile, China Telecom, and China Unicom.
The unprecedented capital expenditure raises fundamental questions about AI infrastructure return on investment that extend beyond simple capex-to-sales ratios, addressing whether the massive spending will generate adequate returns to justify current valuations.
The Magnificent 7 Factor: Concentration Risk in Cap-Weighted Indexes
Magnificent 7 concentration creates asymmetric risk in cap-weighted indexes. When these stocks underperform, they drag SPY disproportionately due to their outsized weightings. Performance in 2025 illustrated this dynamic clearly, with the group showing divergent results despite its perceived dominance.
2025 Magnificent 7 Performance:
- Alphabet: +66%
- Nvidia: +41%
- S&P 500 benchmark: +16%
- Microsoft, Meta, Apple, Amazon: All below S&P 500 return
Only two of the seven stocks outperformed the broader index, whilst the remaining five delivered below-benchmark returns. This internal rotation within the Magnificent 7 continued into April 2026, with Apple and Tesla entering downtrends whilst Meta and Amazon traded below historical valuation medians.
As of late April 2026, Meta traded at 21.9x forward price-to-earnings (below its historical median) and Amazon at 30.7x forward price-to-earnings (also below its historical median). These valuations suggest the stocks had underperformed prior to their current levels, despite the potential for rebounds from depressed multiples. Apple and Tesla remained in technical downtrends, adding further dispersion to Magnificent 7 performance.
RSP holders avoid this single-stock concentration risk. Each Magnificent 7 member carries a 0.2% weight in the equal-weighted index compared to the outsized influence these stocks exert in SPY. This structure smooths returns and reduces dependence on any single stock’s trajectory, a meaningful advantage when mega-cap performance shows significant internal variation.
S&P Dow Jones Indices research on equal-weight performance during high-concentration periods demonstrates that equal-weight strategies historically outperform cap-weight indexes when mega-cap concentration reaches extreme levels, precisely the market structure Kabra identifies in his April 2026 thesis.
When Might Tech Become Attractive Again?
Kabra’s timeline identifies early 2027 as the period when technology re-entry becomes more attractive. Both monitored metrics (hyperscaler free cash flow and capex-to-sales ratios) are projected to inflect positively around Q1 2027. Free cash flow is expected to turn positive, and capex-to-sales ratios should begin improving, signalling that artificial intelligence infrastructure spending is translating into revenue growth.
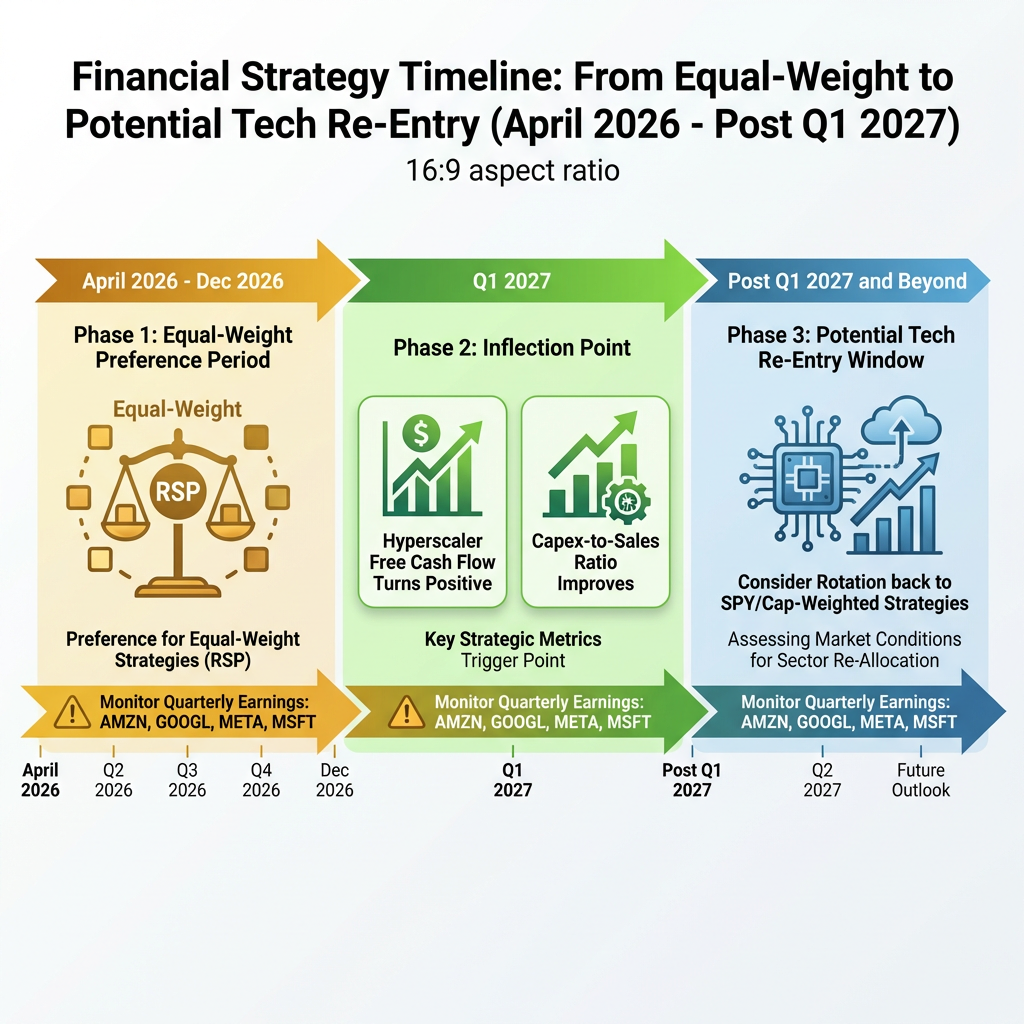
This timeline implies the equal-weight preference represents a tactical positioning decision through year-end 2026 rather than a permanent allocation shift. Investors should monitor quarterly earnings reports from Amazon, Alphabet, Meta, and Microsoft for signs of earlier or later inflection in these metrics. If free cash flow stabilises sooner or capex efficiency improves ahead of projections, the case for rotating back toward cap-weighted exposure would strengthen.
The AI infrastructure deployment scale and timeline from data centre operators illustrates the capital intensity and long conversion cycles that pressure near-term tech free cash flow, helping explain why Kabra expects improvement only in Q1 2027.
The next major ASX story will hit our subscribers first
Key Takeaways for Investors
Strategic considerations for equal-weight positioning:
- Equal-weight S&P 500 exposure reduces technology concentration risk from cap-weighted’s ~32% allocation
- RSP tilts toward industrials, materials, and utilities, sectors positioned to benefit from elevated US power demand
- Société Générale projects the cap-weighted S&P 500 will struggle to exceed 7,000 through year-end 2026 due to tech headwinds
- Early 2027 may shift the calculus back toward technology if hyperscaler free cash flow and capex-to-sales ratios improve as projected
Investors holding significant SPY or cap-weighted index positions should evaluate whether their current allocation aligns with views on mega-cap technology performance through year-end 2026. Those seeking reduced concentration and exposure to sectors benefiting from artificial intelligence infrastructure’s second-order effects may find RSP’s equal-weight structure more appropriate for the current market environment.
Frequently Asked Questions
What is the main difference between RSP and SPY?
SPY weights constituent stocks by market capitalisation, meaning larger companies exert greater influence on index returns. RSP assigns each of the 500 stocks an equal 0.2% weighting regardless of size. This creates different sector exposures, with SPY holding approximately 32% in technology whilst RSP spreads exposure more evenly across all sectors. RSP rebalances quarterly to maintain equal weighting.
Why might equal weight outperform cap weight in 2026?
The thesis centres on technology facing free cash flow pressure from heavy artificial intelligence spending, with hyperscaler aggregate free cash flow projected to turn negative by year-end 2026. Meanwhile, industrials, materials, and utilities benefit from elevated US power demand driven by artificial intelligence infrastructure. Equal-weight reduces technology drag from 32% cap-weighted exposure and increases allocation to these power-demand beneficiaries.
What are the downsides of equal-weight investing?
Equal-weight funds typically carry higher expense ratios than cap-weighted alternatives. Quarterly rebalancing creates potential tax events in taxable accounts. The strategy underperforms when mega-cap stocks lead markets, as occurred during parts of 2023 and 2024. Equal-weight’s smaller-cap tilt can add volatility compared to cap-weighted indexes dominated by large, liquid mega-caps.
When should investors reconsider moving back to cap-weighted funds?
Kabra’s framework suggests Q1 2027 as the timeline for reassessment. Investors should monitor when hyperscaler aggregate free cash flow turns positive and capex-to-sales ratios begin improving. Quarterly earnings from Amazon, Alphabet, Meta, and Microsoft will provide inflection signals. If these metrics improve earlier than projected, the case for rotating back to cap-weighted exposure would strengthen ahead of the Q1 2027 timeline.
This article is for informational purposes only and should not be considered financial advice. Investors should conduct their own research and consult with financial professionals before making investment decisions.
Frequently Asked Questions
What is the equal weight S&P 500 and how does it work?
The equal weight S&P 500 assigns each of the 500 constituent stocks an identical 0.2% weighting regardless of market capitalisation, unlike the traditional cap-weighted index where larger companies like mega-cap tech stocks exert disproportionate influence. The Invesco S&P 500 Equal Weight ETF (RSP) rebalances quarterly to maintain this equal structure.
Why is Société Générale recommending RSP over SPY in 2026?
Société Générale's Chief US Equity Strategist Manish Kabra projects the cap-weighted S&P 500 will struggle to exceed 7,000 due to technology headwinds, including declining hyperscaler free cash flow projected to turn negative by year-end 2026 and unproven returns on approximately $588 billion in AI capital expenditure. RSP reduces tech concentration from ~32% and increases exposure to industrials, materials, and utilities benefiting from AI-driven power demand.
When might technology stocks become attractive to invest in again?
Kabra's framework identifies Q1 2027 as the key reassessment point, when hyperscaler aggregate free cash flow is projected to turn positive and capex-to-sales ratios are expected to improve, signalling that AI infrastructure spending is translating into revenue. Investors should monitor quarterly earnings from Amazon, Alphabet, Meta, and Microsoft for earlier-than-expected inflection signals.
What are the risks of investing in an equal weight S&P 500 ETF like RSP?
Equal weight funds typically carry higher expense ratios than cap-weighted alternatives, and quarterly rebalancing can create tax events in taxable accounts. The strategy historically underperforms when mega-cap stocks lead markets, as occurred during parts of 2023 and 2024, and the smaller-cap tilt can add volatility compared to large-cap dominated indexes like SPY.
How does the Magnificent 7 affect SPY versus RSP performance?
In SPY, the Magnificent 7 hold outsized weightings meaning their underperformance drags the entire index, as demonstrated in 2025 when only Alphabet and Nvidia outperformed the S&P 500 benchmark while the other five delivered below-benchmark returns. In RSP, each Magnificent 7 member carries just a 0.2% weighting, significantly reducing single-stock concentration risk.