Why SocGen Warns Against Buying the Tech Rally at 7,000

Key Takeaways
- The Technology Select Sector SPDR Fund XLK surged 18% from 30 March through mid-April 2026, with the S&P 500 crossing 7,000 for the first time on 16 April 2026.
- Société Générale's Manish Kabra recommends against aggressive tech re-entry now, citing deteriorating hyperscaler free cash flow projected to turn negative by late 2026 before recovering in Q1 2027.
- Hyperscalers are projected to invest approximately $600 billion in AI infrastructure during 2026 — roughly double 2025 levels — but revenue monetisation from these investments remains in early stages.
- Kabra recommends the equal-weighted S&P 500 as a preferable alternative, reducing technology concentration risk while gaining exposure to utilities and industrials benefiting from AI infrastructure power demand.
- A positive free cash flow inflection and moderation in capital expenditure-to-revenue ratios in Q1 2027 represent the key fundamental signals Kabra has identified as confirmation for re-entering technology equities.
The technology sector has staged a remarkable recovery in recent weeks, with major indices reaching fresh milestones amid broad-based market strength. The Technology Select Sector SPDR Fund (XLK) surged 18% from 30 March through mid-April, whilst the Nasdaq Composite climbed to new record highs during this period. The S&P 500 crossed the historic 7,000 threshold for the first time at close on 16 April 2026, cementing what many strategists characterised as a decisive break from the late-March correction. This performance came despite lingering questions about artificial intelligence monetisation timelines and elevated capital expenditure across the sector.
Several catalysts converged to support the rally:
- TSMC’s guidance upgrade: Taiwan Semiconductor Manufacturing Company raised its 2026 sales growth forecast to more than 30%, signalling robust demand for AI-accelerated computing infrastructure
- Employment strength: The US economy added 178,000 jobs in March 2026, reinforcing confidence in economic resilience
- Geopolitical de-escalation: A US-Iran ceasefire agreement announced by 8 April reduced risk premiums across equity markets
- Broadening corporate guidance: Improved outlooks from companies across multiple sectors bolstered sentiment beyond technology alone
TSMC’s Q1 2024 earnings conference call transcript outlined management’s long-term revenue growth targets of 15-20% CAGR, driven primarily by AI accelerator demand across hyperscaler customers, providing the foundation for their subsequent 2026 guidance upgrade.
Yet not all Wall Street strategists recommend aggressive re-entry into technology equities at current levels. Société Générale’s chief US equity strategist Manish Kabra suggests investors hold off on aggressively buying into the technology rally, identifying early 2027 as a more favourable window for entry.
What Hyperscaler Metrics Tell Investors About Tech Health
Free cash flow represents the cash remaining after a company covers operating expenses and capital investments. This metric serves as a critical quality indicator because companies with strong free cash flow maintain flexibility for dividends, share buybacks, and strategic investments without requiring additional debt financing. When free cash flow deteriorates, it often signals that capital investments are outpacing the cash generation needed to sustain them, raising questions about return on invested capital.
Harvard Business School research on free cash flow as a predictive metric demonstrates that deteriorating free cash flow serves as a leading indicator of future equity underperformance, particularly when capital investments outpace cash generation capacity.
Capital expenditure-to-revenue ratios measure how much of a company’s revenue is being reinvested in infrastructure rather than flowing through to profits. High ratios during investment cycles are normal as companies build out capacity for future growth. However, these ratios must eventually moderate as investments begin generating proportional returns, otherwise suggesting that spending may be inefficient or that revenue monetisation is lagging expectations.
> Société Générale’s hyperscaler classification encompasses 15 companies: Amazon, Alphabet, Meta, Microsoft, Alibaba, Tencent, Oracle, Baidu, IBM, CoreWeave, Nebius, Salesforce, China Mobile, China Telecom, and China Unicom. This global scope reflects the worldwide scale of AI infrastructure investment.
When big ASX news breaks, our subscribers know first
SocGen’s Warning: Free Cash Flow Deterioration Signals Caution
Manish Kabra serves as Société Générale’s chief US equity strategist and has positioned himself against consensus by recommending that investors exercise patience before adding aggressive technology exposure. His analysis centres on timing rather than sector pessimism, with early 2027 identified as a more attractive entry window based on fundamental inflection points.
Aggregate free cash flow among hyperscalers has declined on a quarterly basis since early 2024, according to Kabra’s analysis. This deterioration reflects the enormous capital requirements of building AI infrastructure—data centres, custom silicon, networking equipment—whilst revenue from these investments remains in early stages. The gap between heavy spending and realised returns has widened throughout 2024 and into 2025.
When companies fail to meet cash flow expectations, markets often react severely—as demonstrated by severe market reactions to free cash flow disappointments that resulted in double-digit share price declines across multiple sectors in recent months. This historical pattern underscores why Kabra views deteriorating hyperscaler cash flow as a critical warning signal.
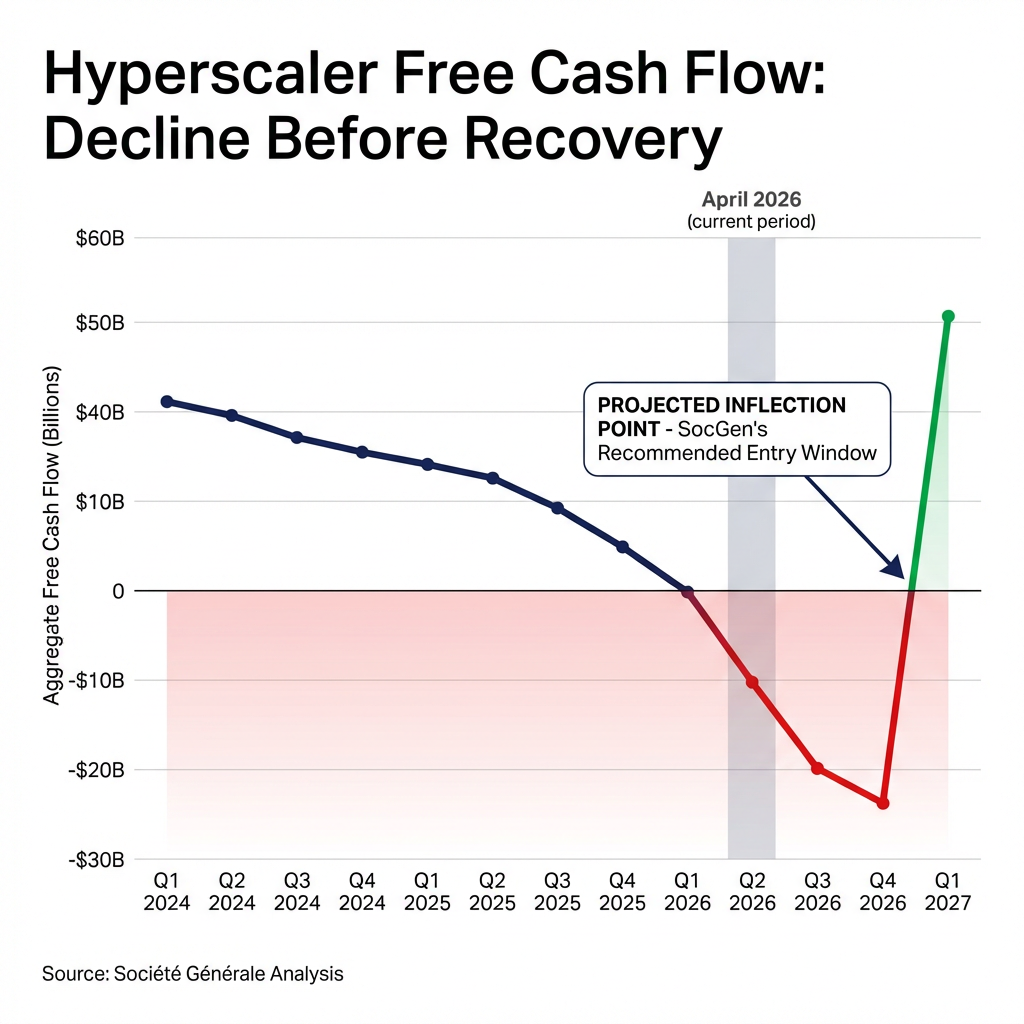
> Kabra projects that hyperscaler free cash flow will turn negative by year-end 2026 before reversing to positive territory in Q1 2027. He has stated that a positive free cash flow inflection would generate a strongly bullish outlook for technology equities, establishing this metric as his primary catalyst for recommending re-entry.
The $600 Billion Question: AI Capex vs Revenue Generation
Kabra characterises the capital expenditure-to-sales ratio as the single most critical indicator to track for technology sector health. Investor frustration mounted during the prior year over unclear artificial intelligence monetisation paths, with many questioning when massive infrastructure investments would translate to proportional revenue growth. This metric directly addresses that concern by measuring whether spending intensity is moderating as revenue scales.
Kabra’s concerns about the gap between heavy AI infrastructure spending and realised returns echo broader institutional concerns about AI monetisation timelines that have emerged across Wall Street in 2026. These worries extend beyond individual strategists to encompass systemic questions about return on invested capital.
Hyperscalers are projected to invest approximately $600 billion in AI infrastructure during 2026, roughly double their combined 2025 expenditure. The table below details capital spending progression across the four largest US-based hyperscalers:
| Company | 2024 Capex | 2025 Capex | 2026 Projected |
|---|---|---|---|
| Amazon | $78.2B | $131.8B | ~$200B |
| Alphabet | $52.0B | $91.5B | ~$175B |
| Meta | $39.2B | $72.2B | ~$115B |
| Microsoft | $44.5B | $64.6B | ~$97.7B |
These investments must eventually generate proportional revenue growth to justify current valuations and maintain investor confidence. Kabra expects meaningful improvement in capital expenditure-to-sales ratios by Q1 2027 as earlier investments begin generating revenue whilst new spending moderates, creating the fundamental inflection he views as the optimal re-entry signal.
Why S&P 500 May Struggle at 7,000 With Tech as Anchor
Technology represents approximately 32% of the market capitalisation-weighted S&P 500, making the index heavily dependent on technology sector performance. When technology stocks face fundamental headwinds, the broader index encounters difficulty advancing regardless of strength in other sectors. This concentration risk has intensified over recent years as mega-cap technology companies have grown to dominate index weightings.
Kabra believes the cap-weighted S&P 500 will struggle to surpass 7,000 sustainably given technology’s fundamental challenges. The free cash flow deterioration and elevated capital expenditure ratios discussed earlier suggest that technology’s foundation may prove fragile at current valuations. If hyperscalers disappoint on monetisation timelines or if spending continues escalating without proportional returns, the index’s largest constituents could face multiple compression.
Stephanie Guild of Robinhood has suggested that market gains may rotate “less in the Magnificent Seven stocks and more in the optical technology space,” indicating that even within technology, leadership may broaden or shift away from the dominant mega-cap names. This potential rotation would reduce concentration risk but could also signal that the drivers of recent outperformance are maturing.
Alternative Positioning: The Equal-Weight S&P 500 Case
Kabra recommends the equal-weighted S&P 500 as a preferable vehicle for investors seeking broad market participation without heavy technology exposure. This version of the index assigns each constituent company equal influence regardless of market capitalisation, dramatically reducing concentration in mega-cap technology stocks. Where technology represents 32% of the cap-weighted index, it holds far less weight in equal-weighted construction.
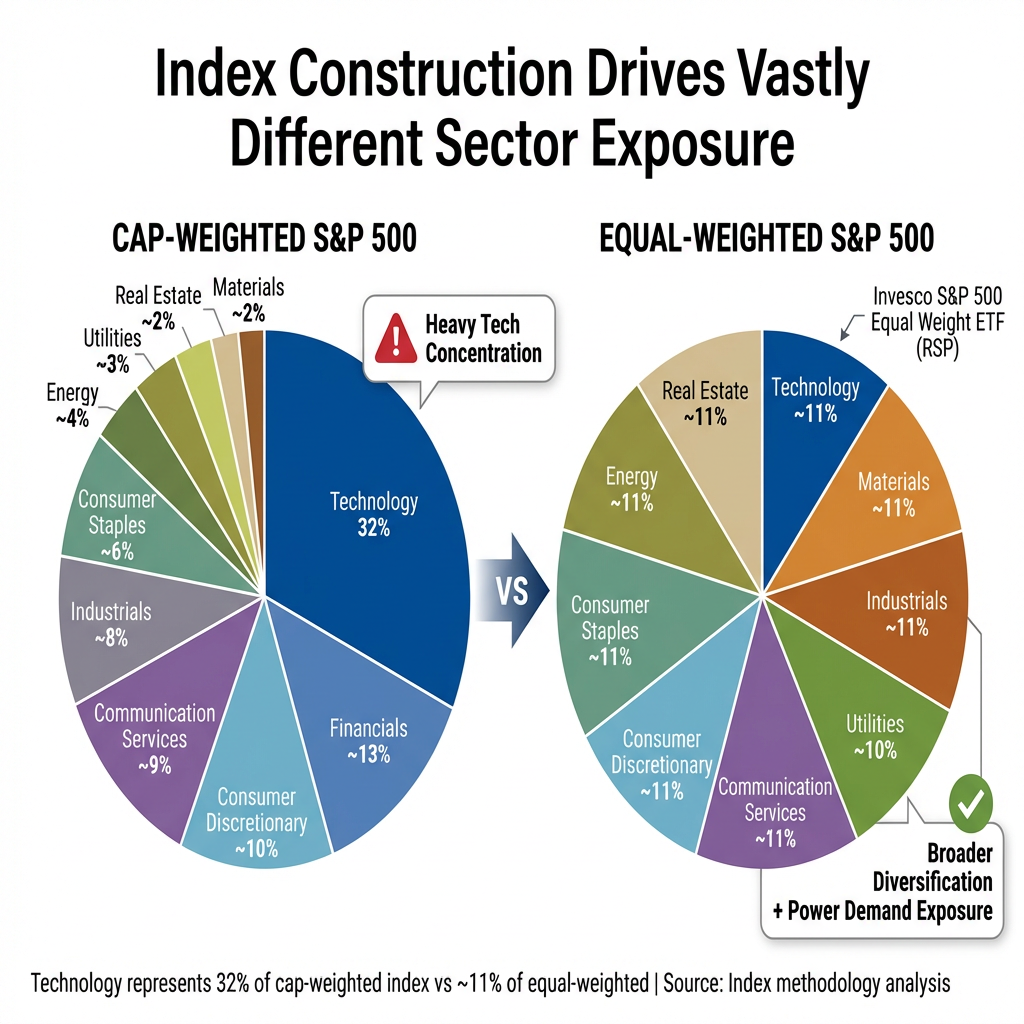
The equal-weighted S&P 500 tilts toward materials, industrials, and utilities sectors that benefit from elevated US power demand driven partly by AI infrastructure buildout. Data centre expansion requires substantial electrical capacity, creating tailwinds for utilities and related infrastructure regardless of whether technology stocks reward investors. Kabra has described the equal-weighted index as the closest available proxy for US nominal growth, suggesting it better captures broad economic activity than cap-weighted alternatives.
The utilities and infrastructure sectors are experiencing concrete data centre infrastructure demand, with providers securing record contract volumes that validate the physical infrastructure requirements of AI deployment regardless of software monetisation timelines.
The Invesco S&P 500 Equal Weight ETF (RSP) provides accessible exposure to this strategy. Investors concerned about technology concentration but unwilling to abandon US equity exposure entirely may find this approach aligns with Kabra’s thesis of waiting for technology fundamentals to inflect before adding aggressive sector-specific positions.
The next major ASX story will hit our subscribers first
Key Takeaways for Tech Investors in 2026
The technology rally from late March through mid-April 2026 was legitimate and supported by tangible catalysts. XLK’s 18% gain, Nasdaq records, TSMC’s strong guidance projecting more than 30% revenue growth, and the supportive macroeconomic backdrop of 178,000 jobs added in March all represent real developments. Many investors profited by purchasing during the earlier correction, and the rally’s technical strength cannot be dismissed.
TSMC’s strong guidance projecting more than 30% revenue growth for 2026 triggered optimism across global semiconductor market responses to TSMC’s outlook, with AI chip stocks in multiple geographies rallying on the Taiwan-based manufacturer’s bullish forecast.
Investors monitoring the technology sector going forward should track several key indicators:
- Hyperscaler free cash flow trajectory: Watch quarterly reports through Q4 2026 earnings for signs of stabilisation or improvement in aggregate free cash flow
- Capital expenditure-to-revenue ratios: Assess whether upcoming quarterly reports show moderation in spending intensity relative to revenue growth
- S&P 500 technical levels: Monitor whether the index can sustainably hold above 7,000 or if technology weakness pulls it back below this milestone
- AI monetisation progress: Scrutinise hyperscaler earnings calls for concrete revenue attribution to artificial intelligence products and services
SocGen’s cautious perspective represents one institutional view rather than Wall Street consensus. For long-term investors focused on entry points rather than momentum, Q1 2027 represents a specific milestone to watch for fundamental confirmation of the AI investment thesis. The projected free cash flow inflection and capital expenditure ratio improvement during that quarter could validate current valuations or expose them as premature.
Frequently Asked Questions About the Tech Stock Rally
How much has the tech sector gained in the recent rally?
The Technology Select Sector SPDR Fund (XLK) gained 18% from 30 March through mid-April 2026, whilst the Nasdaq Composite reached new record highs during this period. The S&P 500 crossed 7,000 for the first time at close on 16 April 2026, marking a historic milestone for the broader market.
Why is SocGen recommending investors wait until 2027 to buy tech stocks?
Société Générale’s analysis centres on two key fundamental metrics. First, hyperscaler free cash flow has been deteriorating quarterly since early 2024 and is projected to turn negative by late 2026 before recovering in Q1 2027. Second, capital expenditure-to-revenue ratios remain elevated with approximately $600 billion in 2026 AI spending yet to show proportional returns. The bank views Q1 2027 as the likely inflection point when these metrics improve.
What is the equal-weighted S&P 500 and why does SocGen prefer it?
The equal-weighted S&P 500 assigns each constituent company the same influence regardless of market capitalisation, contrasting with the cap-weighted version where larger companies dominate index performance. Technology represents approximately 32% of the cap-weighted S&P 500 but holds far less weight in equal-weighted construction. SocGen prefers this approach because it tilts toward materials, industrials, and utilities sectors benefiting from elevated US power demand whilst reducing exposure to technology concentration risk.
What catalysts supported the recent tech rally?
Several developments converged to support the technology rally: TSMC raised its 2026 sales guidance to more than 30% growth, signalling strong AI infrastructure demand; March employment data showed 178,000 jobs added, reinforcing economic confidence; the US-Iran ceasefire agreement announced by 8 April reduced geopolitical risk premiums; and improved corporate guidance across multiple sectors bolstered broader sentiment beyond technology alone.
This article is for informational purposes only and should not be considered financial advice. Investors should conduct their own research and consult with financial professionals before making investment decisions.
Frequently Asked Questions
What triggered the recent tech stock rally in 2026?
The tech stock rally was driven by TSMC raising its 2026 sales growth forecast above 30%, strong US employment data showing 178,000 jobs added in March, a US-Iran ceasefire reducing geopolitical risk premiums, and broad corporate guidance upgrades across multiple sectors.
What is hyperscaler free cash flow and why does it matter for tech investors?
Hyperscaler free cash flow is the cash remaining after the largest cloud and AI infrastructure companies cover operating expenses and capital investments — it matters because deteriorating free cash flow signals that massive AI spending is outpacing revenue generation, raising concerns about return on invested capital.
Why is Société Générale recommending investors wait until 2027 before buying tech stocks?
SocGen's Manish Kabra projects hyperscaler free cash flow will turn negative by late 2026 before recovering in Q1 2027, and capital expenditure-to-revenue ratios remain elevated with roughly $600 billion in AI spending yet to show proportional returns, making early 2027 the projected fundamental inflection point.
What is the equal-weighted S&P 500 and how does it reduce tech concentration risk?
The equal-weighted S&P 500 assigns every constituent the same index influence regardless of market cap, reducing technology's roughly 32% dominance in the cap-weighted version and tilting exposure toward materials, industrials, and utilities sectors benefiting from AI infrastructure buildout demand.
How high did the S&P 500 climb during the April 2026 tech stock rally?
The S&P 500 crossed the historic 7,000 threshold for the first time at close on 16 April 2026, while the Technology Select Sector SPDR Fund XLK gained 18% from 30 March through mid-April and the Nasdaq Composite reached new record highs.