
Finbar delivers 41% profit lift and record sales in FY26 results
Finbar Group (ASX: FRI) delivered its FY26 full year financial results on 20 August 2026, reporting net profit after tax (NPAT) of $20.3M, up 40.9% on the prior year despite a decline in revenue.
The standout of the year ended 30 June 2026 was a record $528.8M in sales value, up 124%, achieved even as revenue fell, signalling a strengthening base for future earnings.
Headline figures for the completed FY26 period included:
- NPAT of $20.3M
- Earnings per share (EPS) of 7.44c, up 40%
- Gross profit margin of 20.2%, up from 12.1%
- A full year dividend of 5.5c, which includes a 3c fully franked final dividend
Profitability and sales momentum both advanced while the balance sheet strengthened, marking a quality-over-volume year for the Western Australian apartment developer.
When big ASX news breaks, our subscribers know first
FY26 financial results: margin expansion drives profit growth
The results reflected an apparent paradox. Revenue fell 28% to $204.3M, yet NPAT rose 41%, a result driven by margin expansion and cost discipline rather than sales volume.
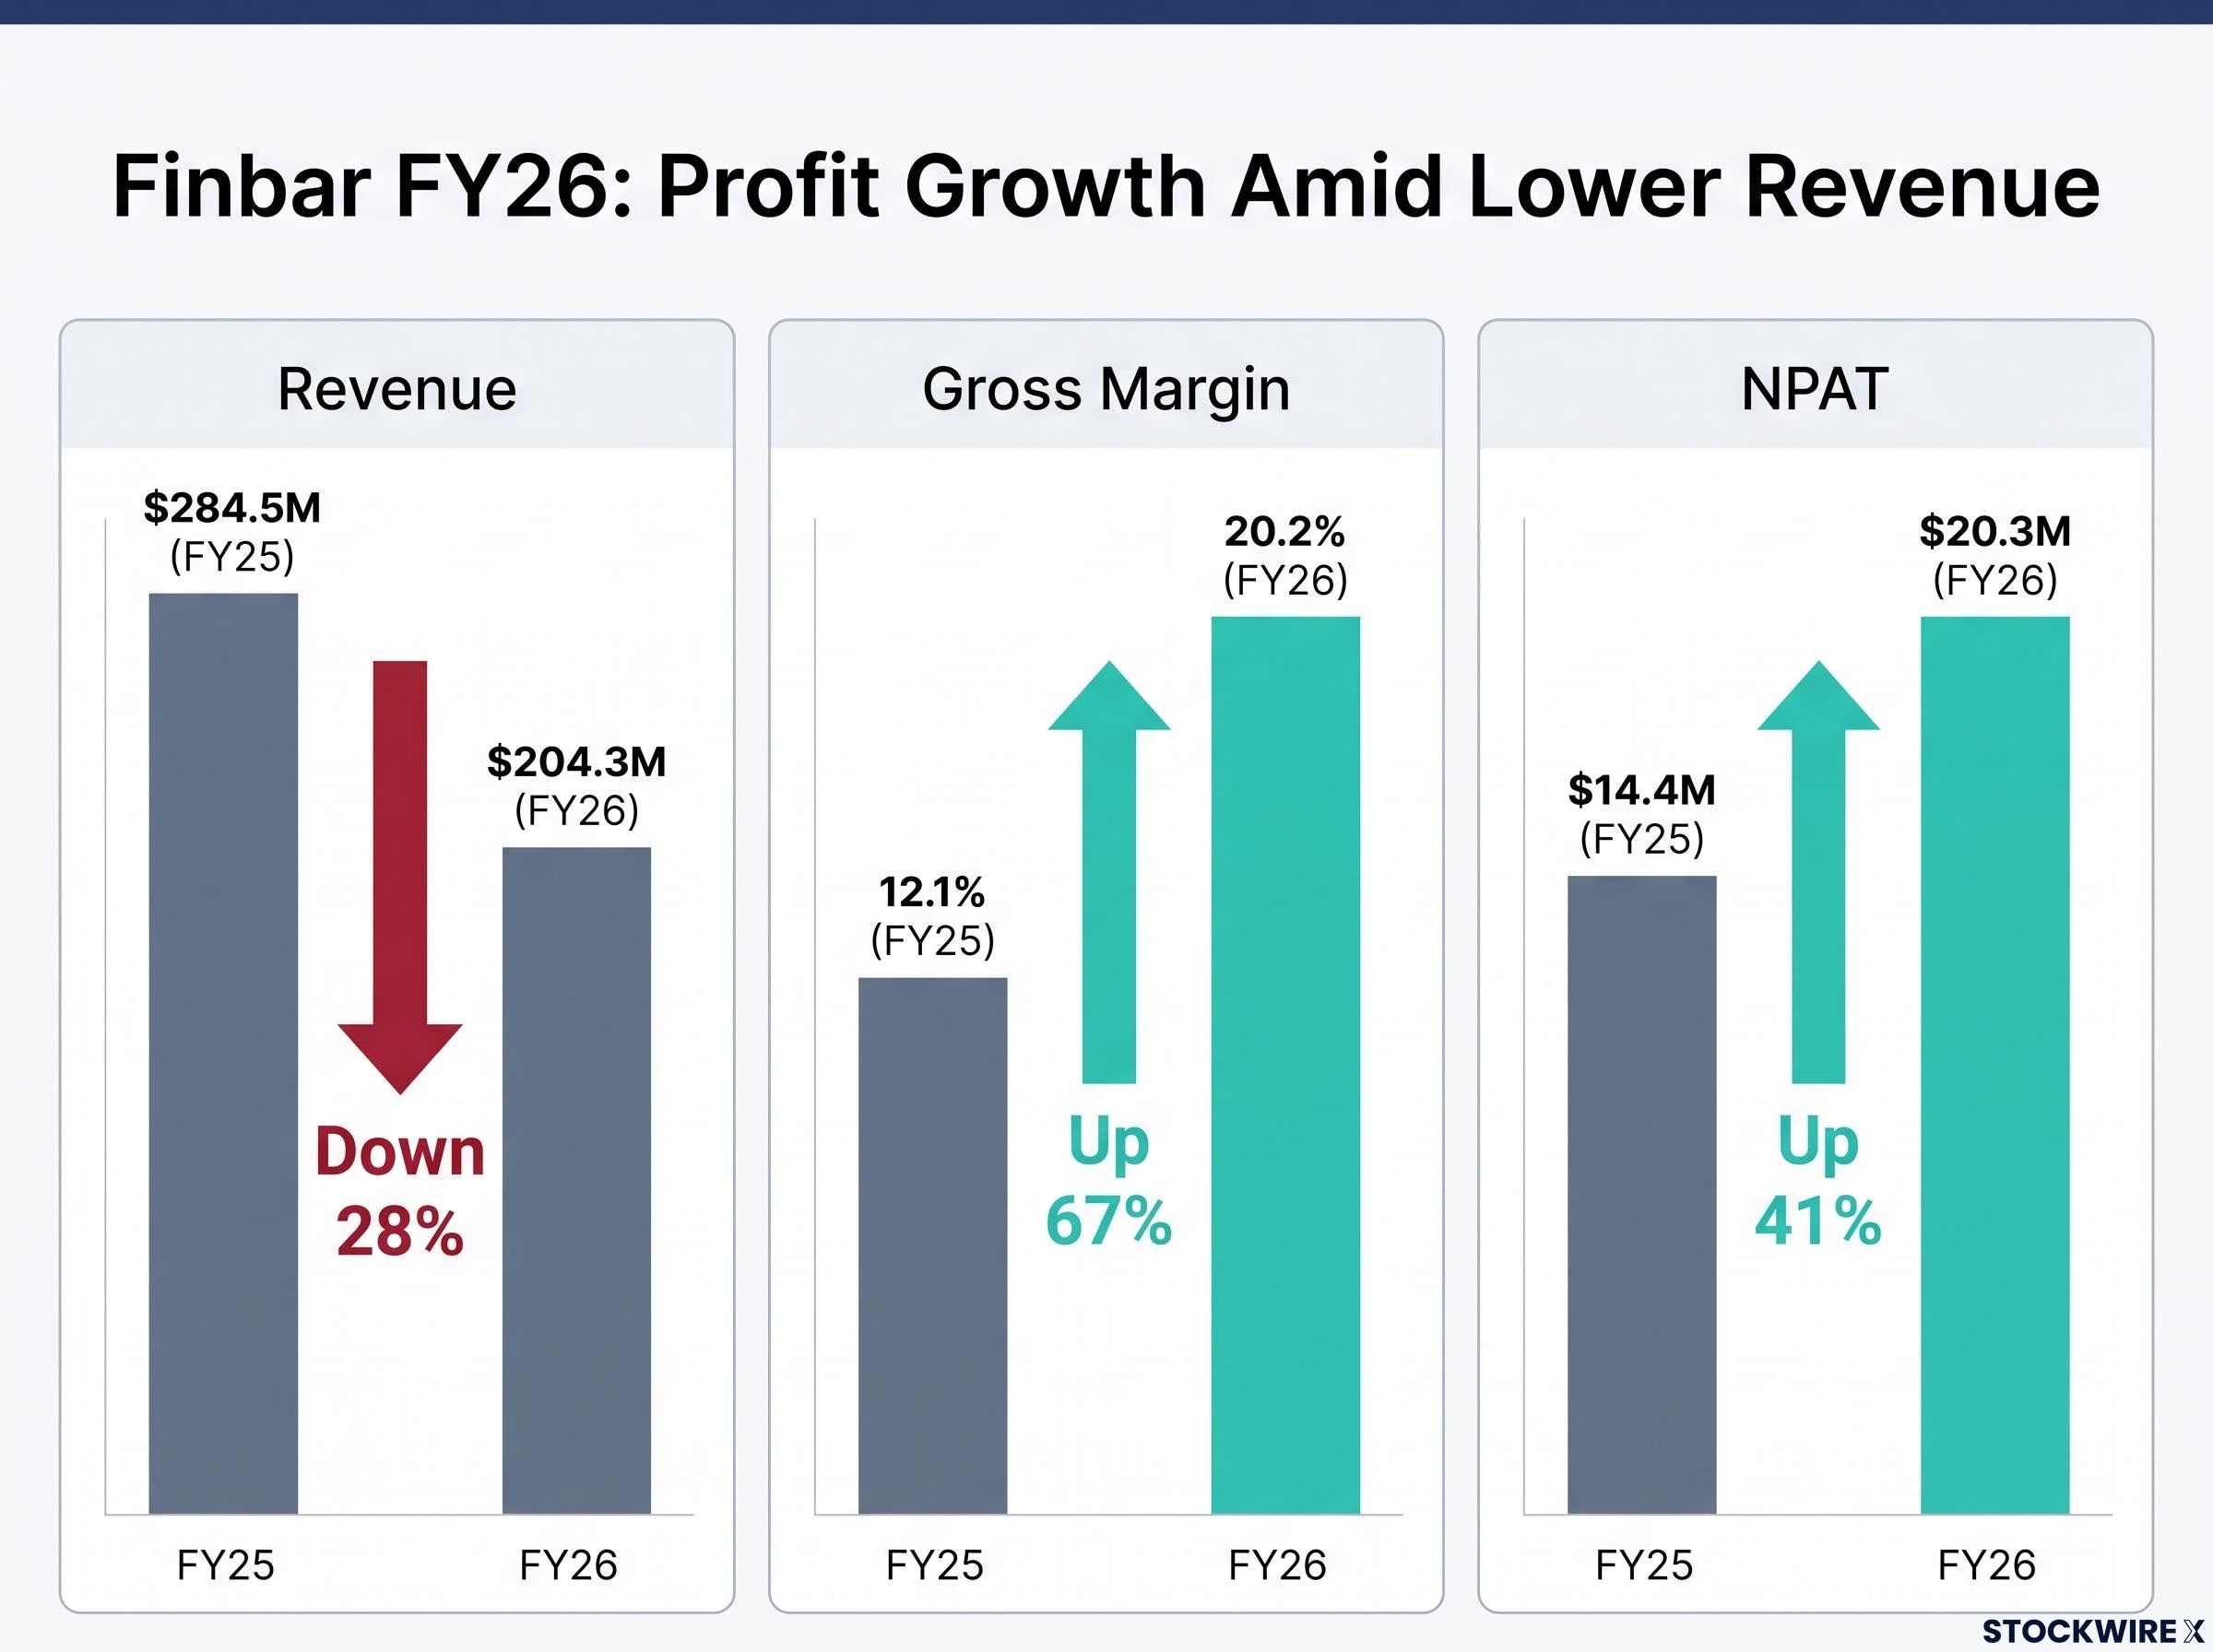
The revenue decline was attributed to Bel-Air’s more affordable product mix and the sell-down of completed stock, compared with the prior year’s completions of Aurora and The Point. Profit growth was underpinned by gross margin lifting to 20.2% from 12.1%, lower overheads following business restructuring, and improved finance income from higher cash reserves and better interest rates.
The FY26 full year result builds directly on momentum established in the H1 FY26 results, which recorded $368 million in sales across 409 lots and saw cash nearly double to $69 million as bank debt fell 39%.
Underlying NPAT, which removes the impact of yearly variation in the valuation of the property portfolio, came in at $22.1M, up 36.5%.
| Metric | FY26 | FY25 | Variance |
|---|---|---|---|
| Revenue | $204.3M | $284.5M | (28%) |
| Gross Profit | $41.2M | $34.4M | +20% |
| Gross Margin | 20.2% | 12.1% | — |
| Operating Profit | $27.5M | $21.3M | +29% |
| NPAT | $20.3M | $14.4M | +41% |
| EPS | 7.44c | 5.28c | +40% |
A fortress balance sheet: debt slashed 72%
Balance sheet strengthening formed the second key story of FY26, with the developer materially reducing borrowings while building liquidity.
- Borrowings cut to $13.9M, down 72.4% from $50.3M
- Cash and term deposits of $50.7M, up 39%
- NTA per share of 94.5c, up 3%
- Net assets of $257.1M
After the reporting period, in July 2026, the remaining $5.5M loan on Bel-Air was fully repaid. According to the company, this strong liquidity positions the Group to pursue additional new land acquisition opportunities and fund upfront project equity for its growing pipeline.
The Bel-Air completion in June 2026 was the pivotal settlement event underpinning FY26 revenue recognition, with 193 of 194 apartments sold at a 99.5% sellout rate delivering $113.4 million in contracted sales into the reporting period.
Sales momentum: record year points to future earnings
Sales strength provided the forward-looking engine of the FY26 result. The company recorded 566 lots sold worth a record $528.8M, up 124%, alongside pre-sales of $567.2M, up 92.8%.
Settlements totalled 287 lots valued at $263.7M, while projects under construction represented 615 lots with an end value of $515.1M. Three projects launched during the year carried a combined value of $411M and were 80% sold.
Sales and pre-sales convert to revenue at settlement on project completion. Today’s record sales therefore seed the revenue and profit of future reporting periods rather than the year in which they are contracted.
| Metric | FY26 | FY25 | Change |
|---|---|---|---|
| Sales value | $528.8M | $236M | +124% |
| Pre-sales | $567.2M | $294.1M | +92.8% |
| Settlements value | $263.7M | $352M | (25.1%) |
| Under construction | $515.1M | $391M | +31.7% |
Understanding the developer model: why pre-sales matter
For an apartment developer, revenue is recognised at settlement when projects complete, not at the point a sale is made. Pre-sales are contracted buyers locked in before or during construction, ahead of that settlement.
Why does this matter to investors? High pre-sales help de-risk projects by supporting funding and providing demand certainty, while offering visibility into future revenue. A record sales year alongside lower current revenue signals that earnings are building for future periods.
Finbar’s 100% project delivery success rate and 31 consecutive years of profit provide a track record of execution reliability underpinning that pipeline.
The $1.8 billion pipeline and five-year growth roadmap
The five-year development pipeline grew to $1.8B and 1,700+ lots, up from $1.0B and 1,300+ lots a year earlier. Key milestones across the delivery cadence include:
-
Garden Towers completion anticipated H1 FY27 ($296M, 342 units, 81% sold)
-
Romeo Applecross construction commencing September 2026, in H1 FY27
-
Riverbank Residences and Palmyra West completions anticipated H1 FY28
-
Parkside Residences and Leeder Residences pre-sales commencing H1 FY27
Buyer profile shifts reinforced the mid-market positioning. Repeat buyers reached 28% in CY26 to-date, driven by the Finbar Loyalty Club and brand capital, while first home buyers represented 14% in H1 CY2026.
Market backdrop: WA leads the nation
The result was set against a supportive Western Australian environment.
- Perth dwelling values up 20.5% year-on-year to July 2026, versus 3.9% for the Combined Capitals
- WA population growth of 2.2%, the highest of all states, equating to around 975 people per week
- Apartment values up approximately 22.7% year-on-year versus around 18.0% for houses
- Apartment rents up approximately 8.1% year-on-year
The company cited tailwinds including strong interstate and overseas migration, structural housing undersupply, the 2026 federal budget Capital Gains and Negative Gearing tax reforms, and ongoing stamp duty concessions. Finbar’s mid-market apartment focus aligns with the fastest-growing, affordability-driven segment of the market.
FY26 takeaways
Record sales of $528.8 million in value sold to-date, up 124% over the previous year, combined with growing profitability and a materially strengthened balance sheet, seed future revenue for the periods ahead. Supported by a $1.8B pipeline and Western Australia’s leading market fundamentals, the year continued Finbar’s 31-year track record of profitability and 100% project delivery success.
Ready to Explore Finbar’s $1.8 Billion Development Pipeline?
Finbar Group’s FY26 results revealed a compelling combination of 41% profit growth, record $528.8M in sales, and a fortress balance sheet — all underpinned by Western Australia’s strongest property market fundamentals in the nation.
With $567.2M in pre-sales already contracted and Garden Towers set for completion in H1 FY27, explore Finbar Group’s full investor profile and project pipeline on StockWire X to assess what this 31-year profit track record could mean for your portfolio.