How Government Bonds Shape Your Mortgage, Pension and Economy
4 hrs ago

In 2022, the Bloomberg US Aggregate Bond Index posted its worst annual return in the index’s recorded history, losing 13.0%. Long-dated zero-coupon Treasury bonds fell 39.2%, a loss comparable to a severe equity bear market. Millions of retirement savers hold bond funds specifically to avoid that kind of outcome, yet the label “bond fund” reveals nothing about the risk embedded in the portfolio. One number on every fund fact sheet does: duration. It measures how much a bond fund’s price will move when interest rates change. Most investors have never checked it. What follows explains what bond duration is, how it translates directly into dollar losses when rates rise, why it caused the worst bond losses in roughly 268 years during the 2022 rate cycle, and what to look for on a fund fact sheet before assuming retirement savings are protected.
Duration measures a bond fund’s price sensitivity to interest-rate changes. It is not simply the time until the bonds in the fund mature. Instead, it consolidates maturity, coupon rate, yield, and call features into a single number, making it the most efficient gauge of interest-rate exposure available on any fund fact sheet.
A fund’s price changes by approximately its duration percentage for every 1 percentage-point move in interest rates, in the opposite direction. Duration of 6 means roughly 6% price decline per 1% rate rise.
The bond price and yield relationship is purely mathematical: because the coupon payment is fixed at issuance, a drop in the bond’s market price automatically lifts its effective yield, and a rise in price compresses it, which is precisely why every rate move translates so mechanically into fund price changes.
That rule of thumb translates into real money. A $500,000 investment in a fund with duration 6 loses approximately $30,000 from a single 1 percentage-point rate rise. A fund with duration 3 loses about half that. A fund with duration 8 loses considerably more.
| Fund Duration | Approx. Price Change (1% Rate Rise) | Approx. Price Change (2% Rate Rise) |
|---|---|---|
| 3 | -3% | -6% |
| 6 | -6% | -12% |
| 8 | -8% | -16% |
Duration appears on fund fact sheets under several labels. Look for any of these:
All three communicate the same core information: how much price risk the fund carries per unit of rate change. Retirement savers who have never examined this figure are making a risk decision they do not know they are making.
The losses came fast, and they came at a scale that had no modern precedent.
The Bloomberg US Aggregate Bond Index declined 13.0% in calendar year 2022, the worst annual performance since the index’s inception in 1976. Intermediate-term Treasuries, the bonds most commonly held in target-date retirement funds, fell 10.6%, the steepest decline since at least 1926. Long-dated zero-coupon Treasury bonds lost 39.2%.
A Santa Clara University analysis of historical asset returns identified 2022 as the worst year for long-duration US bonds since 1754, a span of approximately 268 years.
The cause was mechanical, not mysterious. The Federal Reserve raised rates from near zero to above 4% in approximately nine months, the fastest pace of rate increases in roughly four decades. Every percentage point of that move landed directly on bond fund prices, proportional to duration.
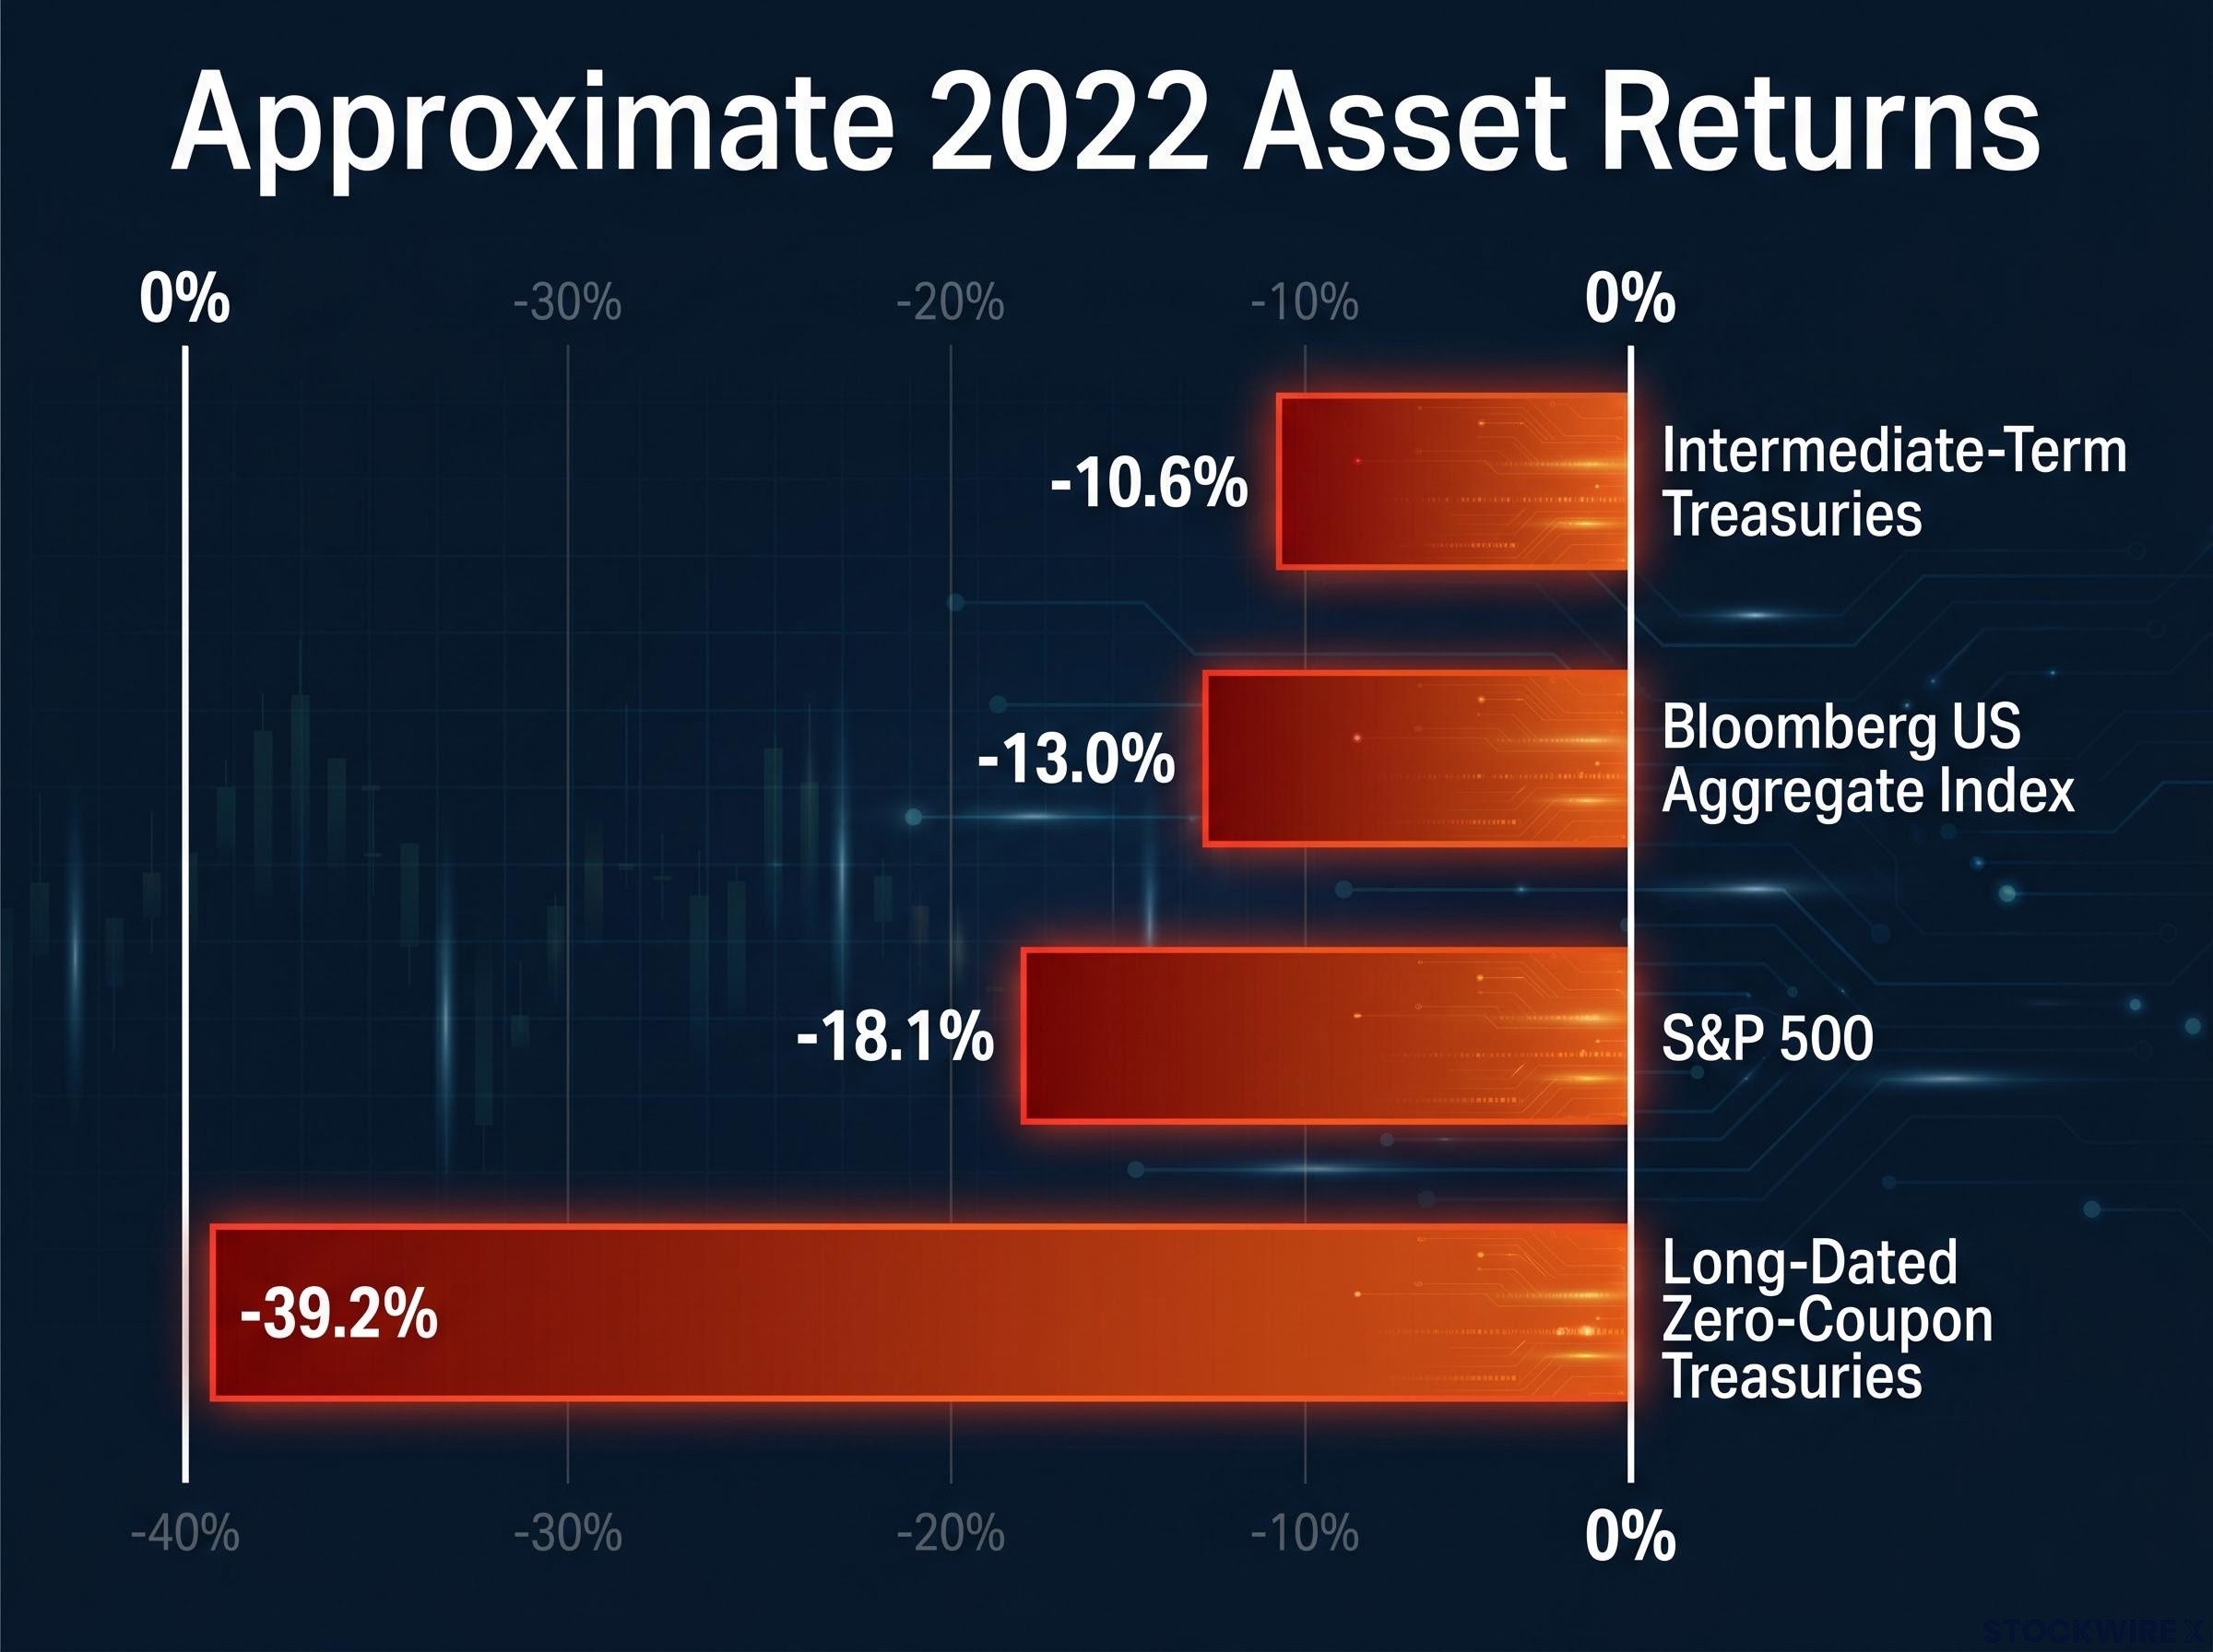
| Bond Category | Approx. 2022 Return | Approx. Typical Duration |
|---|---|---|
| Bloomberg US Aggregate Index | -13.0% | ~6 years |
| Intermediate-Term Treasuries | -10.6% | ~4-5 years |
| Long-Dated Zero-Coupon Treasuries | -39.2% | ~17+ years |
| S&P 500 (for comparison) | -18.1% | N/A |
The S&P 500 fell 18.1% that same year. A combined 60/40 US stock and bond portfolio lost approximately 16%. The protective function of that allocation depends on stocks and bonds moving in opposite directions; that relationship failed in 2022 because rising rates harmed both asset classes simultaneously.
The stock-bond correlation failure of 2022, when rising rates harmed both equities and fixed income simultaneously, exposed a structural assumption that had underpinned 40 years of portfolio construction: that bonds would reliably offset equity drawdowns regardless of the inflation regime driving markets.
Investors who shifted from stocks into “bonds” without examining duration experienced losses that felt like an equity bear market. That was not a random anomaly. It was duration working exactly as designed, at scale.
A common assumption is that duration simply tells investors when they get their money back. It does not. Maturity is the date a bond’s principal is returned. Duration accounts for all the cash flows, coupon payments plus the final principal repayment, weighted by when each one arrives. That makes it a more complete measure of a bond’s time-weighted sensitivity to rate changes.
Two bonds with identical maturity dates can carry very different durations. A high-coupon bond returns value sooner through frequent coupon payments, pulling its effective duration down. A low-coupon bond concentrates more of its value at the far end, pushing duration higher.
The three profiles illustrate the pattern:
General industry guidelines place the risk thresholds clearly. Duration above 7 carries meaningful interest-rate risk. Duration above 15 can produce equity-like price behaviour. On fund fact sheets, “effective duration” also accounts for embedded options such as call features, while “modified duration” captures price sensitivity for option-free bonds.
Zero-coupon bonds pay no interim interest. The investor receives nothing until the bond matures, which means all of the bond’s value is concentrated at a single future date. This structure pushes duration close to the bond’s final maturity, maximising its price sensitivity to rate changes.
That is why long-dated zero-coupon Treasuries lost 39.2% in 2022. Despite carrying the highest possible credit quality (US government backing), their extreme duration meant that a sharp rate cycle produced equity-scale losses. The credit was safe. The price was not. This distinction is the single most important concept for retirement investors to understand: credit quality and price stability are entirely separate dimensions of bond risk, and duration governs the latter.
An individual bond held to maturity insulates the investor from interim price swings. Coupons are received on schedule, and principal is returned at maturity regardless of what happened to market prices in between, assuming no default. The path of interest rates during the holding period is, for practical purposes, irrelevant to the final outcome.
A bond fund works differently. The fund never matures. It constantly buys and sells bonds to maintain a target duration, so its composition and price exposure change continuously. The share price is marked to market every day, meaning all rate-driven price changes hit the investor’s account immediately. There is no guaranteed return of principal.
“Credit-safe does not mean price-stable.”
The practical consequence: $300,000 in a fund with duration 8 loses approximately $24,000 from a 1 percentage-point rate rise. A 2-point rise would roughly double that to $48,000. Those losses are real and realised whenever shares are sold.
| Feature | Individual Bond (Held to Maturity) | Bond Fund |
|---|---|---|
| Maturity | Fixed date; principal returned | No maturity; fund rolls continuously |
| Principal Guarantee | Yes (assuming no default) | No; depends on market price at sale |
| Mark-to-Market Exposure | Irrelevant if held to maturity | Daily; all price changes are realised |
| Duration Behaviour | Declines as maturity approaches | Maintained at target through trading |
Holding a bond fund longer does allow higher yields to gradually offset past price declines. But there is no automatic reversion to a purchase price the way a single bond reverts to par at maturity. Many retirement investors chose bond funds for convenience and assumed the risk profile was equivalent. This section clarifies why that assumption is incorrect, particularly for money needed in the near term.
The calculation takes less than five minutes and uses information every fund is required to disclose. The steps are straightforward:
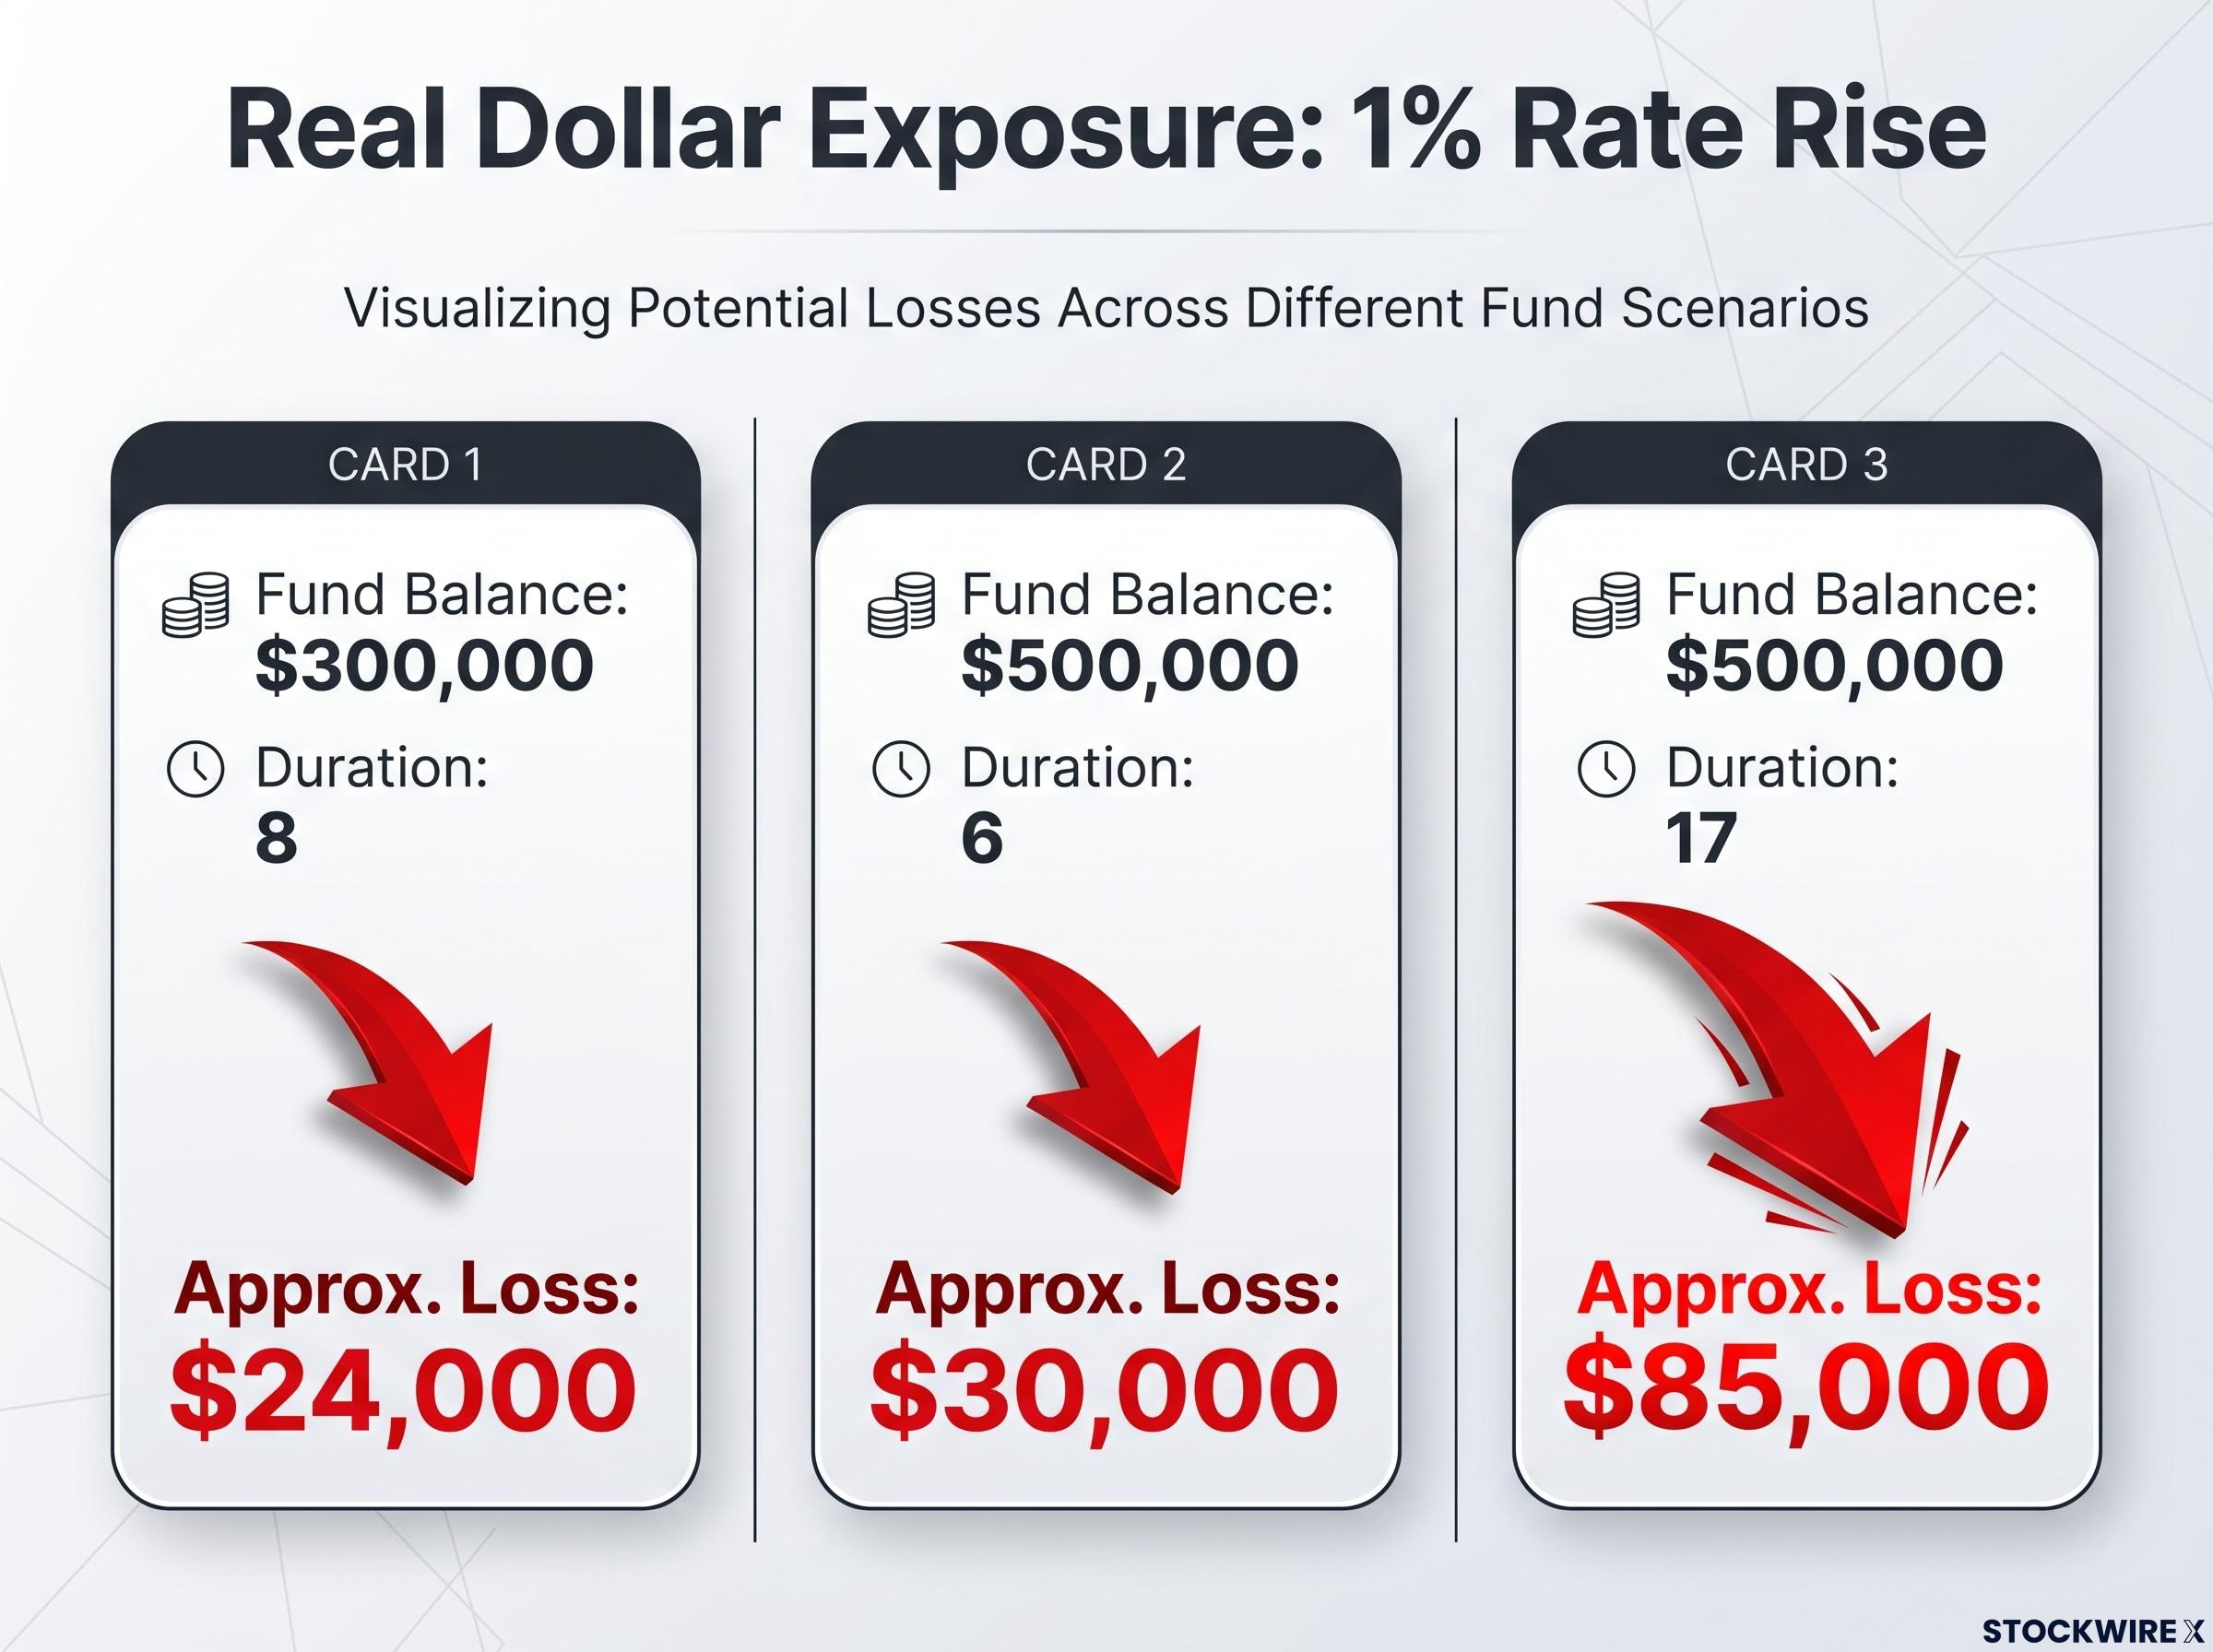
| Fund Balance | Duration | Approx. Loss (1% Rate Rise) | Approx. Loss (2% Rate Rise) |
|---|---|---|---|
| $300,000 | 8 | $24,000 | $48,000 |
| $500,000 | 6 | $30,000 | $60,000 |
| $500,000 | 17 | $85,000 | $170,000 |
The difference between a duration-6 fund and a duration-17 fund on the same $500,000 investment is approximately $55,000 of additional loss from a single 1 percentage-point rate move. Both funds are labelled “bonds.”
One area that catches many retirement savers: target-date and “conservative” funds. The retirement date in the fund name does not guarantee low duration. Many such funds hold substantial intermediate-term bonds that push overall duration into the mid-single digits or higher. The fact sheet, not the marketing label, provides the answer.
Retirement allocation heuristics such as the ‘100 minus age’ rule were designed for shorter lifespans and much simpler market structures, and they share the same fundamental flaw as an unexamined bond fund label: both encourage investors to believe the portfolio is appropriately positioned without verifying what that actually means in practice.
For capital preservation goals with a 3-5 year spending horizon, many investors favour shorter-duration funds (duration 2-4) and accept lower yield in exchange for reduced price risk. Shifting a portion of the bond allocation toward shorter-duration funds reduces price sensitivity without exiting fixed income entirely.
Another approach is laddering duration across short, intermediate, and longer-term sleeves to match actual spending needs rather than holding a single broad index. A short-term sleeve covers near-term withdrawals with minimal price risk. An intermediate sleeve captures somewhat higher yield. A smaller long-duration sleeve, held intentionally, adds rate sensitivity only where the investor has a long enough time horizon to absorb the volatility.
Any reallocation decision should account for tax implications, particularly in taxable accounts where selling bond fund shares may trigger capital gains or losses. Where appropriate, professional financial guidance can help structure the transition.
For investors who have calculated their duration exposure and want a structured framework for what to do next, our dedicated guide to bond portfolio management in a normalised rate environment covers how BlackRock, PIMCO, Vanguard, and J.P. Morgan Asset Management are positioning duration in 2026, with specific guidance on the 1-5 year curve segment and the instruments available for shortening rate sensitivity without exiting fixed income.
Duration risk does not disappear when rates stabilise. It remains embedded in every bond fund and will affect the portfolio whenever the rate environment shifts again, in either direction. The 2022 precedent is instructive: investors who did not check duration before the rate cycle had no warning that their “safe” funds carried equity-scale downside.
The trade-off is straightforward. Lower-duration funds typically offer lower yields. This is a deliberate, informed choice, not a failure. The investor who accepts a smaller coupon in exchange for reduced price sensitivity is making an active risk decision. The investor who holds high duration without knowing it is making the same risk decision, just unconsciously.
The practical thresholds bear repeating. Duration above 7 carries meaningful rate risk. Duration above 15 can produce equity-like drawdowns. On the same $500,000 investment, the difference between duration 6 and duration 17 is approximately $55,000 in losses from a single 1 percentage-point rate move.
Three ongoing habits keep duration risk visible:
The duration figure on a fund fact sheet tells a retirement investor more about real risk than any marketing label, risk score, or target date.
The marketing name tells investors what the fund wants to be called. The duration figure tells them what it will actually do when rates move. For retirement savings, that distinction is the one that matters.
This article is for informational purposes only and should not be considered financial advice. Investors should conduct their own research and consult with financial professionals before making investment decisions. Past performance does not guarantee future results. Financial projections are subject to market conditions and various risk factors.
Bond duration measures how sensitive a bond fund's price is to changes in interest rates. A fund with a duration of 6 means its price will fall approximately 6% for every 1 percentage-point rise in interest rates.
Visit your fund provider's website (such as Vanguard, Fidelity, or Schwab), locate the portfolio characteristics section of the fund fact sheet, and look for a figure labelled 'duration,' 'effective duration,' or 'modified duration.'
The Federal Reserve raised interest rates from near zero to above 4% in approximately nine months, the fastest pace in roughly four decades. Because bond fund prices fall in proportion to their duration when rates rise, funds with higher duration suffered the largest losses, with long-dated zero-coupon Treasuries falling 39.2%.
Maturity is simply the date a bond's principal is repaid, while duration accounts for all cash flows including coupon payments weighted by when they arrive. Two bonds with the same maturity date can carry very different durations depending on their coupon rates.
Multiply your current account balance by the fund's duration expressed as a decimal. For example, a $500,000 investment in a fund with duration 6 would lose approximately $30,000 from a single 1 percentage-point rise in interest rates.