Why Franking Credits Change Every NAB Dividend Discount Model
9 hrs ago

The same methodology institutional analysts use to value Australia’s major banks can be applied by any retail investor with three numbers and a calculator. Westpac Banking Corp (ASX: WBC) was trading at approximately $36.55 in late May 2026, making it one of the most actively traded securities on the ASX. For income-focused investors, knowing whether that price represents fair value requires more than a yield calculation. The Dividend Discount Model (DDM), a structured framework built on a stock’s own dividend history and a set of justifiable assumptions, provides one disciplined way to answer that question. This guide walks through every step of a DDM valuation for WBC using real May 2026 data, explains how to run sensitivity scenarios that reveal the model’s true output range, and shows how eligible Australian shareholders can incorporate franking credits into the calculation.
A single formula that spits out a stock’s fair value sounds too neat to be useful. That scepticism is warranted for most companies, but the DDM works differently for mature, dividend-stable businesses where the assumptions behind the formula are less of a stretch.
The core idea is a present-value concept: a stock is worth the sum of all its future dividends, discounted back to today’s dollars. For a company whose dividends grow at a roughly steady rate, that infinite series collapses into a single expression known as the Gordon Growth Model.
The DDM formula (Gordon Growth Model): Share price = D1 ÷ (r − g)
In plain English: next year’s expected dividend, divided by the gap between the required return and the long-term dividend growth rate.
Three inputs are required:
Australian major banks are a strong fit for this model. Predictable payout ratios, fully franked dividends, and operating histories stretching back more than a century make the DDM’s assumption of stable, ongoing payouts less heroic than it would be for a growth-stage technology company. Institutional analysts at firms such as Morningstar use more complex frameworks, primarily excess-returns DCF models, as Nathan Zaia’s coverage of Westpac illustrates. DDMs, however, are widely used by income-focused analysts and retail investors as a cross-check valuation, and that is the role this guide prepares the reader to fill.
Each input in the DDM is a decision, not simply a fact to be looked up. The valuation output is only as reliable as the assumptions behind it, so understanding where each number comes from, and the range of defensible alternatives, matters more than memorising a single figure.
Dividend (D0). Two options are available. The confirmed FY25 full-year dividend per share (DPS) was 153 cents per share, fully franked (76 cents interim paid June 2025, 77 cents final paid December 2025). The 2026 interim dividend, declared 5 May 2026, is 77 cents per share (fully franked), payable 26 June 2026. Annualising the 2026 interim would imply 154 cents, but since only the interim is confirmed, using the full confirmed FY25 figure of $1.53 as D0 provides a more conservative and fully verified starting point.
Discount rate (r). This represents the return required to justify holding WBC rather than a risk-free alternative. Nathan Zaia at Morningstar uses a cost of equity of approximately 9% for Westpac specifically, as outlined in his March 2025 analysis. AFR broker summaries compiled by James Thomson cite a consensus range of 9-10% across the major banks. For the base case, 9% serves as the central assumption.
The growth rate is the most sensitive and most debated input. A small shift here changes the output dramatically, because it sits in the denominator alongside the discount rate.
Andrew Mitchell of Ophir Asset Management, speaking on Livewire Markets, discussed long-term dividend growth of approximately 3% for the major banks once credit growth and margins normalise. Morningstar’s Nathan Zaia assumes low-single-digit growth of around 3% beyond his explicit forecast period. The 3% figure roughly tracks nominal GDP growth and acknowledges that payout ratios are already at the high end of sustainable ranges, according to AFR reporting by James Thomson.
One simplification to note: analysts expect flat or modest dividends over the near term before growth resumes, so a single-stage DDM using 3% growth from day one slightly overstates the near-term trajectory.
| Input | Conservative assumption | Central assumption |
|---|---|---|
| Dividend (D0) | $1.53 (FY25 confirmed) | $1.53 (FY25 confirmed) |
| Discount rate (r) | 10% | 9% |
| Growth rate (g) | 2.5% | 3% |
With the three inputs selected, the calculation itself takes four steps. Each one is shown explicitly so the reader can replicate the process in a spreadsheet or on paper.
At $1.53 DPS, a 9% discount rate, and 3% growth, the DDM implies a fair value of approximately $26.27 per share.
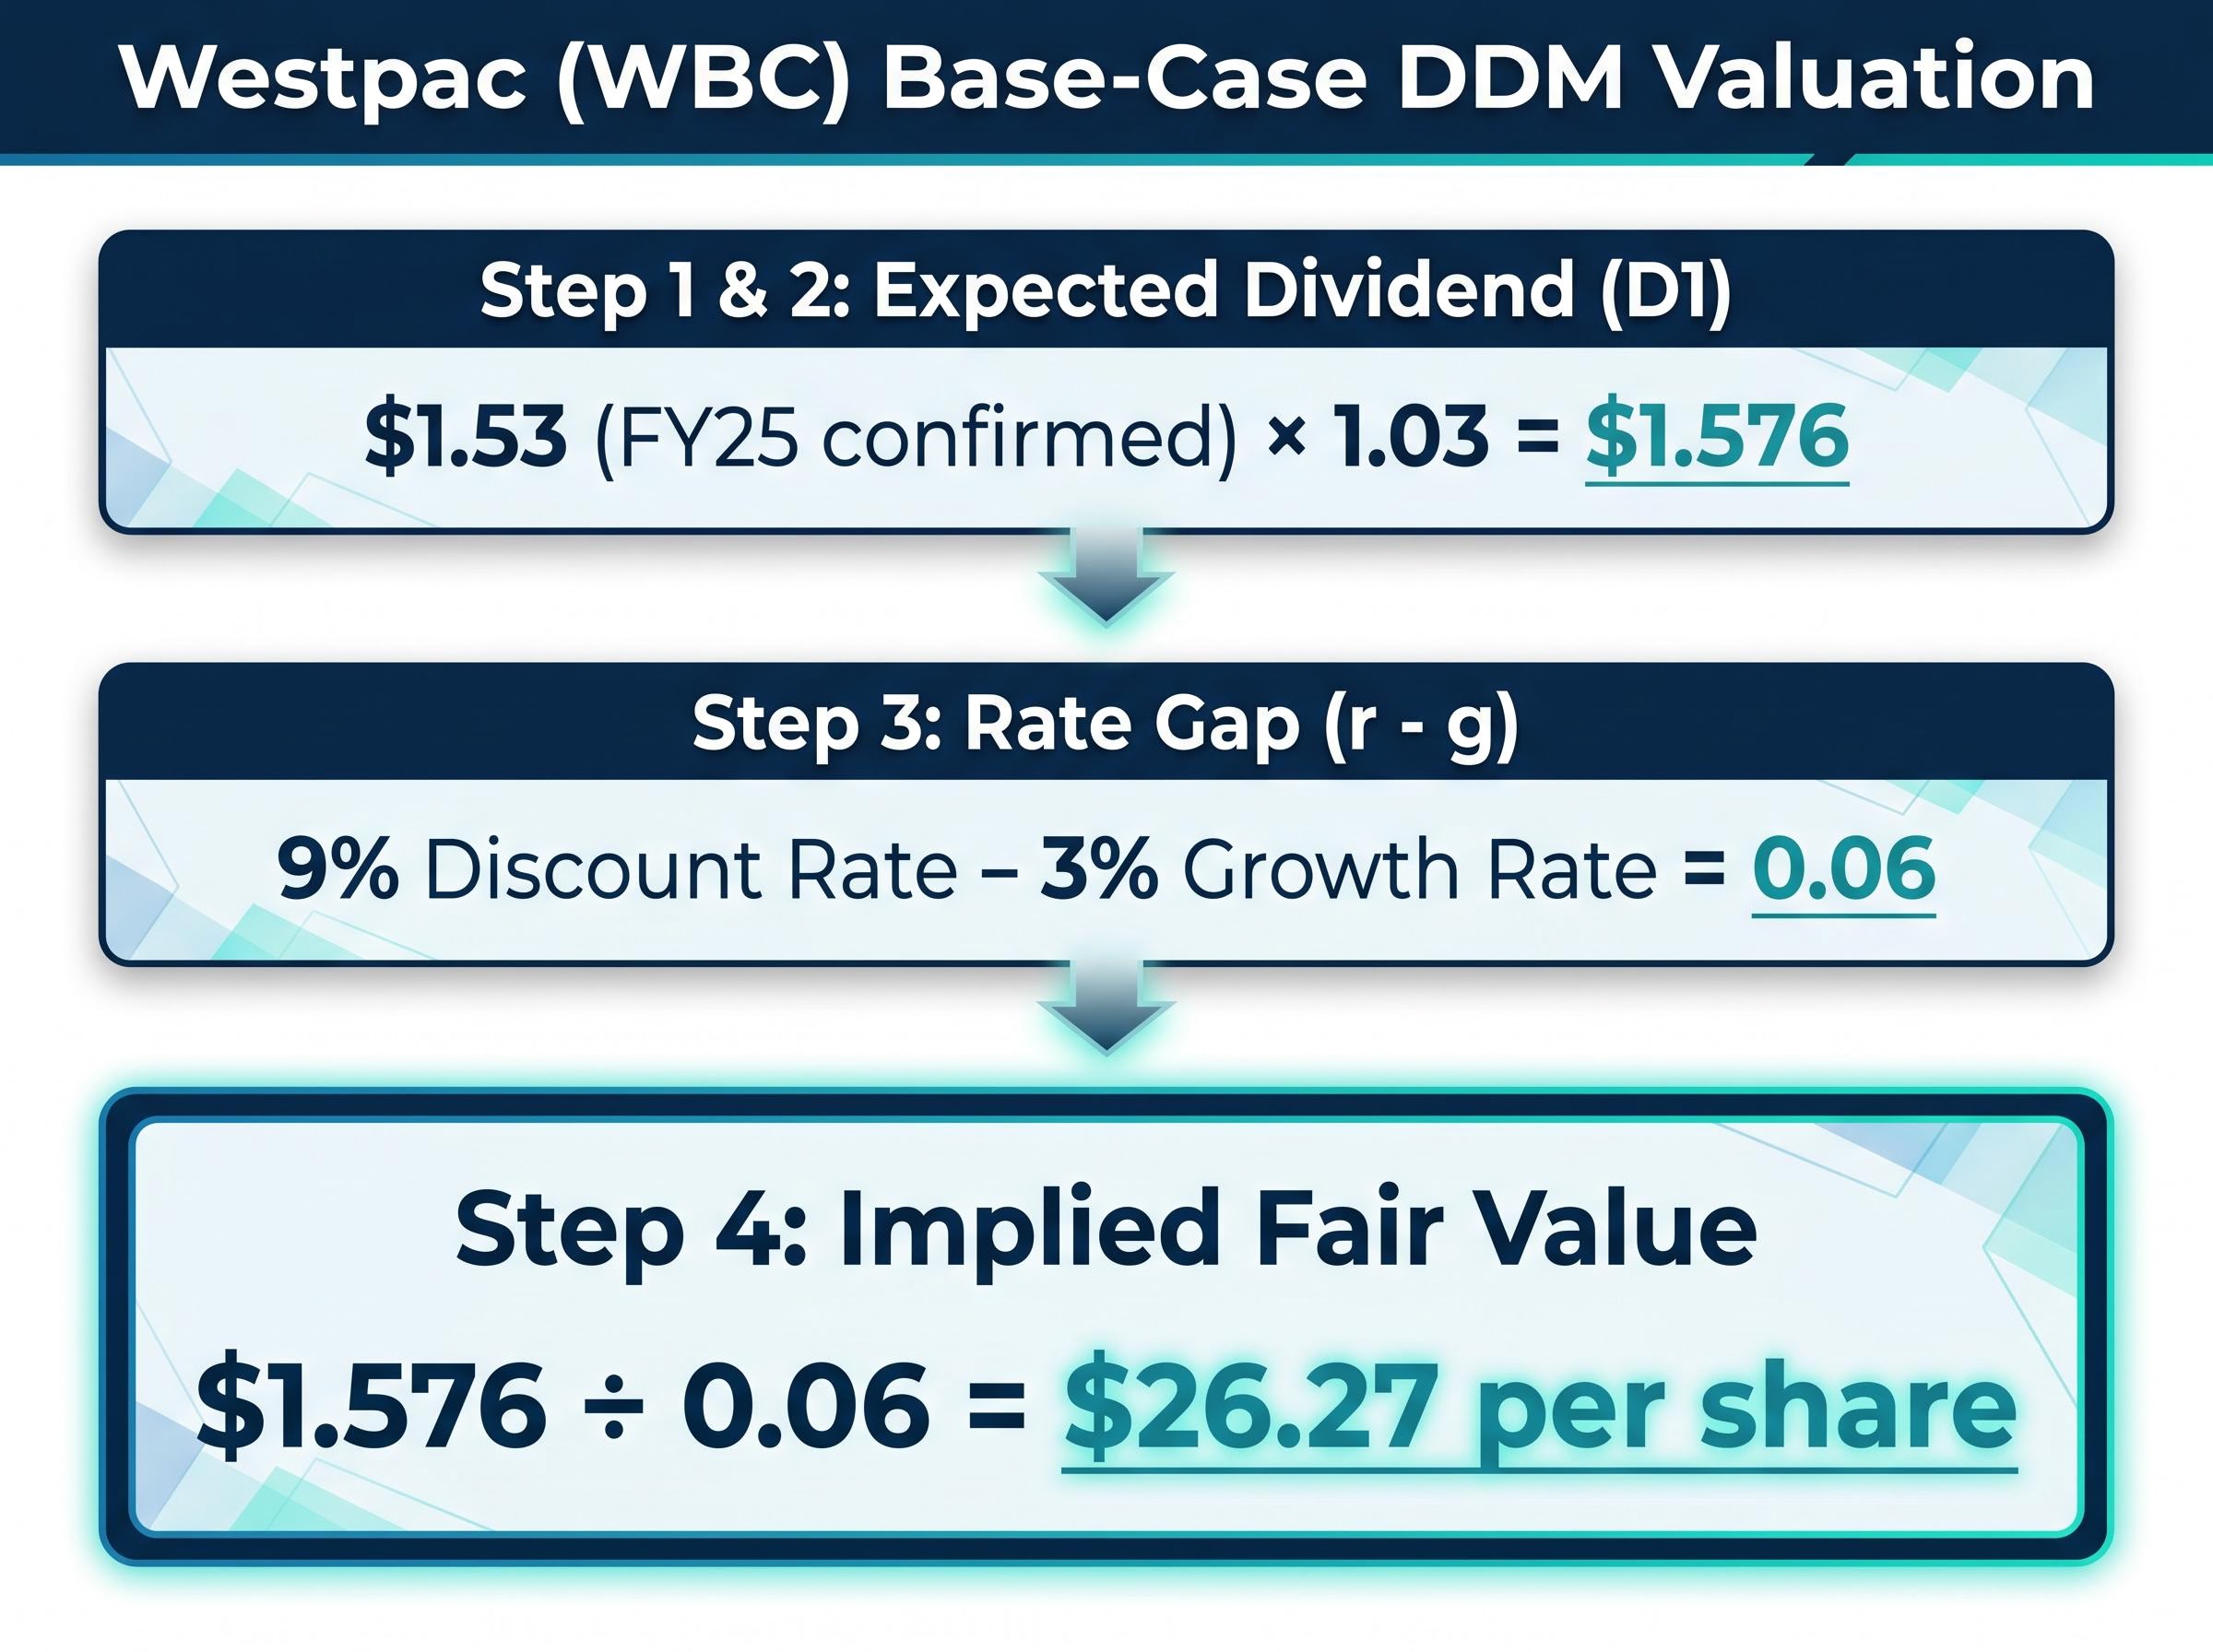
That figure sits well below WBC’s market price of approximately $36.55 in late May 2026. Before concluding the stock is overvalued, consider how sensitive this output is to its inputs.
For comparison, a scenario published by Rask Media used a higher assumed DPS of $1.66 and produced an average DDM valuation of approximately $35.10. At a 7% discount rate and 3% growth, the same Rask analysis yielded $40.25. The difference between $26.27 and $40.25 is not a modelling error; it is the direct consequence of different, defensible assumptions. The next section makes that relationship explicit.
The table below maps DDM outputs across a grid of discount rates and growth rates, using D1 of $1.576 (derived from FY25 confirmed DPS grown at the relevant growth rate for each column). The interaction between the two variables is immediate.
| Discount rate (r) | g = 2% | g = 3% | g = 4% |
|---|---|---|---|
| 8% | $26.01 | $31.52 | $39.80 |
| 9% | $22.29 | $26.27 (base case) | $31.82 |
| 10% | $19.52 | $22.52 | $26.52 |
| 11% | $17.34 | $19.69 | $22.74 |
The base case at 9%/3% implies $26.27. Move the discount rate down to 8% and growth up to 4%, and the output nearly doubles to $39.80. Push the discount rate to 11% and growth to 2%, and it drops to $17.34. Rask Media’s wider sensitivity analysis, which used a $1.66 DPS base, produced a range stretching from $17.89 (at 11% rate, 2% growth) to $80.50 (at 6% rate, 4% growth).
The mechanical explanation is straightforward. The denominator (r − g) is a small number. When r is 9% and g is 3%, the denominator is just 0.06. Shifting g from 3% to 4% halves that denominator to 0.05, lifting the output by roughly 20%. The DDM is a lever, and the fulcrum is the gap between the discount rate and the growth rate.
This is the single most important takeaway from the model. The DDM does not produce a price. It produces a range, and the assumptions chosen determine whether the model suggests WBC is cheap or expensive.
For eligible Australian shareholders, WBC’s fully franked dividends carry a value that the cash payment alone does not capture. Franking credits represent the corporate tax already paid on the earnings behind the dividend, and eligible shareholders can use those credits to reduce their personal income tax.
The grossing-up calculation adds that tax component back in:
For eligible Australian shareholders, the grossed-up DDM implies fair value of approximately $37.62 per share at consensus assumptions.
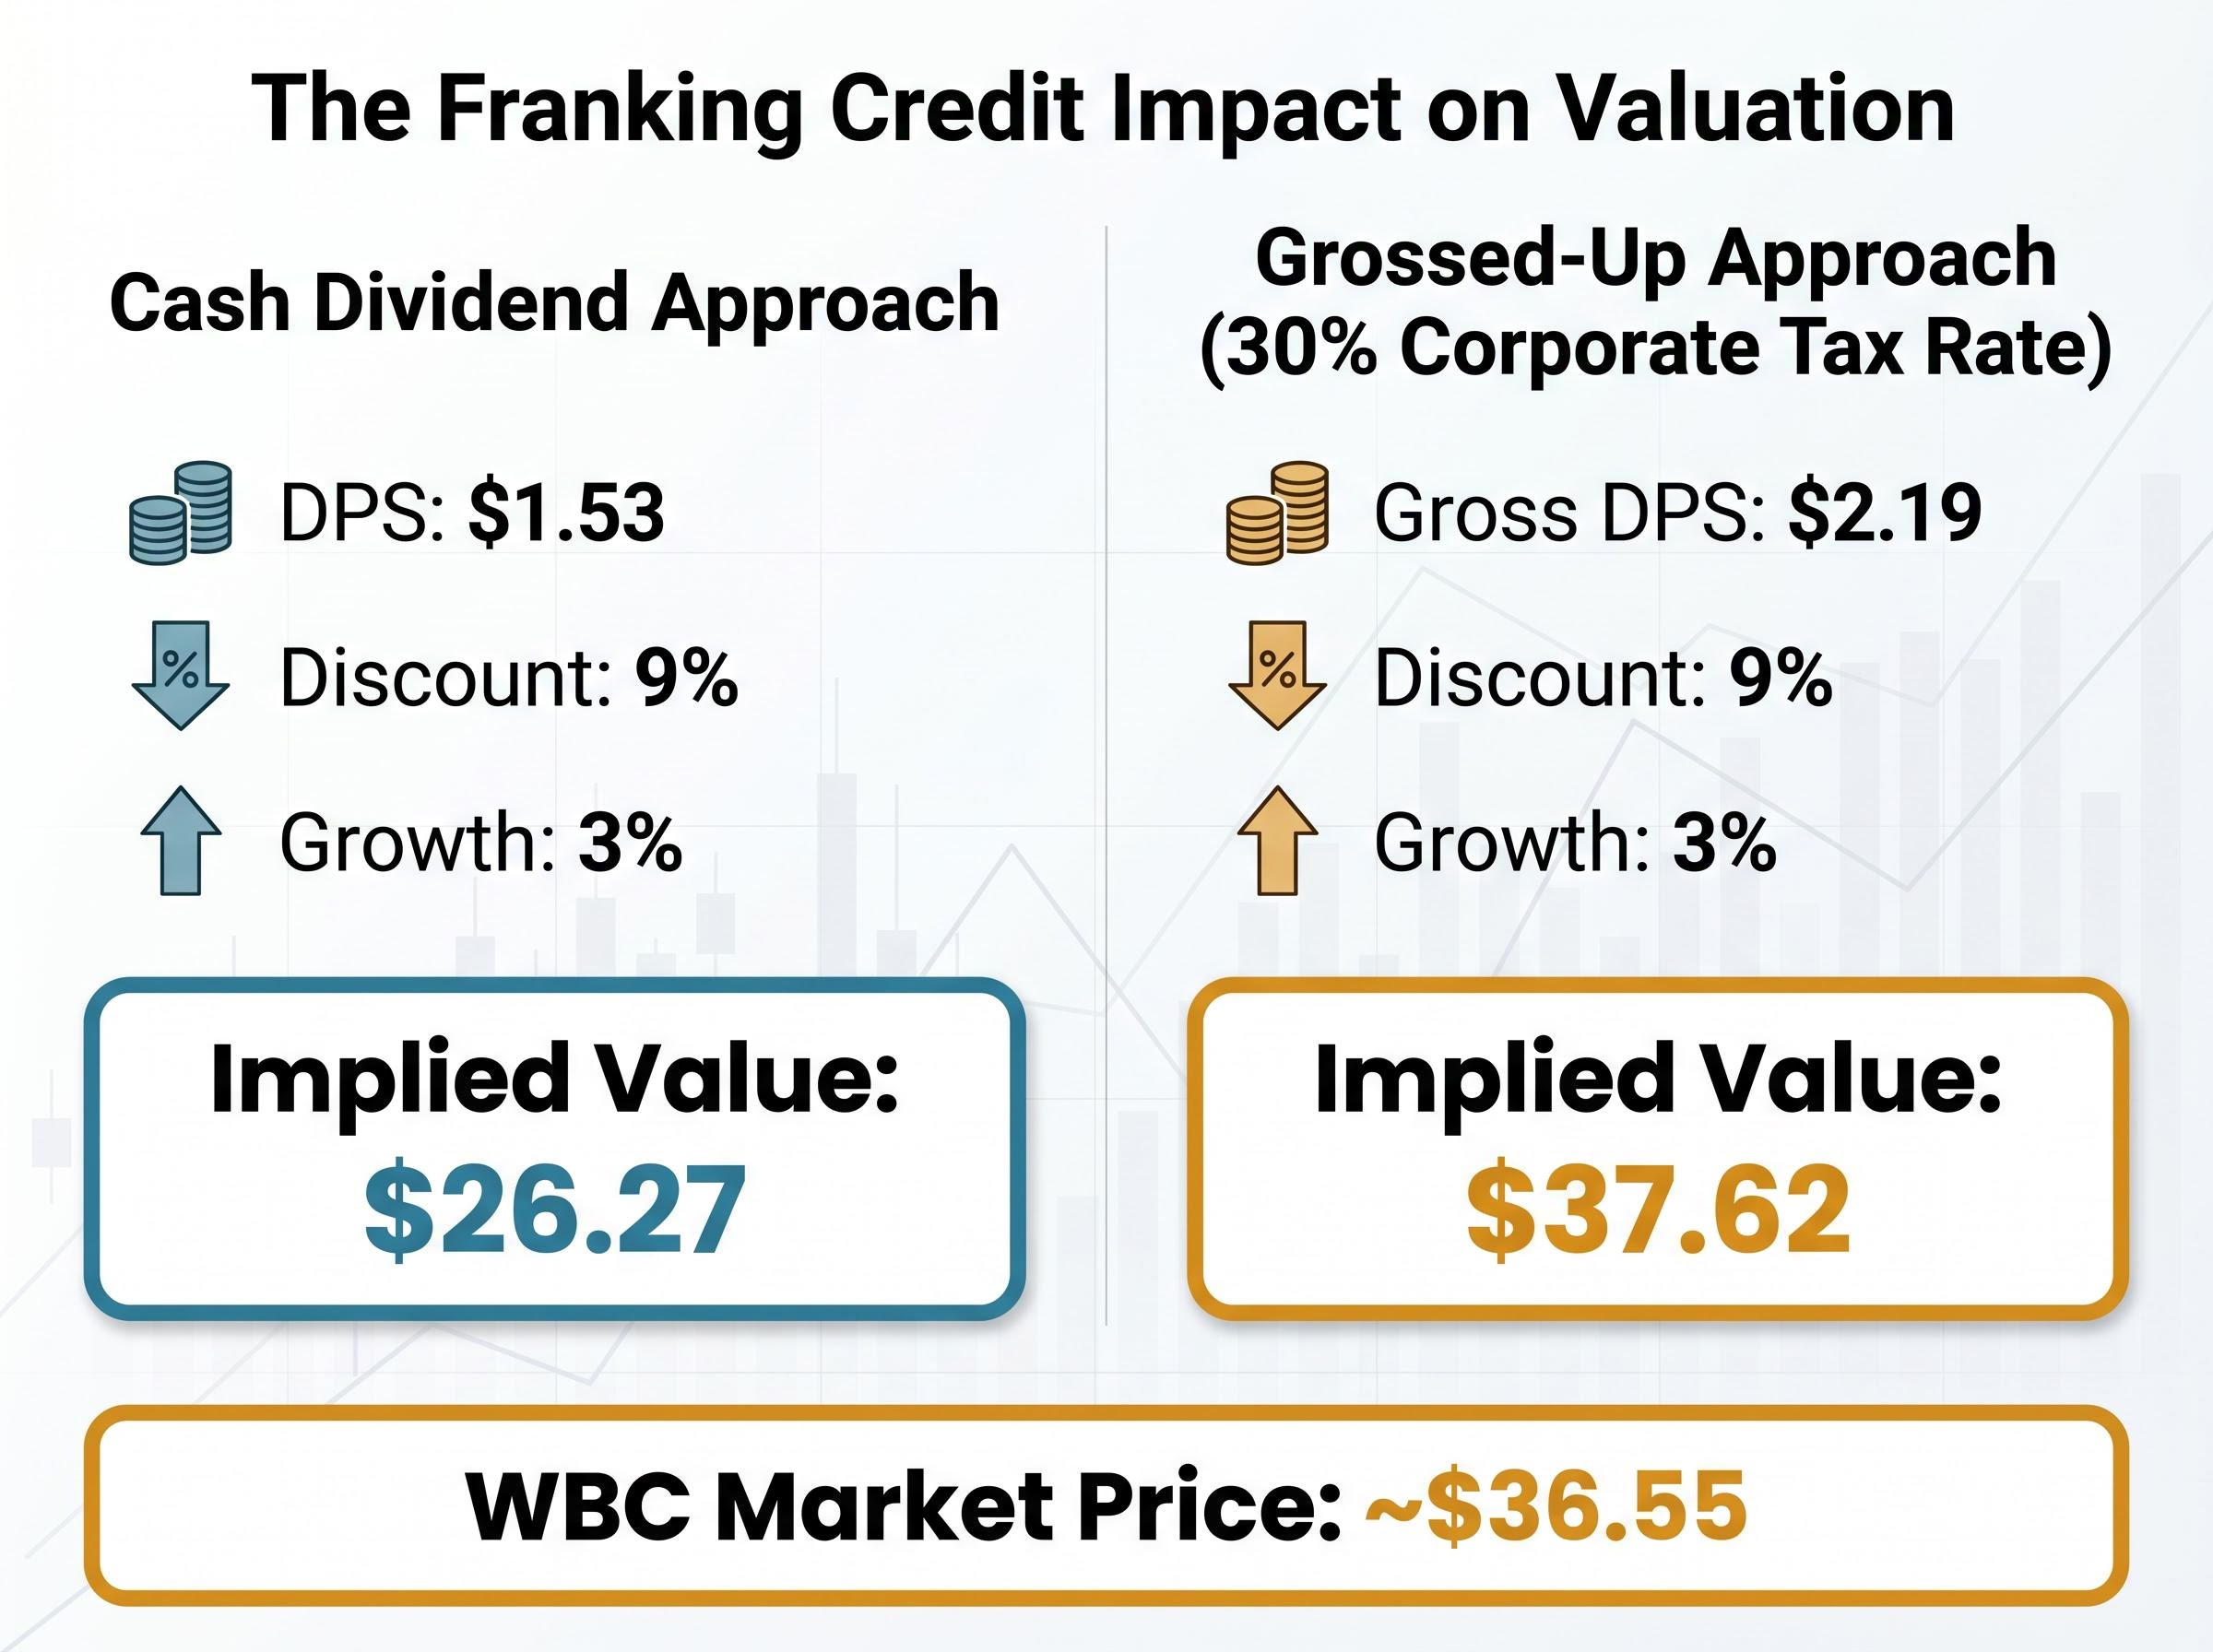
That figure sits just above the market price of approximately $36.55, a notably different signal from the $26.27 cash-dividend base case. For comparison, a Rask Media scenario using a $2.30 gross dividend produced a DDM valuation of approximately $48.64, reflecting a higher DPS assumption.
Across the scenarios in this guide, the DDM produces a wide spread of implied values. The cash-dividend base case implies approximately $26.27. The grossed-up base case for eligible Australian shareholders implies approximately $37.62. WBC’s market price of approximately $36.55 sits well above the cash output and closely in line with the grossed-up figure at consensus assumptions.
At a 9% discount rate and 3% growth, the cash-dividend DDM implies fair value of approximately $26.27, while the grossed-up equivalent for eligible Australian shareholders implies approximately $37.62, against a market price of approximately $36.55.
That positioning suggests the market may be pricing WBC closer to a grossed-up, franking-inclusive valuation for domestic shareholders, rather than a pure cash yield basis. For context, a PE-based valuation using WBC’s FY24 cash EPS of $1.92 and a sector average PE of 18x implies approximately $34.96 per share, according to Rask Media analysis.
The DDM’s structural limitations, however, are worth stating plainly:
The current interest rate environment adds a specific complication. RBA rate cuts may mechanically reduce the discount rate, lifting theoretical valuations, but can simultaneously suppress bank earnings and dividend growth through narrower margins and rising bad debts. Model outputs should be stress-tested across a range of rate scenarios rather than anchored to a single assumption.
This article is for informational purposes only and should not be considered financial advice. Investors should conduct their own research and consult with financial professionals before making investment decisions. Past performance does not guarantee future results. Financial projections are subject to market conditions and various risk factors.
The DDM does not deliver a verdict on WBC. It delivers a range, and the reader’s position within that range depends on the assumptions they find most defensible.
| Method | Implied value | Key assumption |
|---|---|---|
| Cash DDM base case | ~$26.27 | $1.53 DPS, 9% discount, 3% growth |
| Cash DDM optimistic | ~$40.25 | $1.66 DPS (Rask), 7% discount, 3% growth |
| Grossed-up DDM base case | ~$37.62 | $2.19 gross DPS, 9% discount, 3% growth |
| PE-based valuation | ~$34.96 | FY24 EPS $1.92, sector PE 18x |
The analyst consensus 12-month price target for WBC stood at approximately $35.50 per share as reported by Morningstar in May 2025. WBC’s market price of approximately $36.55 in late May 2026 sits within the upper portion of this valuation range.
The methodology itself is directly replicable. The same three inputs, the same formula, and the same sensitivity table approach can be applied to any ASX-listed dividend stock where payout stability makes the DDM’s assumptions reasonable.
Three next steps for any investor using this framework:
The Dividend Discount Model (DDM) values a stock by calculating the present value of all its future expected dividends, discounted back to today. It suits mature bank stocks like Westpac because their predictable payout ratios and long dividend histories make the model's assumption of stable, ongoing dividends more realistic than for growth-stage companies.
Using Westpac's confirmed FY25 dividend of $1.53 per share, a 9% discount rate, and 3% long-term growth, the cash-dividend DDM implies a fair value of approximately $26.27 per share, well below the market price of roughly $36.55 in late May 2026.
Eligible Australian shareholders can gross up Westpac's fully franked dividend by dividing by 0.70 (reflecting the 30% corporate tax rate), which raises the effective DPS to approximately $2.19 and lifts the DDM fair value estimate to roughly $37.62 per share, much closer to the May 2026 market price.
The DDM is highly sensitive to its inputs because the denominator (discount rate minus growth rate) is a small number; moving the discount rate from 9% to 8% and growth from 3% to 4% pushes the implied value from $26.27 to nearly $39.80, illustrating why the model produces a range rather than a single price.
You need three inputs: D1 (next year's expected dividend, calculated by growing the most recent confirmed payout by your assumed growth rate), r (your required rate of return or cost of equity), and g (the long-term dividend growth rate); the formula is simply D1 divided by the difference between r and g.