How the Dividend Discount Model Works for ASX Bank Investors
1 hr ago

The ASX 200 allocates roughly half its weight to just two sectors, financials and materials, which means the average Australian investor holding domestic shares owns a portfolio that bears little resemblance to the global economy. With international equity ETFs capturing the majority of net flows in 2024 and the broader Australian ETF market approaching $200 billion in total funds under management, the shift offshore is well underway. Two ASX-listed funds sit near the centre of this trend: the Vanguard S&P 500 ETF (ASX: V500) and the VanEck MSCI International Quality ETF (ASX: QUAL). They represent contrasting philosophies for solving the same diversification problem. What follows is a direct comparison across methodology, cost, sector exposure, and currency risk, providing a framework for deciding which fund fits a given portfolio, or whether both belong in it.
The big four banks and major miners dominate the ASX 200, and the imbalance is structural rather than cyclical. Financials and materials together account for roughly half the index’s total weight, a concentration that leaves Australian portfolios heavily exposed to two sectors while underweighting the earnings drivers that power the rest of the global equity market.
The sectors largely absent from the ASX, or present only in thin slices, include:
This is not merely an aesthetic gap. As Morningstar Australia noted in May 2024, home bias towards the ASX exposes investors to cyclical earnings risk and regulatory risk concentrated in banks and resources.
According to Livewire Markets (August 2024), portfolio managers have warned that the ASX’s heavy concentration in financials and materials leaves domestic-only investors vulnerable to sector-specific downturns, recommending global ETFs as a structural counterweight.
Financial advisers interviewed by Money Management in April 2024 confirmed the pattern: many client portfolios remain overweight ASX 200 banks and miners, with international quality and S&P 500 exposures increasingly appearing in model portfolios as a corrective measure.
The return cost of home bias is quantifiable: over the decade to June 2025, the ASX 200 delivered 11.1% annualised including franking credits, against the MSCI World at 12.5% and the S&P 500 at 15.5%, a gap that compounds into materially different terminal wealth outcomes even before accounting for the sector skew baked into the domestic index.
V500 tracks the S&P 500 Net Total Return Australian Dollars Index, giving investors passive, market-cap-weighted exposure to the 503 largest US-listed companies. The fund’s structure is simple by design: buy the index, hold the index, rebalance with the index.
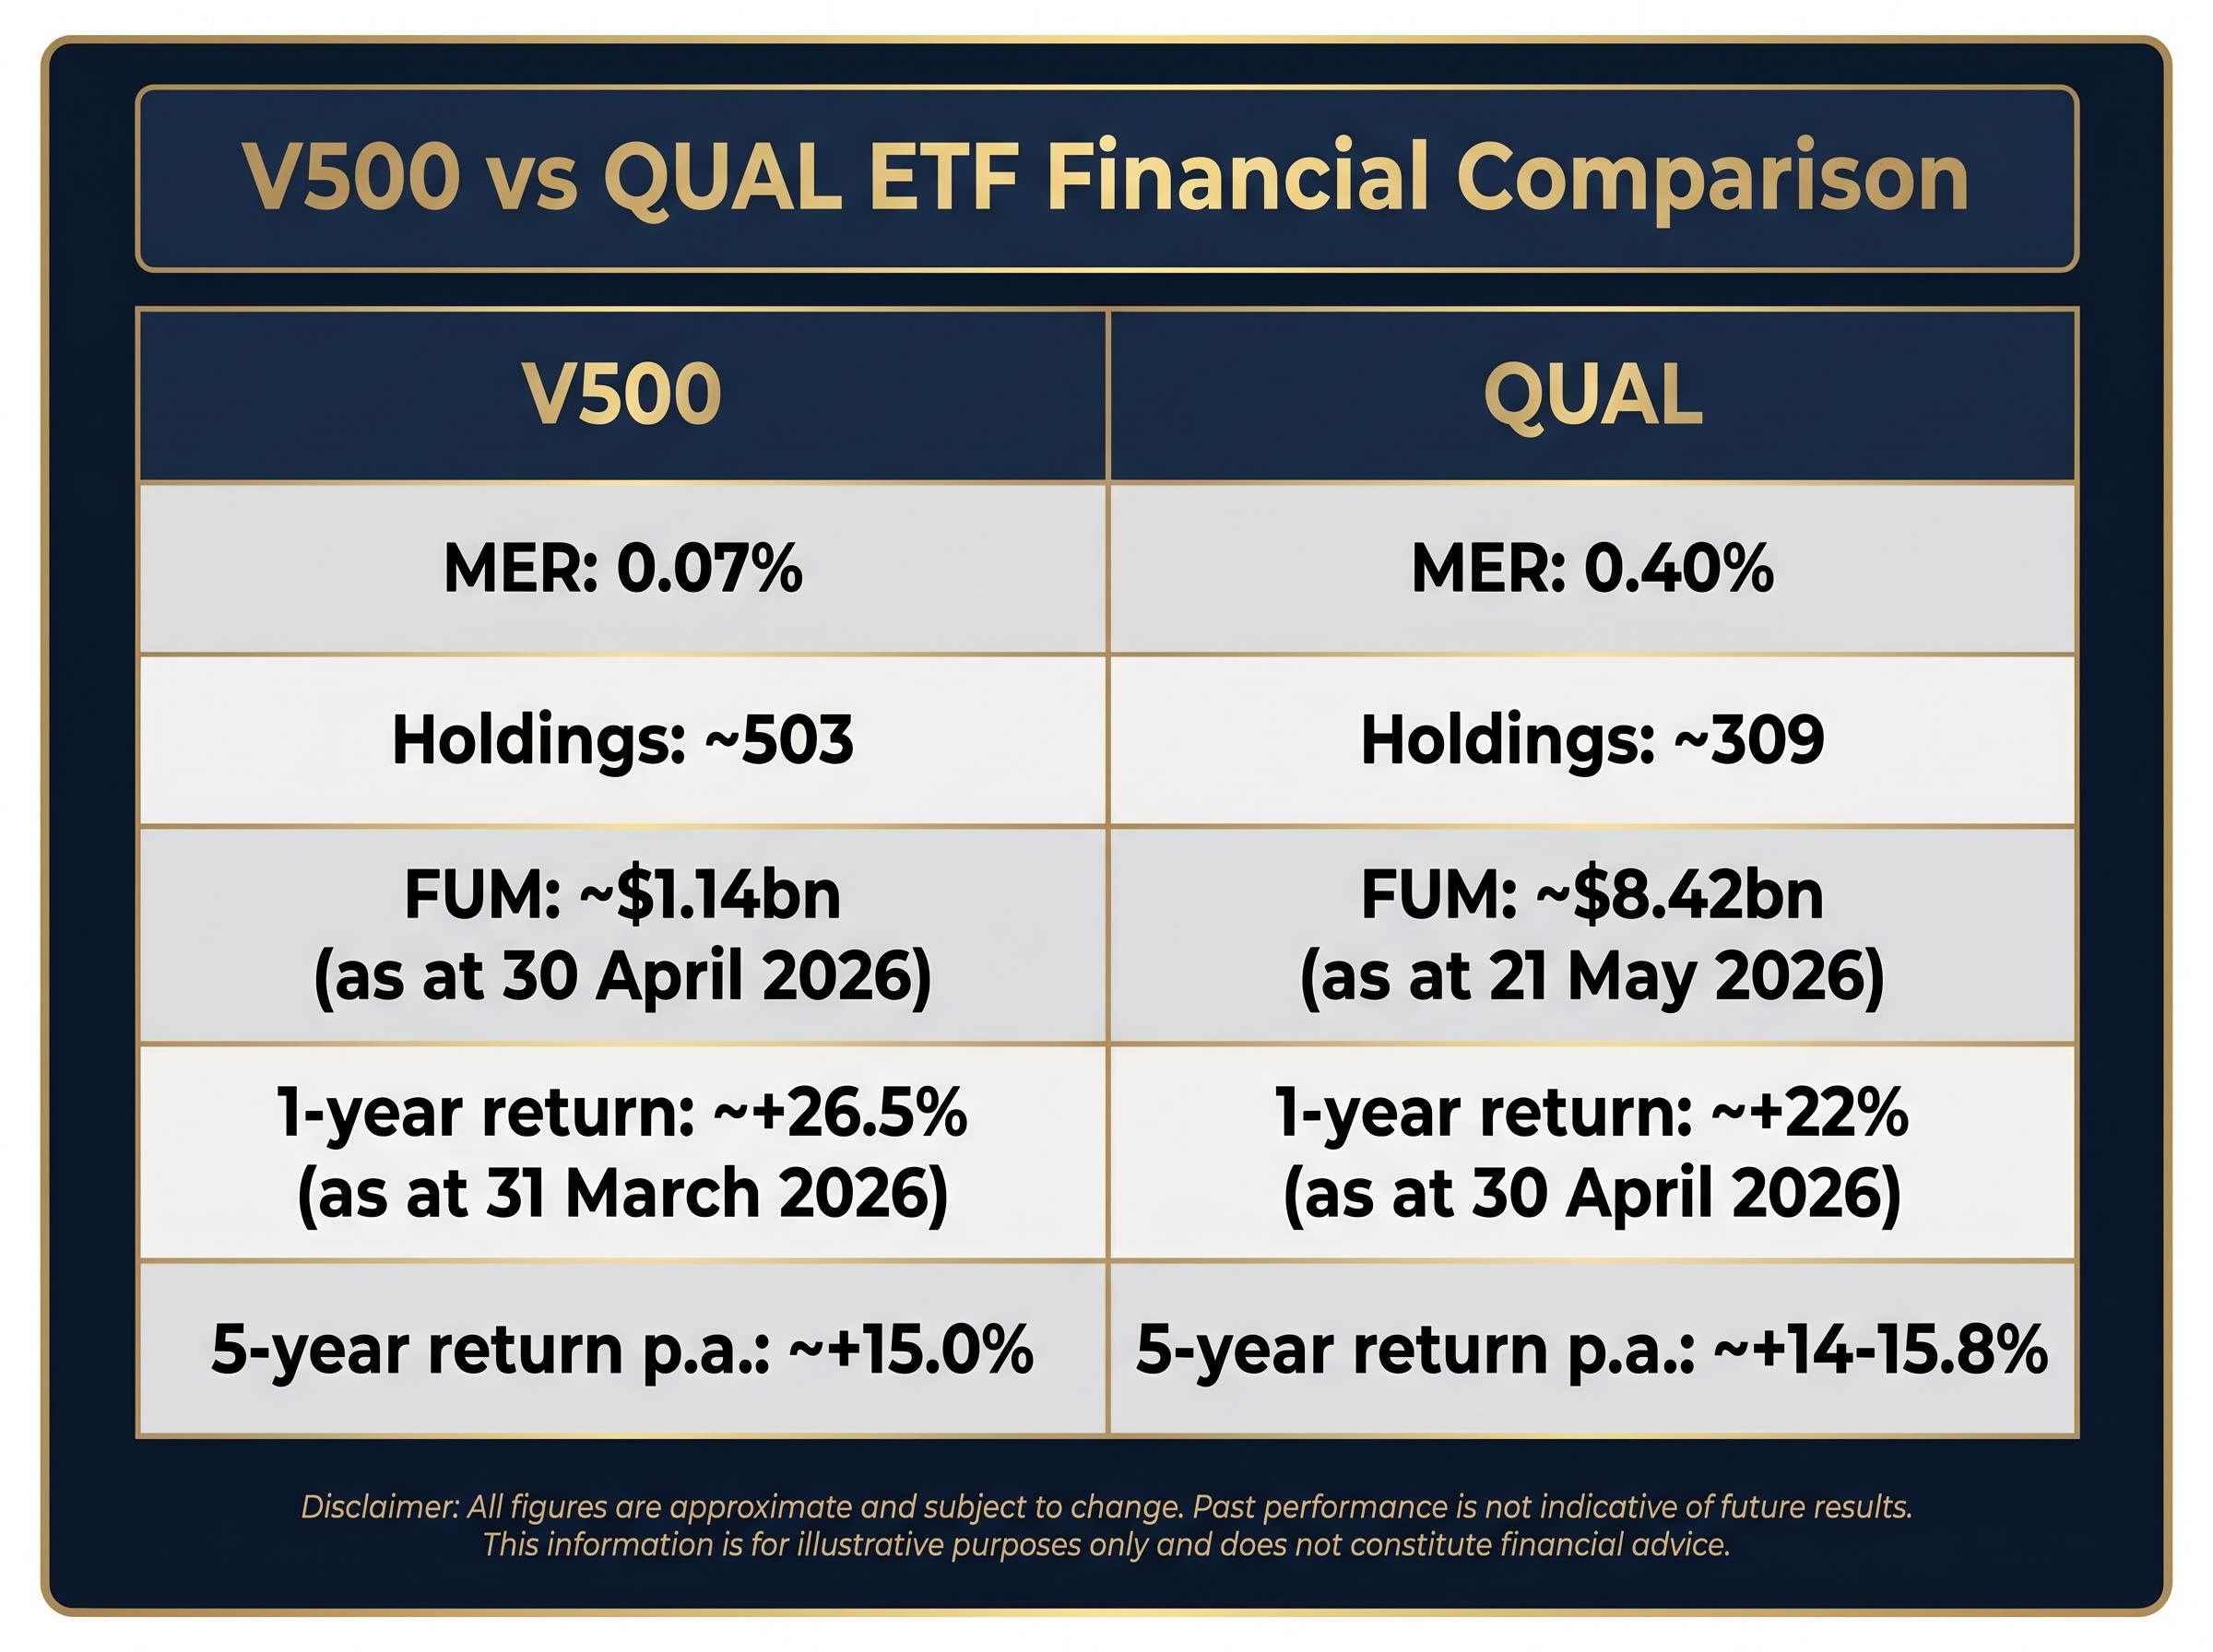
The cost of that simplicity is low. V500 charges a management expense ratio (MER) of 0.07% per annum, among the cheapest international equity ETFs available on the ASX.
0.07% per annum. On a $100,000 allocation, that equates to $70 in annual management fees, leaving the vast majority of returns compounding in the investor’s favour.
The fund held approximately $1.14 billion in funds under management as at 30 April 2026. Performance figures (net of fees, in AUD) as at 31 March 2026 show a 1-year return of approximately +26.5%, a 3-year annualised return of approximately +14.2%, and a 5-year annualised return of approximately +15.0%.
The sector composition is where V500’s diversification value becomes visible. The S&P 500’s largest sector weights include:
V500 is unhedged, meaning AUD movements directly affect translated returns. With AUD/USD trading at approximately 0.71 as at mid-May 2026, Australian investors have benefited from the weaker dollar amplifying offshore returns in recent years.
Where V500 buys the market as it is, QUAL applies an editorial filter. The fund tracks the MSCI World ex Australia Quality Index, which selects companies from developed markets globally based on three financial criteria: high return on equity (ROE), stable year-on-year earnings growth, and low financial leverage. A composite quality score determines inclusion, and the index rebalances quarterly in February, May, August, and November.
QUAL’s screens for return on equity, earnings stability, and low leverage are a direct application of quality factor investing, a strategy with a track record of outperforming during periods of market stress while lagging in momentum-driven bull markets when financially leveraged companies are rewarded alongside strong ones.
Quality screening defined: ROE measures how efficiently a company generates profit from shareholder equity. Earnings stability captures consistency of profits over time. Low financial leverage means the company carries less debt relative to its assets. Together, these three filters are designed to select businesses with durable competitive advantages and exclude financially fragile companies.
The result is a concentrated portfolio of approximately 309 securities, drawn from multiple developed markets rather than the US alone. QUAL’s top holdings include Microsoft, Apple, NVIDIA, Meta, Alphabet, Visa, Mastercard, and ASML, with individual weights in the 2-6% range depending on the rebalance date.
QUAL charges an MER of 0.40% per annum. The fund’s FUM stood at approximately $8.42 billion as at 21 May 2026, making it the largest Australian-domiciled international equity ETF by that measure. Performance (net of fees, in AUD) as at 30 April 2026 shows a 1-year return of approximately +22% and a 5-year annualised return of approximately +14-15.8%.
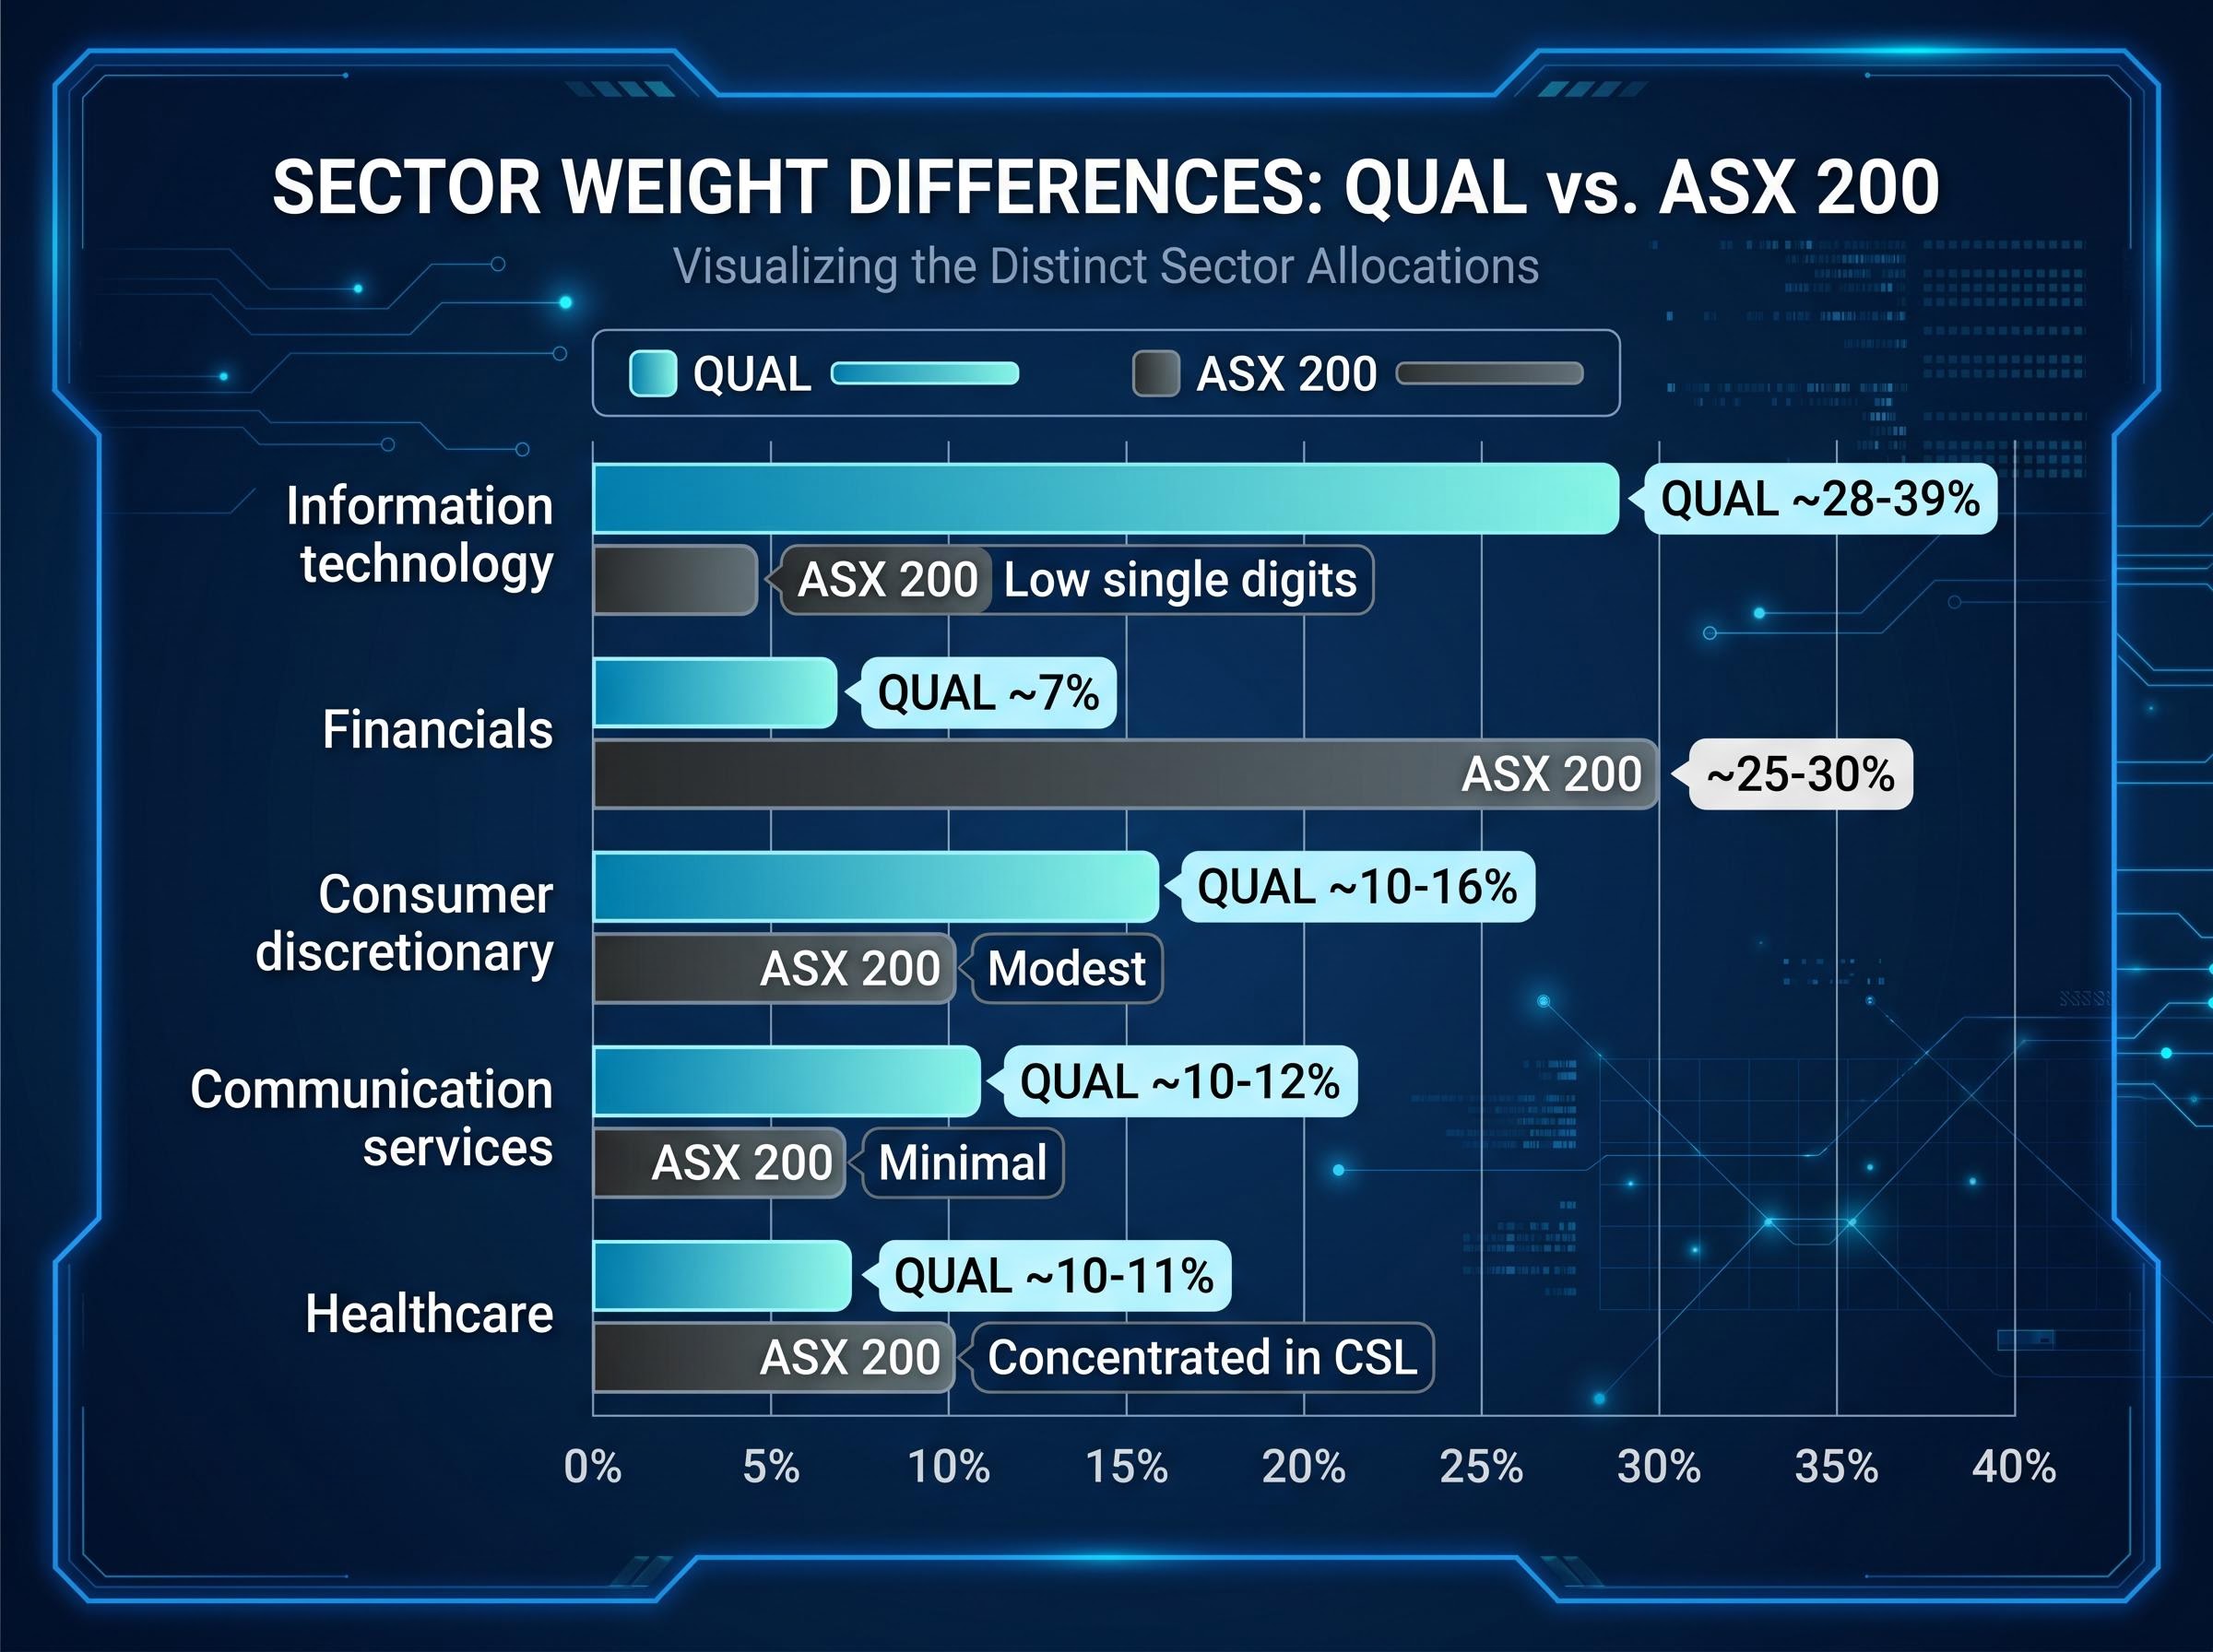
| Sector | QUAL approximate weight | ASX 200 equivalent weight | Gap |
|---|---|---|---|
| Information technology | ~28-39% | Low single digits | Significant underweight on ASX |
| Consumer discretionary | ~10-16% | Modest | Limited large-cap ASX exposure |
| Communication services | ~10-12% | Minimal | Near-absent on ASX |
| Healthcare | ~10-11% | Concentrated in CSL | Narrow ASX representation |
| Financials | ~7% | ~25-30% | ASX heavily overweight |
No material methodology change to the MSCI World Quality Index’s factor definition has been identified since January 2024. Quarterly rebalances adjust constituents and weights, but the underlying quality screen remains unchanged.
The fee differential between V500 and QUAL is 0.33 percentage points annually. On a $100,000 allocation held for 10 years, that gap compounds. At a hypothetical 10% annual return, the investor in V500 would retain roughly $3,300 more over the decade purely from lower fees; the actual figure depends on market returns, but the direction of the advantage is consistent.
Recent performance has favoured V500, with a 1-year return of approximately +26.5% versus QUAL’s approximately +22%, reflecting the strong run in US large-cap technology names that V500 holds in full market-cap proportion. Over 5 years, the gap narrows: V500 at approximately +15.0% annualised versus QUAL at approximately +14-15.8% annualised.
Factor premium cyclicality is a material consideration when evaluating QUAL over long holding periods; the quality premium, like all factor premiums, can underperform cap-weighted benchmarks for extended multi-year stretches, and investors who rotate into quality ETFs after strong recent performance runs historically face worse realised outcomes than those who hold through full cycles.
| Metric | V500 | QUAL | Difference | Implication |
|---|---|---|---|---|
| MER | 0.07% | 0.40% | 0.33 ppt | V500 compounds more at lower cost |
| FUM | ~$1.14bn | ~$8.42bn | QUAL ~7x larger | QUAL has deeper liquidity |
| Holdings | ~503 | ~309 | 194 more in V500 | V500 broader; QUAL screened |
| 1-year return (AUD) | ~+26.5% | ~+22% | ~4.5 ppt | US tech rally favoured V500 |
| 5-year p.a. (AUD) | ~+15.0% | ~+14-15.8% | Close parity | Longer-term returns converge |
The three primary trade-off dimensions are:
Both funds are unhedged, with AUD/USD at approximately 0.71 as at mid-May 2026. According to Morningstar Australia (July 2024), for long-term investors, currency tends to add volatility but may not significantly alter long-run expected returns.
Both V500 and QUAL are unhedged, which means every movement in the Australian dollar directly affects the AUD-denominated returns investors receive. The mechanics are straightforward: a weaker AUD amplifies translated returns from offshore holdings, while a stronger AUD compresses them.
With AUD/USD trading at approximately 0.71 as at mid-May 2026, the Australian dollar sits below its long-run average. That positioning has worked in favour of unhedged global ETF holders over recent years.
According to Morningstar Australia (July 2024), currency tends to add volatility to international equity returns but may not significantly change long-run expected outcomes for investors with extended time horizons.
Livewire Markets reported in September 2024 that the weaker AUD over 2022-2024 had materially boosted returns from unhedged global equity ETFs, while fund managers warned that a reversal could drag on future performance. Financial advisers cited by The Australian in May 2024 noted that with the AUD near the lower part of its historical range, some remain comfortable with unhedged positioning, viewing reversion risk as a longer-term consideration.
As Money Management observed in February 2024, investors should understand whether their ETF is hedged or unhedged and align that choice with their risk tolerance and time horizon. For both V500 and QUAL, currency is not a footnote; it is an active return variable.
The choice between V500 and QUAL depends less on which fund is “better” and more on what problem the investor is solving.
| Investor priority | Preferred fund | Rationale |
|---|---|---|
| Cost minimisation | V500 | 0.07% MER; minimal fee drag over long holding periods |
| Quality factor tilt | QUAL | Screens for ROE, earnings stability, and low leverage across global developed markets |
| Combined diversification | Both | V500 provides low-cost US anchor; QUAL adds geographic breadth and quality screen |
According to the BetaShares Australian ETF Review (January 2025), international equities were the top category for net inflows in 2024, driven partly by Australia’s concentrated sharemarket. Adviser Ratings (October 2024) reported that advisers are tilting more client portfolios offshore via international ETFs to access sectors under-represented on the ASX.
A combined allocation produces a blended fee between 0.07% and 0.40%, addresses the ASX’s sector concentration, and reduces the US-only country risk that V500 carries in isolation.
Both funds carry risks that no allocation strategy eliminates:
This article is for informational purposes only and should not be considered financial advice. Investors should conduct their own research and consult with financial professionals before making investment decisions. Past performance does not guarantee future results.
The case for reducing ASX concentration is not a call on whether US or global equities will outperform Australian shares over the next quarter. It is a structural portfolio construction decision, one that addresses a measurable sector skew baked into the domestic index.
Vanguard’s home bias analysis for Australian investors draws on ATO and ASX Investor Study data to show that domestic portfolios are concentrated far beyond Australia’s roughly 2% share of global market capitalisation, reinforcing why sector gaps in technology and communication services are a structural feature of ASX-only holdings rather than a temporary anomaly.
The Australian ETF market’s growth to approximately $200 billion in funds under management, and the record international equity inflows recorded in 2024, suggest this is already a mainstream practice. V500 and QUAL each address the same underlying problem through different mechanisms: one through low-cost passive breadth, the other through a quality-screened, geographically diversified filter.
Both funds are available on the ASX and accessible via standard brokerage platforms. Short-term volatility is the cost of accessing long-run global earnings diversification, and both funds carry it. Investors who understand what each fund does, how they differ, and where currency fits into the equation are equipped to make an informed allocation decision rather than defaulting to a domestic portfolio that looks nothing like the global economy.
For investors who are deciding on their first international equity allocation and want a step-by-step framework alongside specific fund recommendations, our dedicated guide to building a core ASX ETF portfolio covers the common fee-compounding and thematic FOMO mistakes, walks through a worked three-fund structure using A200, VGS, and V500, and addresses the annual tax obligations that Australian ETF holders need to manage.
The ASX 200 allocates roughly half its weight to just two sectors, financials and materials, leaving Australian investors heavily underexposed to global growth sectors like information technology, healthcare, and communication services. This structural imbalance means a domestic-only portfolio looks nothing like the global economy.
V500 tracks the S&P 500 with passive market-cap weighting across 503 US companies at a 0.07% MER, while QUAL applies a quality screen selecting approximately 309 companies from developed markets globally based on return on equity, earnings stability, and low leverage, at a 0.40% MER.
Both V500 and QUAL are unhedged, meaning AUD movements directly affect returns in Australian dollar terms. A weaker AUD amplifies translated gains from offshore holdings, while a stronger AUD compresses them, making currency an active return variable rather than a minor footnote.
V500 charges 0.07% per annum versus QUAL's 0.40%, a gap of 0.33 percentage points. On a $100,000 allocation held for 10 years at a hypothetical 10% annual return, the lower fee in V500 would retain roughly $3,300 more purely from reduced fee drag.
Yes, holding both is a legitimate portfolio construction approach. V500 provides a low-cost US market anchor while QUAL adds geographic breadth across developed markets and a quality screen, together producing a blended fee between 0.07% and 0.40% while addressing ASX sector concentration.